Nas100 could find support at 15600 and here is why!Nas100 might find strong support around 15600 and bounce up.
Hello traders, it shouldn't surprise us to see Nas100 falling with at least 1.7% during New York session today, as we know this is a volatile market. But here is my thought.
Last week we saw a strong move to the downside that eventually made a fake breakout through the diagonal support of the HTF ascending channel. Looking at a daily timeframe we could see buyers strength coming into play as they managed to push price up and a daily candle closed with a strong rejection, which printed a pin bar. Followed by a strong bullish candle on Tuesday, this was a strong sign that buyers could be present in the market. This is why I strongly believe that it would take a big battle for bears to successfully push price down below 15600 and this could be the level we can expect a strong impulse to the upside. As mentioned previously that bulls would be targeting 16400 level.
What are your thoughts? If you have any please be kind to share in the comment session below.
Nasdaqforecast

Nas100: investors reaction will confirm its directionNas100 direction is quite complicated at the moment. We can only wait to see how investors will react as price is currently on a very strong support level. Even though there's no much clue of it's direction, I have noted some technical signs which might send price up. The past week we saw very strong impulse to the downside, which eventually was supported by the 50 moving average and below it is the 100 moving average. Price bounced up very strongly from the 50 moving average where price rallied up strongly with almost 6%. This rally was strong that to me it shows a sign of bullish momentum.
Taking a closer look at the lower timeframe analysis, we do also see that it retraced down to a significant level which is not only offering as a solid support level but also a 38.2% fibonacci level. This level is known as an institutional level. We should not be surprised if we see a strong rejection on this level and price being pushed higher.
On the other hand, a complete violation of this level to the downside, the only levels we should carefully scrutinise Nas100 is on the 50% and 61.8% Fib Level.
I will only wait for good confirmation around this levels to give me good signs for buy opportunities with first target of 16400 and second target of 16757.
Traders, I strongly advice that you make your own analysis before making any investment decisions. What you do from my idea should be from your own discretion and responsibility should be taken by yourself for whatever result springs from your own action.
Otherwise if you find this helpful please do show your support with likes.
Wishing everyone success in trading.

BUY NASDAQAfter the big bullish trend we've got on both Asian and European session the price wil keep pushing up, buy it now and place your SL and TP on your own

SOLOMON NUMBER of US100 (NASDAQ)The Solomon Number of US100 is: 16390
Instructions:
A- Every DECREASE in price is an opportunity to BUY. The Target is Solomon Number 16390.
B- Once the Solomon Number is touched the analysis is no longer valid to enter OR take long again.
D- Apply proper risk management according to your balance.
1st short entry@ now
TP@ 16390

Nas100 update: buy at the break of the necklineThe light is getting clearer, my bias still bullish for Nas100 for the fact that the November 2021 low wasn't breached by bears and this shows that their strength is getting diminished. Looking at current price action, we also see a possibility of a double bottom formation. If the neckline is violated, Nas100 will find its bottom at around 16110.00. For this setup to be more valid, the neckline must be violated to the top.
Please make sure to leave a like and if you have different opinion, please be kind and share your opinion in the comment section below.
Please consider checking my other ideas. follow the links below to see these previous ideas.
Trade smart!

NASDAQ100 SELL UPDATEaround 17;00 CAT the price made amazing bearish moves, however, had spiked and hit stop losses in profits (small profits for the clients but profits nun the less)
we had identified a new trend line and the price could start moving bearish from around 19;00 CAT (if respected) to an intraday broken resistance zone of 164200.20.
we are selling now as the price is overbought and touching the trendline however if you would like to play it safe wait for the price to break 16200.20 retest it then sells.

#Nasdaq - Fibonacci Levels for Support and ResistanceNasdaq looks bullish
1. Treasury yields going down, inflation worry is overblown
2. China cracking down on commodity hoarders causing Iron ore index to fall heavily.
3.Nasdaq Volatility Index VOLQ has a downtrend, which is looking go down.
Happy Trading, but still in correction, hence next move is still going to be little volatile.

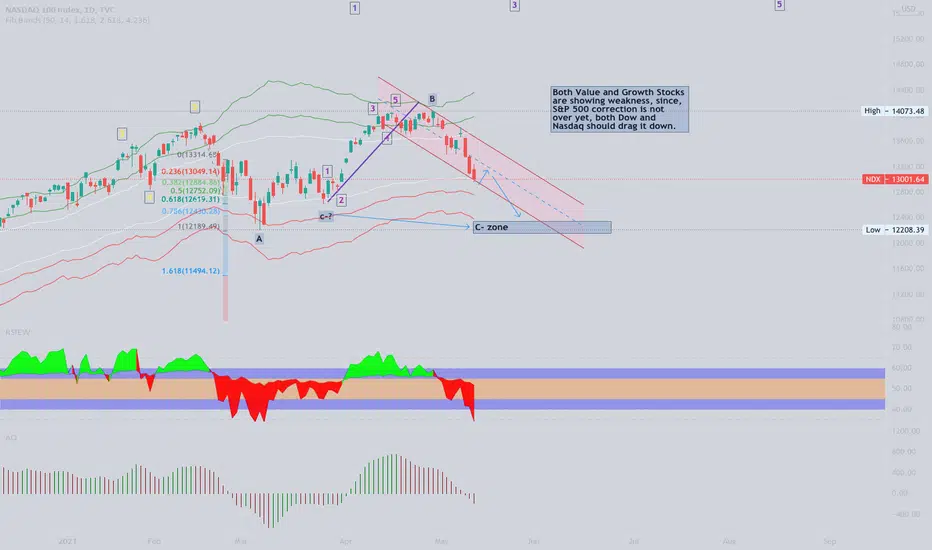
NASDAQ - Elliott Wave CorrectionStill on the bullish side, reasons given on the chart.
NASDAQ:VOLQ
- Happy Trading, beware of Correction, no one can tell where it's heading to, although I'm biased towards bullish because of VOLQ - Nasdaq volatility index.

Nasdaq100; Dump it!!Aside from a total U.S. Market Capitalization that is now in excess of 260% of U.S. GDP (the historic norm, not the low, being 78%!) ...
... and a Doubly Exponential; f(x)=a^(b^x), Central Bank(s) push in equities , up to this point, ...
... and the leverage in the system (U.S. equity markets) now easily the eclipsing all previous records, by any measure, not just in absolute terms!;
www.hussmanfunds.com
... and since the current SPAC mania is identical to the South Sea Bubble, in as much as: "Let them see not what they do!" ,
... and since the total Market Cap of the top 1500 companies, that were unprofitable for each of the past 3 years, now exceeds $2.5 Trillion,
... and because of charts like these;
www.hussmanfunds.com
... and;
www.hussmanfunds.com
... and;
www.hussmanfunds.com
...
youtu.be
... there are numerous (too many to list) other leading-, as well as coincident-indicators which would all suggest that being long here is very unlikely to turn out well.
Such as;
The valuation of Bitcoin now equates one-fifth (20%) of the entire U.S. Monetary Base ;
... and;
... and;
from this post;
... and so on.

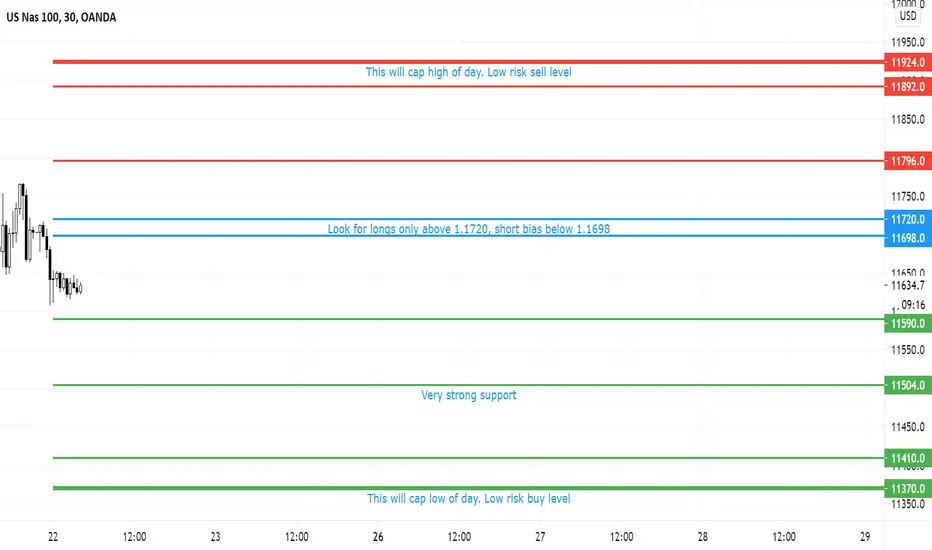
22/10/2020 NASDAQ trying to find a bottomNASDAQ still in consolidation. Stimulus news still in play and that will move the market. Personally I think the lows are not in yet.
Price at the lower end of range, but need a clear break.
I am short bias below 11698, targeting 11590, 11504, 11410. In the event 11370 trade, I see it as low risk buy level.
Above 11710, look for longs, targeting 11796, 11892. 11924 presents low risk sell level
NASDAQ 1D-TIMEFRAME ANALYSIS✨NASDAQ 1D-TIMEFRAME ANALYSIS✨
Hello ladies and gentlemen
This is my new idea for the NASDAQ
My idea is that the index will go higher
Target
13000
I hope my idea is clear
Support me by like and share
Good luck💰💯

NASDAQ 1W-TIMEFRAME ANALYSISNASDAQ 1W-TIMEFRAME ANALYSIS
Hello ladies and gentlemen
This is my new idea for NASDAQ
NASDAQ price will test 10070 daily support
My idea shows the possibility of breaking this support
But be relaxed
Real support is between 9850 and 9900 It would be good to test it
From there we will start the bull market
I hope my idea is clear
Support me by like and share
Good luck


Nasdaq Composite Still LONG Nasdaq Composite stays in the long mode and tries just now
to make new highs.
For all who are in trades here i have marked some aereas
to watch.
In addition i have added a blue Trendline which is far away at the moment
but we have to look these line in the next week.
At the moment all okay for Longs.
Good trades
If you want to support my work please like them...
and if you want to know more about my trading style
please send my a boardmail.
Renkotrade
Good trades

NASDAQ 100 SHORT 1 HR Chart 23.10.Hello to all watching my charts.
Today i come back to my NASDAQ Future which is in SHORT mode
at the moment since yesterday,
There it has been a break of the major up long trendline
and after that a break of the major support
at
7940
Since then we are SHORT
First sign of strength should be a climb above the
upper shortttime trendline of my system at nearly
7875 at the moment
and also a climb above the small resistance from today
at
7880
If not Short is still the play.
Good trades
If you want to support my work please like them...
and if you want to know more about my trading style
please send my a boardmail.
Renkotrade
