NAS100 Trade Set Up Jan 23 2026Overall price is still in a bullish trend on the daily but on the 1h its making LH/LL with a 1h FVG below that i expect to get filled along with PDL being swept before a continuation higher
Nasdaqlong

NAS100 Trade Set Up Jan 22 2026Nas is in a clear uptrend making HH/HL on the 1h and 4h but is trading above PDH so i will expect a pullback into 4h FVG followed but i IFVG/CISD to the upside on the 1m-5m to continue higher to BSL

#NAS100 Buy Trade Setup.Here’s an up-to-date NAS100/USD Buy trade outlook (technical + fundamental) to help you assess whether positioning for a Upside makes sense right now.
Thank You......

NAS - lets make some moneyTeam, yesterday when I post the trade, then went to swimming, and 2 hours later, target hit.
Lets go LONG ON NAS at this range 25142-25126
STOP LOSS at 25030
Target 1 at 24186-25196 - PLEASE TAKE partial and bring stop loss to breakeven
Target 2 at 25225-25236
LETS GO.

NAS100 - it has been a whileTeam, it has been a while I am not trading NAS100
I am going LONG NAS at 25185-25155 ranges,
STOP LOSS at 25065
Target 1 at 25225-45 Take partial and bring stop loss to BREAK EVEN
Target 2 at 25265-25315
LETS GO

NAS100 Trade Set Up Jan 15 2026Price is bullish but i will wait for a pullback into 4h FVG followed by 1m-5m IFVG/CISD to continue to higher BSL

NAS100 Trade Set Up Jan 14 2026Price is trading under PDH but overall still remains in a bullish trend on the daily, so i will want to see London lows swept before looking for 1m-5m IFVG/CISD to target London highs

NAS100 Trade Set Up Jan 13 2026Price is in a 1h range and has swept PDH already so i will either want to see a sweep of London/Asia lows to then look for a IFVG/CISD to take buys or price to respect the 15m FVG to go higher from there

NAS100 Trade Set Up Jan 9 2026Price is trading above both Asia and London highs and inverted a 1h FVG so i will wait for a pullback to then look for 1m-5m IFVG/CISD to target PDH and higher BSL

NAS100 Trade Set Up Jan 8 2026Price has swept PDL, tapped into daily FVG and inverted a 1h FVG so i will want to see price make internal bullish structure on the 1m-5m to continue higher

NAS100 Trade Set Up Jan 7 2026Price swept PDH during Asia and came down to fill a 4h bullish FVG and now is sweeping London highs, so i will wait to see if price can test the 4h bearish FVG to then look for 1m-5m IFVG/CISD to take sells to London lows but if price can stay bullish above the 1h IFVG i will look for buys to PDH

NAS100 Trade Set Up Jan 6 2025Price has swept Asia lows and inverted a 1h bearish FVG so i will want to see bullish internal structure to continue to target Asia highs and PDH

NAS100 Trade Set Up Jan 2026Price has swept PDH and Broke Structure to the upside on the 1h so now i will expect price to sweep London lows and/or tap into the 4h FVG to then continue higher to London highs

NAS100 Trade Set Up Dec 26 2025Price is overall bullish making HH/HL on the 1h and 15m. Price has swept PDH, Asia highs and London highs so i will expect price to sweep London lows before looking for internal 1m-5m IFVG/CISD to take buys to higher levels

NAS100 Trade Set Up Dec 24 2025Price is making HH/HL on the 1h and 15m so overall im bullish. Asia highs just got swept so i will want to see a pullback followed by internal 1m-5m IFVG/CISD to continue its bullish trend higher

US100 bullish OF ( LONG IDEA )Bullish structure on US100 with unmitigated supply above.
Unmitigated supply zone likely to be revisited for mitigation.
This is not financial advice. Trade at your own risk
( Invalid if price reaches supply before triggering entry )

NAS100 Trade Set Up Dec 22 2025Price is making HH/HL on the 1h indicating bullish structure with London breaking out of Asia highs so i will want to see a pullback into 1h FVG to then look for internal 1m-5m IFVG/CISD to take buys higher

NAS100 Trade Set Up Dec 19 2025Price is making HL on the 1h so if price first sweeps London highs/PDH then comes to sweep SSL/London lows or Asia Lows i will then look for internal 1m-5m IFVG/CISD to take buys higher to higher BSL and supply

NAS100 Trade Set Up Dec 18 2025Price came down to strong demand, bounced off it, and has inverted a 1h FVG so i will wait for a pullback followed by internal 1m-5m IFVG/CISD to take buys to PDL and fib levels

NAS100 Trade Set UP Dec 16 2025Price swept PDL and Asia lows already and has inverted a 1h FVG so i will wait for internal 1m-5m bullish structure to target PDH

NAS100 Trade Set Up Dec 12 2025I am expecting price to sweep London lows and/or tap into demand before looking for internal 1m-5m IFVG/CISD to target BSL/Asia highs and 30m gap

NAS100 Trade Set Up Dec 10 2025Price is testing 1h FVG so i i see internal 1m-5m IFVG/CISD from here i will target BSL/London highs

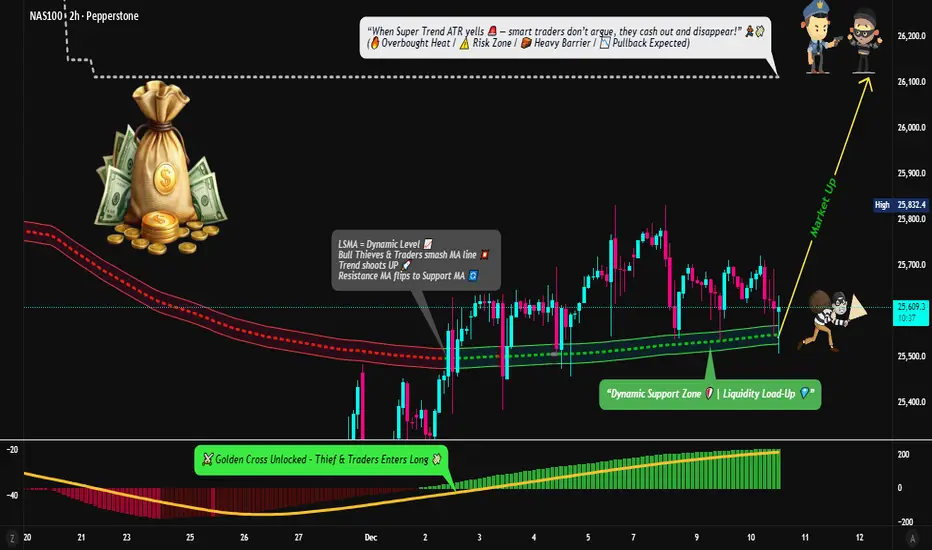
NASDAQ100 Strong Bullish Momentum — Clean Entry & Exit Blueprint⚡ THIEF STRATEGY ALERT: Golden Cross Breakout Setup
📈 TRADE PLAN OVERVIEW
Asset: NAS100 (NASDAQ 100 Index)
Timeframe: Day/Swing Trade
Market Bias: 🟢 BULLISH (Moving Average Breakout + MACD Golden Cross Confirmed)
Strategy Type: Layered Entry Approach (Multi-Level Limit Orders)
🎯 ENTRY STRATEGY - "THIEF LAYERING METHOD"
Multiple Limit Order Entry Points (Build Position Gradually):
📍 Layer 1: 25,400 (First Entry)
📍 Layer 2: 25,500 (Second Entry)
📍 Layer 3: 25,600 (Third Entry)
💡 Pro Tip: Adjust layer levels based on your capital allocation & risk tolerance. This pyramiding approach reduces average entry cost and limits downside risk.
Why This Method? The layered entry reduces emotional trading, averages down your entry price, and ensures you're not all-in on one level.
🛑 STOP LOSS - "THIEF OG PROTECTION"
Suggested SL Level: 25,200
⚠️ IMPORTANT DISCLAIMER: This is a reference level only. Adjust your stop loss based on:
Your personal risk tolerance
Account size & position sizing
Technical support levels on your timeframe
🔴 Remember: Risk management is YOUR responsibility. Set stops that protect YOUR capital.
🎁 PROFIT TARGET - "POLICE BARRICADE RESISTANCE"
Primary Target: 26,100
📊 Technical Confluence:
SUPERTREND ATR Line = Strong Dynamic Resistance
Overbought Zone Alert = Potential Reversal Risk
Resistance Trap = Take profits before reversal occurs
⚠️ CRITICAL NOTE: Partial profit-taking recommended. Don't be greedy at target levels—accumulate gains gradually:
🟢 Take 30-40% profit at 26,100
🟢 Move SL to breakeven, trail remaining position
🟢 Exit second half on additional resistance or SUPERTREND reversal
💰 YOUR DECISION: Profit targets are YOUR choice. Trade at your own risk and manage your exit strategy.
🔗 CORRELATED PAIRS TO WATCH (Risk/Opportunity Indicators)
1. SPY (S&P 500 ETF) - USD Strong Correlation (0.95)
Key Point: Leads or confirms NAS100 moves
Watch For: If SPY breaks below key support, NAS100 pullback likely
Action: Use SPY strength to confirm NASDAQ100 breakout validity
2. QQQ (NASDAQ 100 ETF) - Perfect Mirror (1.0 Correlation)
Key Point: Direct tracker of your asset
Watch For: Volume spikes, divergence patterns
Action: Cross-reference QQQ volume with NAS100—lack of volume = weak breakout
3. DXY (US Dollar Index) - Inverse Correlation (-0.75)
Key Point: Strong dollar = tech selloff risk
Watch For: DXY rejection at key levels
Action: If DXY rallies hard, NAS100 bullish bias weakens—be cautious
4. TLT (20-Year Treasury ETF) - Indirect Inverse (-0.60)
Key Point: Rising rates pressure growth stocks (NASDAQ)
Watch For: TLT breakdown = rate hike concerns = tech pressure
Action: Monitor TLT support; if breaks, expect NAS100 resistance
5. GLD (Gold ETF) - Risk-On Indicator (0.40)
Key Point: Flight-to-safety alternative
Watch For: Sharp gold strength = risk-off environment forming
Action: Gold spike with NAS100 move down = sell signal confirmation
6. VIX (Volatility Index) - Fear Gauge (-0.80)
Key Point: Rising VIX kills bullish momentum
Watch For: VIX above 20 = caution on long positions
Action: If VIX spikes during entry, wait for stabilization before scaling in
✅ CHECKLIST BEFORE ENTRY
Moving Average crossover confirmed (golden cross visible)
MACD histogram turned positive
Price closed above key moving average
Volume supporting the move
Correlated pairs (QQQ/SPY) confirming bullish setup
DXY not in strong uptrend (tech-unfriendly)
VIX stable or declining
🎯 TRADE MANAGEMENT RULES (THIEF OG STYLE)
Scale In: Use limit orders—don't chase price
Protect Profits: Move stop to breakeven after first target hit
Trail Stops: Let winners run while protecting gains
Take Partials: Secure profits incrementally—greed kills traders
Monitor Correlations: Watch correlated pairs for early warning signals
Respect Risk: NEVER risk more than 2% per trade
⚠️ RISK DISCLAIMER
This is an Educational Guide Only for trading strategy examples.
🔴 NOT Financial Advice: I am not a financial advisor, and this does NOT constitute investment advice.
🔴 Your Responsibility: All entry, exit, and stop-loss decisions are YOUR choice and YOUR responsibility.
🔴 Past Performance ≠ Future Results: Market conditions change; strategies may fail.
🔴 Risk Capital Only: Trade only with money you can afford to lose completely.
Trade at your own risk. Always do your own research (DYOR).
💪 THIEF OG'S MINDSET
Dear Ladies & Gentlemen (Thief OG's),
Success in trading isn't about following someone else's exact setup—it's about understanding the WHY behind each decision, adapting to YOUR risk tolerance, and executing with DISCIPLINE.
This guide provides the framework. You provide the execution. Make your profits, protect your capital, and trade smart. 🎯
Now go earn those tendies, OG's! 💰📈
Last Updated: December 2025
Strategy Type: Day/Swing Trade | Timeframe: 4H-Daily