NAS100 Trade Set Up Jan 7 2026Price swept PDH during Asia and came down to fill a 4h bullish FVG and now is sweeping London highs, so i will wait to see if price can test the 4h bearish FVG to then look for 1m-5m IFVG/CISD to take sells to London lows but if price can stay bullish above the 1h IFVG i will look for buys to PDH
Nasdaqshort

NAS100 Trade Set Up Jan 5 2026Price has made a LL on the 1h and is now filling a 4h FVG so i will like to see London highs swept to then get a pushdown to Asia/London lows

Bearish Supply Zone On NASAQTwo Supply Zones, one in the extreme at the External high, and the other in the Internal High.
Could get a reaction from the internal high and continue to plough through to the extreme zone, or we could get a confirmation signal from that zone and continue with the bearish trend.

NAS100 Trade Set Up Dec 2025Price is overall bearish on the 4h making LL/LH and has swept both Asia and London highs so i will wait for internal 1m-5m IFVG/CISD to take price lower to London lows

NAS100 Trade Set Up Dec 23 2025Price is playing in a tight daily range and has swept PDL so i will like to see price sweep Asia and London highs then internal 1m-5m IFVG/CISD to take sells to 4h FVG

NAS100 Trade Set Up Dec 17 2025Price is making LL/LH on the 1h/4h and broke structure to the downside yesterday to now test supply and sweep PDH so i will wait for internal 1m-5m IFVG/CISD to target PDL

NAS100 Trade Set Up Dec 15 2025Price has broke structure to the downside on friday making a LL and is currently trading at a 4h FVG with a 4h supply above and has already swept BSL and London highs so i will look for internal 1m-5m IFVG/CISD to sell down to Asia low and PDL

NAS100 Trade Set Up Dec 10 2025Price has swept PDH in Asia session then swept Asia lows in London now i will expect price to sweep London highs and/or tap into supply to then continue its bearish trend to PDL and demand

NAS100 Trade Set Up Dec 9 2025Price remains under bearish pressure making LH/LL on the 1h so i will wait for a reaction from London lows or PDL to then come back up to sweep internal BSL/LRLR to then make internal bearish structure to continue lower to SSL/demand

NAS100 Trade Set Up Dec 8 2025Price has tapped into supply and has swept London/Asia highs so i will wait to see if price can sweep PDH first to then look for internal 1m-5m IFVG/CISD target LRLR and SSL

NASDAQ 100 (NQ1!): Bullish! Look For Valid Buys Only!Welcome back to the Weekly Forex Forecast for the week of Dec. 8 - 15th.
In this video, we will analyze the following FX market: NASDAQ (NQ1!) NAS100
The NASDAQ is showing bullish order flow, and it has been strong over the past couple of weeks.
Trading above 25,600 is making looking for shorts a no no.
A weakened US Dollar supports the idea of higher prices.
Wait for valid buy setups.
Enjoy!
May profits be upon you.
Leave any questions or comments in the comment section.
I appreciate any feedback from my viewers!
Like and/or subscribe if you want more accurate analysis.
Thank you so much!
Disclaimer:
I do not provide personal investment advice and I am not a qualified licensed investment advisor.
All information found here, including any ideas, opinions, views, predictions, forecasts, commentaries, suggestions, expressed or implied herein, are for informational, entertainment or educational purposes only and should not be construed as personal investment advice. While the information provided is believed to be accurate, it may include errors or inaccuracies.
I will not and cannot be held liable for any actions you take as a result of anything you read here.
Conduct your own due diligence, or consult a licensed financial advisor or broker before making any and all investment decisions. Any investments, trades, speculations, or decisions made on the basis of any information found on this channel, expressed or implied herein, are committed at your own risk, financial or otherwise.

NAS100 Trade Set Up Dec 5 2025Price has shifted to bearish structure and is targeting SSL and PDL but first i will wait for more internal structure on the 15m-5m to continue lower

NAS100 Trade Set Up Dec 1 2025Price is overall bullish and reacting off a daily FVG but if price comes to sweep BSL/London high and respects the 1h FVG i will look for internal sells to take to SSL and the lower daily FVG before the bullish trend continues

NAS100 Trade Set Up Nov 21 2025Price is still under strong bearish pressure to i will look for internal 1m-5m structure to take sells to lower SSL levels

NAS100 Trade Secured 2000 Pipsprice manipulated higher tapping into the fib level and sweeping extreme BSL to then engulf on the 15m, BOS to the downside to target SSL and PDL

NAS100 Trade Set Up Nov 20 2025Overall still bearish but first i want see a sweep of BSL and test for fib levels to then look for internal 5m-15m engulfing and IFVG/CISD to sell down to SSL/PDL

NAS100 Trade Set Up Nov 18 2025Price is still showing bearish pressure making LL/LH in the 1h and 15m but first id like to see BSL swept followed by IFVG/CISD on the 1m-5m before looking for sells back down to lower SSL levels

NAS100 Trade Set Up Nov 14 2025I am expecting price to continue bearish to take out lower SSL but first i want to see a test of 1h FVG to then form internal IFVG/CISD to continue its bearish trend


NAS100 Trade Set Up Nov 13 2025price is making LH on the 1h and is approaching PDL so if price continues to make LH and can make a LL under PDL i will look to take sells down to the gap that price left

NAS100 Trade Set Up Nov 11 2025Price swept PDH and inverted a 4h FVG plus broke structure to the downside on the 1h so i will want to see a internal BSL sweep to then see a continuation lower to SSL and possibly 1h FVG

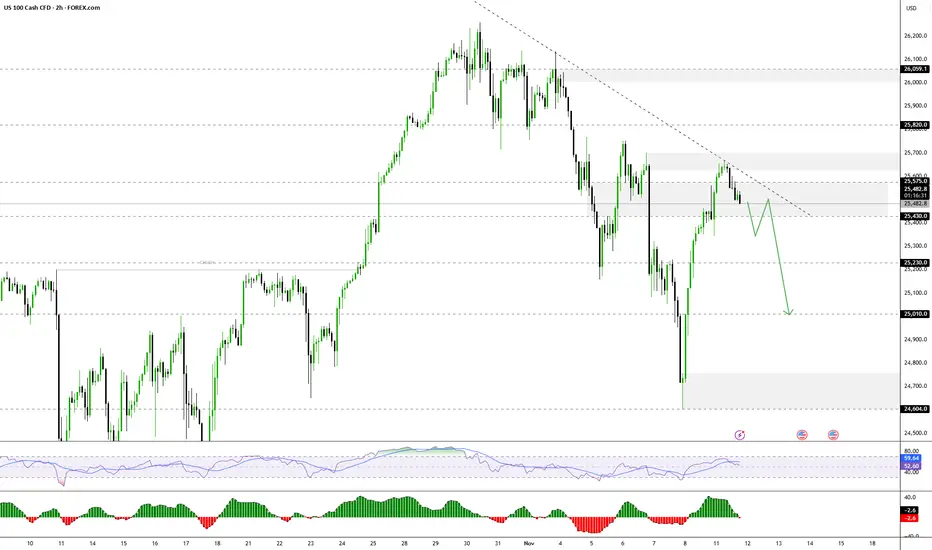
Nasdaq Potential for Further CorrectionThe NASDAQ index currently appears to be in a short-term correction, with the price likely to retest 25430 from 25570 before further movement.
- Above 25430–25575: Bullish continuation towards 25700 → 25820 → 25960.
- Below 25430: Bearish momentum is likely towards 25230 → 25010.
NAS100 1500 pips secured!Set up played out perfectly, breaking structure to during London session, sweep BSL, followed by internal IFVG to target 1500 pips
