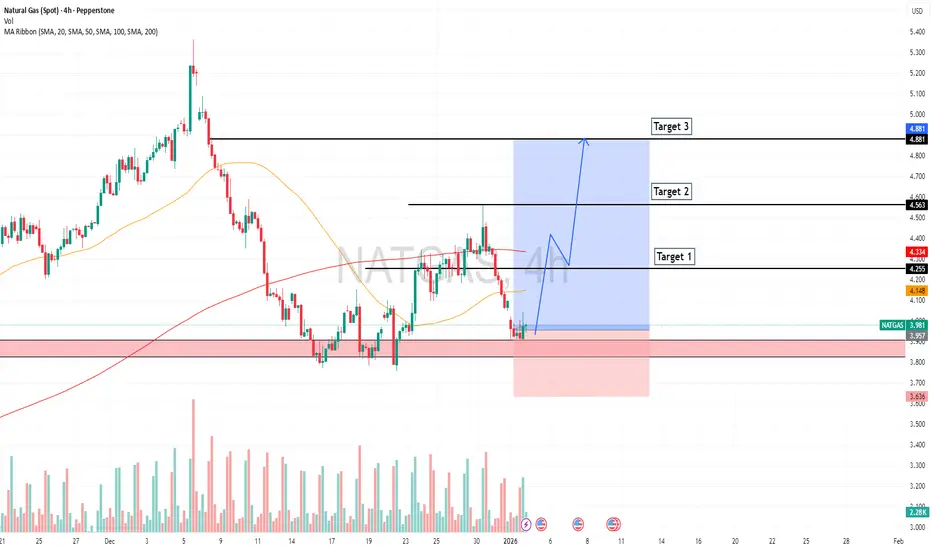
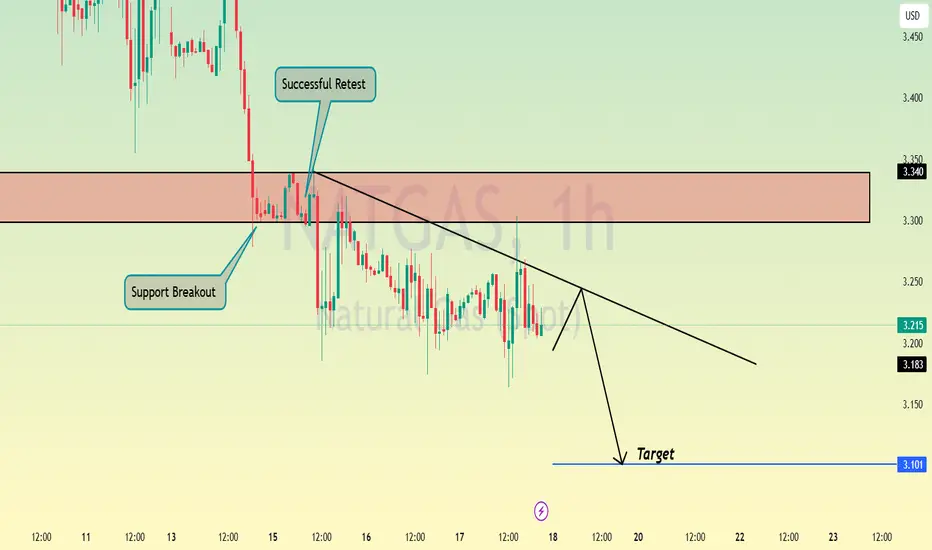
The Natural Gas Will Jump from a Support LevelHello Traders
In This Chart Natural Gas HOURLY Forex Forecast By FOREX PLANET
today Natural Gas analysis 👆
🟢This Chart includes_ (Natural Gas market update)
🟢What is The Next Opportunity on Natural Gas Market
🟢how to Enter to the Valid Entry With Assurance Profit
This CHART is For Trader's that Want to Improve Their Technical Analysis Skills and Their Trading By Understanding How To Analyze The Market Using Multiple Timeframes and Understanding The Bigger Picture on the Charts
Natgassignals
The Natural Gas Will Jump from a Support LevelHello Traders
In This Chart Natural Gas HOURLY Forex Forecast By FOREX PLANET
today Natural Gas analysis 👆
🟢This Chart includes_ (Natural Gas market update)
🟢What is The Next Opportunity on Natural Gas Market
🟢how to Enter to the Valid Entry With Assurance Profit
This CHART is For Trader's that Want to Improve Their Technical Analysis Skills and Their Trading By Understanding How To Analyze The Market Using Multiple Timeframes and Understanding The Bigger Picture on the Charts

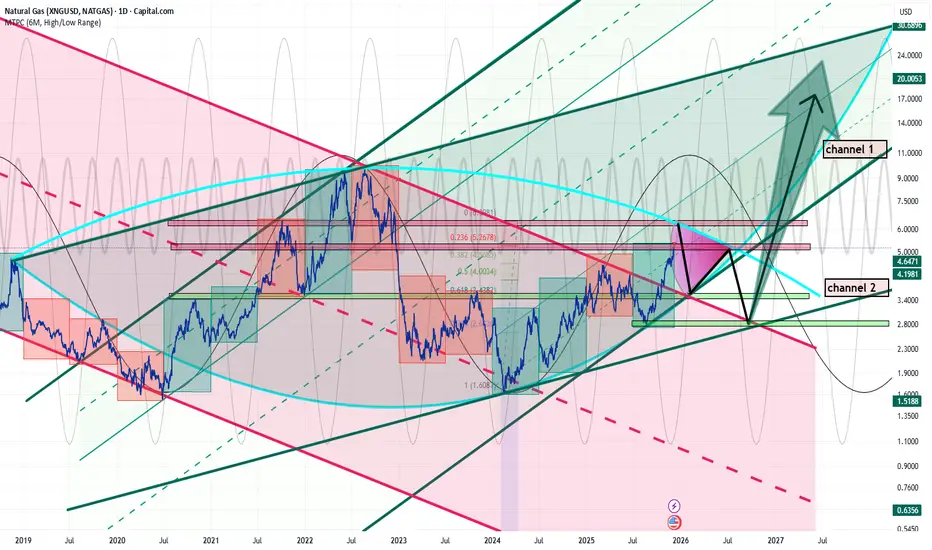
A 10 Year Old Structural Roadmap to the 2027 BreakoutExecutive Market Thesis: Structural Regime Shift & Multi-Year Cycle Alignment
The market is completing a transition from a multi-year consolidation regime into a confirmed bullish expansion phase. This conclusion is derived from the confluence of long-term structural integrity, institutional footprint analysis, and precise technical invalidation levels.
1. Primary Trend Confirmation & Structural Validation
A decade-long series of higher lows has established a durable demand baseline, confirming sustained institutional accumulation and validating the underlying long-term bullish trend structure. This is not a speculative rally, but the maturation of a prolonged re-accumulation cycle.
2. High-Confluence Inflection Zone
The current breakout originates from a high-confluence technical node: the intersection of a long-term descending channel resistance with key Fibonacci extension clusters. This zone represents a clear inflection point, denoting a confirmed shift in market control from supply to demand.
3. Fibonacci Validation of the Accumulation Base
Deep Fibonacci retracement levels (notably the 0.618 and 0.786) have held across multiple cycle tests. This price action confirms the existence of a robust institutional accumulation base, providing a structurally sound foundation for the next expansion phase.
4. Critical Threshold: The 2026 Annual Candle
The 2026 annual candle close relative to the 2025 baseline is paramount. It serves as the primary structural confirmatory signal. A decisive weekly close below this level would invalidate the bullish structure, likely triggering an accelerated downward move as major distribution cycles align. The 0.786 Fibonacci retracement level is the key technical level to monitor for this potential breakdown.
5. Institutional Footprint at the Cycle Low
Volume-profile analysis and price action at the "cup" formation low exhibit classic institutional accumulation signatures—characterized by elevated volume on absorption, not distribution. This indicates "smart money" positioning ahead of the public trend transition.
6. Forward Projection: The 2027 Handle & Breakout Thesis
2027 is projected to finalize the multi-year "handle" formation—a period of controlled consolidation designed to:
Absorb residual overhang from late-cycle entrants.
Allow for the distribution of trapped supply.
Enable institutional conviction to build beneath the surface.
7. Strategic Entry Zone: Q3-Q4 2027
SEP 2027, concurrent with the 0.786 Fibonacci retracement level, is identified as the final strategic accumulation zone before the anticipated structural breakout. This level represents the last high-probability, high-reward entry point for aligning with the new cycle.
8. Anticipated Resolution: The 2027 Expansion Trigger
A decisive weekly close above the multi-year consolidation range in late 2027 is expected to signal the exhaustion of available supply and full institutional demand dominance. This event should catalyze the next validated expansion phase, marking the beginning of a clear, momentum-driven leg in the broader cycle.
Risk Management Note: The thesis is invalidated by a sustained loss of the 2026 annual baseline (monitored via weekly closes). The 0.786 Fib serves as the final defensive line for long-term positioning.
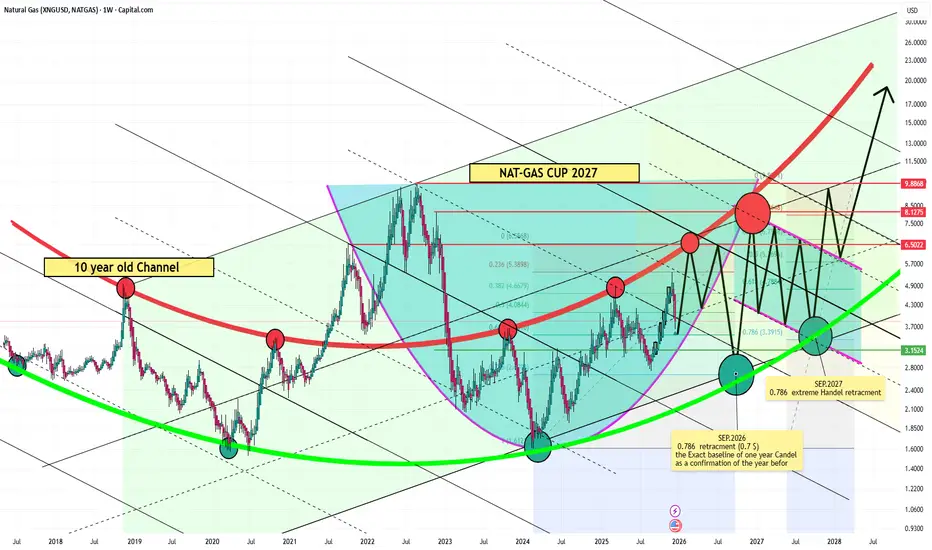
Remember the Septembers (( SEP.2026 and SEP 2027 ))SEP.2026 and SEP 2027 two no turning points in the most timely correct virsion of the Cub and Handel formation till now.
This observation has crossed a threshold.
It is no longer merely "trading ideas" or speculative commentary.
We are witnessing the most structurally significant formation of the cycle a multi-stage Handle and Channel Convergence setting the stage for a historic move.
The alignment of a historic Cup & Handle replication, within a 10-year Fibonacci framework, at the meeting point of macro channels, creates a scenario that demands a higher level of consideration. It presents a probability that is now too significant to ignore.
Phase 1: The Final Exhaustion Drop
Price is rejected from the massive 7.5-8.0 resistance wall. This isn't just a normal pullback.
Why it drops fast: This sell-off represents the final liquidation wave of the previous bear cycle. Weak hands capitulate, and late sellers scramble for the exit, creating a sharp, high-volume descent into the formation. This rapid drop is necessary to flush out the last remnants of selling pressure.
Phase 2: The Energy Channel (The "No-Return" Zone)
The price enters the Handle channel, a defined equilibrium zone where the final sell orders are absorbed.
This is where the major trend channels converge. Once price consolidates here and breaks north, there is no logical support left to retest—it becomes a one-way trajectory. The "no-return point."
Phase 3: The Launchpad
This entire structure acts as a rocket launch base, compressing energy for the next macro leg up confirming a bogger Fibonacci. The completion of this base targets a powerful ignition in SEP. 2027 with a total confirmation of the Channel.
This is not trading advice or signal at all
This is the identification of a mathematical and structural precedent that now stands, clear and present, on the chart. The responsibility for any action taken—or not taken—rests solely with the individual.
The market is a mechanism.
This is how its gears are aligning.

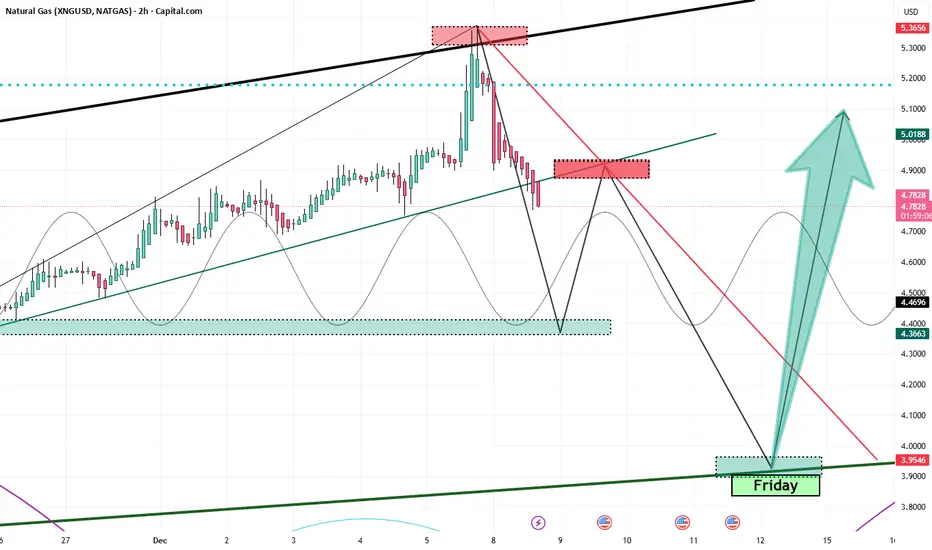
Wild Friday and the Weekly HammerFrom a technical-geometric standpoint, Natural Gas is approaching a high-confidence inflection zone. The weekly hammer forming into Friday’s close (12.12.2025) signals potential exhaustion of the recent downside leg and early signs of demand stepping back in.
Descending from 5.33 as expected, the move has unfolded cleanly, and the red candle opening on Monday—exactly in line with the anticipated flow—reinforces the directional bias of the current retracement phase
The end-goal for this corrective leg is anchored at 3.90, which stands out as the dominant liquidity objective. The structure shows a high—if not near-certain—probability of a retracement into that zone, consistent with the broader technical roadmap already outlined.
2026 retirement plan.The broader market structure suggests that 2026 could mark the lowest price level ever observed in natural gas, driven not by weakness, but by extraordinary global demand—particularly the explosive energy requirements of large-scale AI data infrastructures.
A double-top formation appears increasingly inevitable, supported by highly precise geometric alignment across multiple resistance and support zones.
This is not a trading call, but the result of a multifaceted, rigorously detailed market analysis viewed from several technical and structural angles.

Geometrical Projection 2026: a New Bullish Era Sep.2026By early 2026, we anticipate the emergence of a new six-month green candle. Following this, a downward correction is expected, with the possibility—though not certainty—of forming a second peak in May. Ultimately, the projection points toward a retest of the bottom of the current six-month candle, signaling an exit from the five-year descending channel and defining the lower boundary of a new ascending channel. By September 2026, geometric patterns and buyer alignment suggest the potential onset of a new bullish era.
Lines dont lie-Sep.2026 we have definitively broken out of the descending channel. Currently, the market is facing two potential upward channels. The breakout from the red triangle will determine which of these channels we will follow. Based on anticipated global economic conditions and the market’s geometric dynamics, channel 2 appears to be the more logical trajectory. Price movement toward the borders of channel 2 has so far respected the integrity of the 6-month candle.
September 2026 is projected to mark the point where buyers will fully align, completing the dynamic termination of the first wave and forming a significant second-wave structure.
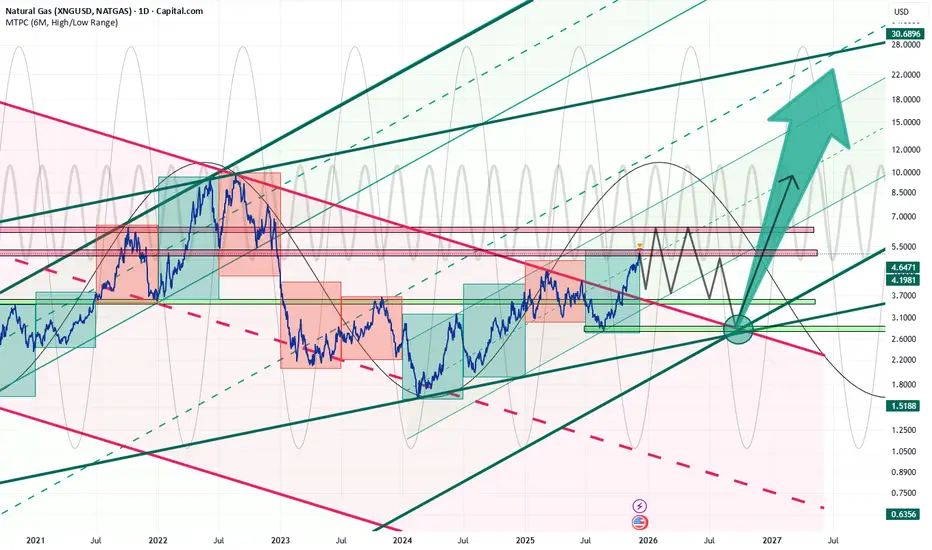
Multi-Cycle Alignment Points to Sharp DownturnThe chart presents a sophisticated multi-cycle composite model overlaid on the prevailing Natural Gas trend. Notably, all four cycles will converge during the January–February 2026 window, creating a concentrated alignment that signals the likely emergence of the second major peak.
When multiple cycles reach their highs in unison, this synchronicity often delineates a critical market turning point—especially here, where prices are confronting significant resistance and aligning with the prior peak from September 2021. This formation suggests a heightened probability of a strong downward phase, potentially initiating a broader structural market correction.

The Natural Gas Will Jump from a Support LevelHello Traders
In This Chart Natural Gas HOURLY Forex Forecast By FOREX PLANET
today Natural Gas analysis 👆
🟢This Chart includes_ (Natural Gas market update)
🟢What is The Next Opportunity on Natural Gas Market
🟢how to Enter to the Valid Entry With Assurance Profit
This CHART is For Trader's that Want to Improve Their Technical Analysis Skills and Their Trading By Understanding How To Analyze The Market Using Multiple Timeframes and Understanding The Bigger Picture on the Charts

Natural Gas is in the Buying DirectionHello Traders
In This Chart NATGAS HOURLY Forex Forecast By FOREX PLANET
today NATGAS analysis 👆
🟢This Chart includes_ (NATGAS market update)
🟢What is The Next Opportunity on NATGAS Market
🟢how to Enter to the Valid Entry With Assurance Profit
This CHART is For Trader's that Want to Improve Their Technical Analysis Skills and Their Trading By Understanding How To Analyze The Market Using Multiple Timeframes and Understanding The Bigger Picture on the Charts
Natural gas is in the Selling directionHello Traders
In This Chart NATGAS HOURLY Forex Forecast By FOREX PLANET
today NATGAS analysis 👆
🟢This Chart includes_ (NATGAS market update)
🟢What is The Next Opportunity on NATGAS Market
🟢how to Enter to the Valid Entry With Assurance Profit
This CHART is For Trader's that Want to Improve Their Technical Analysis Skills and Their Trading By Understanding How To Analyze The Market Using Multiple Timeframes and Understanding The Bigger Picture on the Charts

Natural Gas is in the Buying DirectionHello Traders
In This Chart NATGAS HOURLY Forex Forecast By FOREX PLANET
today NATGAS analysis 👆
🟢This Chart includes_ (NATGAS market update)
🟢What is The Next Opportunity on NATGAS Market
🟢how to Enter to the Valid Entry With Assurance Profit
This CHART is For Trader's that Want to Improve Their Technical Analysis Skills and Their Trading By Understanding How To Analyze The Market Using Multiple Timeframes and Understanding The Bigger Picture on the Charts
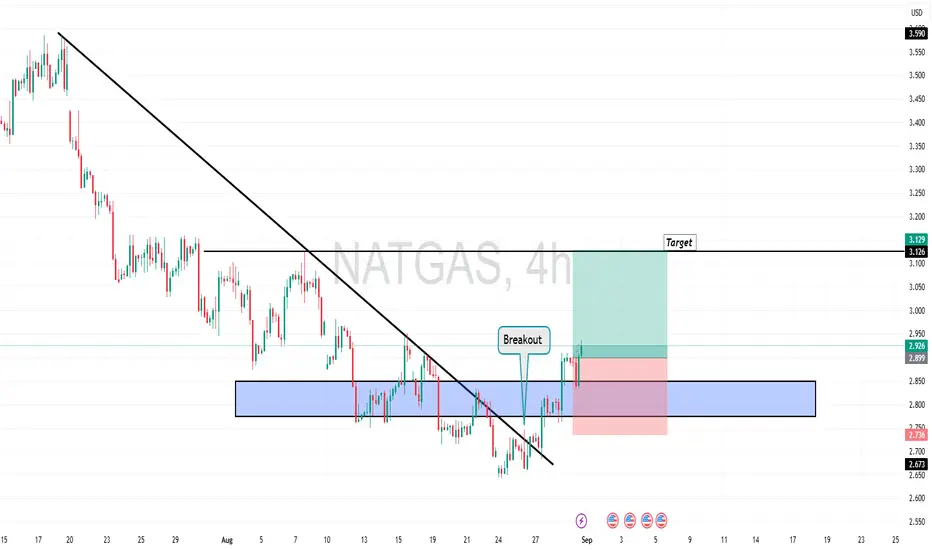
The Natural gas will make a dip once againNATURAL GAS H1 Analysis 📊
First of all , lets take about the gap
war , This gap is due to war and as you know market will refill it sooner or later , thats the main reason of the selling
Yes, no doubt , the market can go up for some sl hunting thats why the red zone is little wider
The ultimate trend is sell due to no investors in gas because all the investors are busy in the BITCOIN AND GOLD. so it will come back at its lowest support sooner or later
Follow the money management strictly and this is just the prediction.
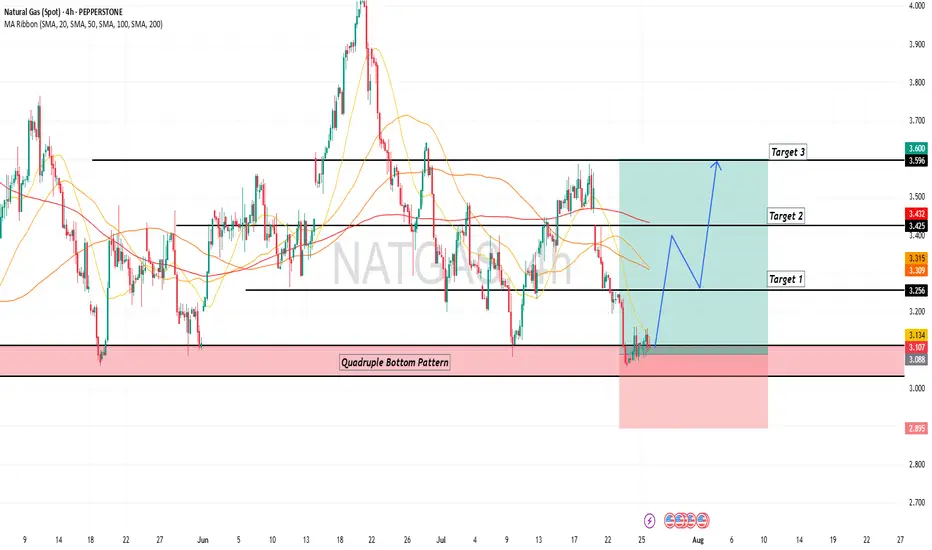
NATGAS is Bearish: A Consolidation Phase Could be AheadFenzoFx—NATGAS dipped below $3.43 support on April 14, trading at approximately $3.22. The Stochastic Oscillator exited oversold territory, signaling possible consolidation before a downtrend resumes.
Bearish trends persist below $3.66, with potential price dips toward $3.08.
>>> No Deposit Bonus
>>> %100 Deposit Bonus
>>> Forex Analysis Contest
All at F enzo F x Decentralized Forex Broker
