NAS100 Analysis Hi Guys,
Let's have a quick look at what has been happening on the weekly. As we are very excited to see a bullish rally we must not miss a key area. On the weekly we have approached a strong key resistance level where price has come previously and could go further. For our bulls to have a continuation we will have to see what happens at this level 13141.
As for todays outlook, the price may reject 13141, come down to retest the trend before going back to 13141 and continueing to the next resistance area 13500- 13577. However if the price breaks to the downside then we may see price come back retest the trend and continue to 12771.
Trade safe, Nasdaq is one of the hardest things to trade and it is not for the light hearted. Nasdaq you can make serious money but do not trade if you dont know how to trade nasdaq.
50% off this week on the NASDAQ Course. Limited time. Get in touch now
NASDAQ 100 CFD

NASDAQ 100 Analysis Nasdaq broke the falling structure last week towards the upsides, we saw the price come back down to retest the previous structure and then went back up. We have come to a very strong resistance area 13079, which really needs a break for the market to continue. For the bulls a break of 13079, nasdaq will continue to 13320-13885.
However if market does fail to continue going up we can see price come back to the strong support area of 12767. A break of this level will get the bears back and we can see price coming down to 12500-12241
50% off this week on the NASDAQ Course. Limited time. Get in touch now.


NAS100USD 2021 Mar 15 Week
NAS100USD 2021 Mar 15 Week
Last week, buy opportunity materialized per analysis.
Immediate support 12668
Immediate resistance 13121
Let's see if price can continue in the channel since daily chart
volume is telling us price ascended on lower volume.
Like and follow if you find this useful : )
Have a safe and profitable trading week!

The sharp rise in yields may not end the the tech rallyYes after the pump in yields in the last days, the NASDAQ:QQQ
to NASDAQ:TLT spread did a nice correction.
This correction however, by no means ends the bullish move, nor does it even introduce a bear market.
Actually the chart now looks even more bullish and I might have sold a lot of positions too early on Friday.... :/

Nasdaq - When will it stop dropping?This video is explaining our Nasdaq chart. Hope you enjoy it
ps. also watch this video to see why it affects cryptos.

Nasdaq 100 (Bullish 5.0)The bullish 5.0 typically only applies to a bearish shark harmonic pattern. Although, could still see a rally off of the 0.50 fib retrace.


NDX Nasdaq 100 Head And Shoulders This is a great example of how a Head and Shoulders pattern looks like!
$12.100 is the first target!
If you are interested to test some amazing BUY and SELL INDICATORS which give the signal at the beginning of the candle, not at the end of it, just leave me a message.

NASDAQ - Might find support nowNasdaq dropped as expected (after last week's dead cat bounce). Will it find support now or later at 11,600?
ps. Nasdaq and indices dropping also affects the cryptocurrencies negatively

NDX & SPX (1D) SPX BULLISH, NDX BEARISHNasdaq100 continues its fall down for support, -2,70% on the day, -7,70% from its ATH.


NASDAQ- Looks Bearish to meMy updated chart on Nasdaq shows that we could be in for a drop...again
Just be careful people.
BR
the FXPROFESSOR

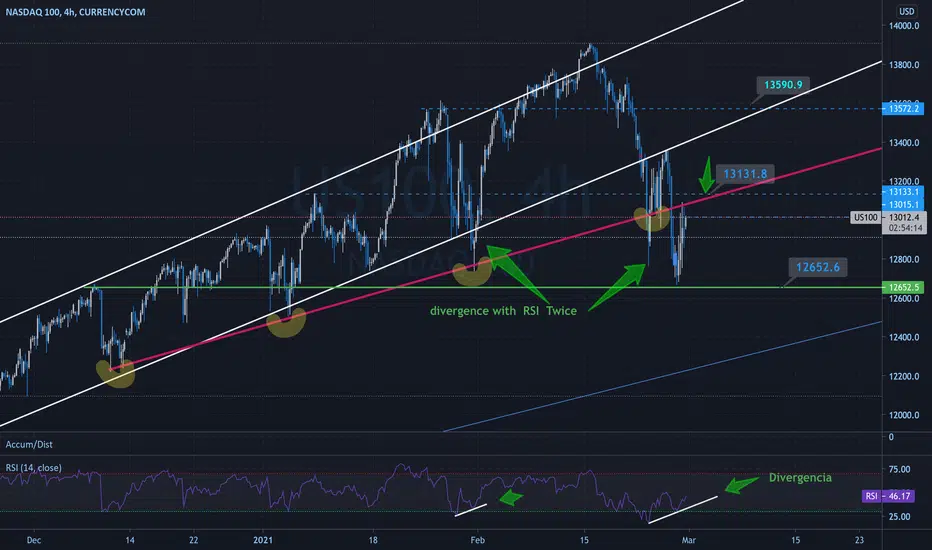
$NDX #nasdaq100 same Divergence with RSI from January 4h hours Chart is showing a divergence with the Relative Strength Index...
what do u think? bull or bear? TVC:NDX