SPX & NDX : Stay heavy on positionsSPX & NDX : Stay heavy on positions (2x leverage)
Same view as before. No change
** This analysis is based solely on the quantification of crowd psychology.
It does not incorporate price action, trading volume, or macroeconomic indicators.
Ndxlong
SPX & NDX , Stay heavy on positionsSPX & NDX , Stay heavy on positions (2x leverage)
Currently in a short-term bounce signal zone. Maintaining the same outlook as before.
** This analysis is based solely on the quantification of crowd psychology.
It does not incorporate price action, trading volume, or macroeconomic indicators.
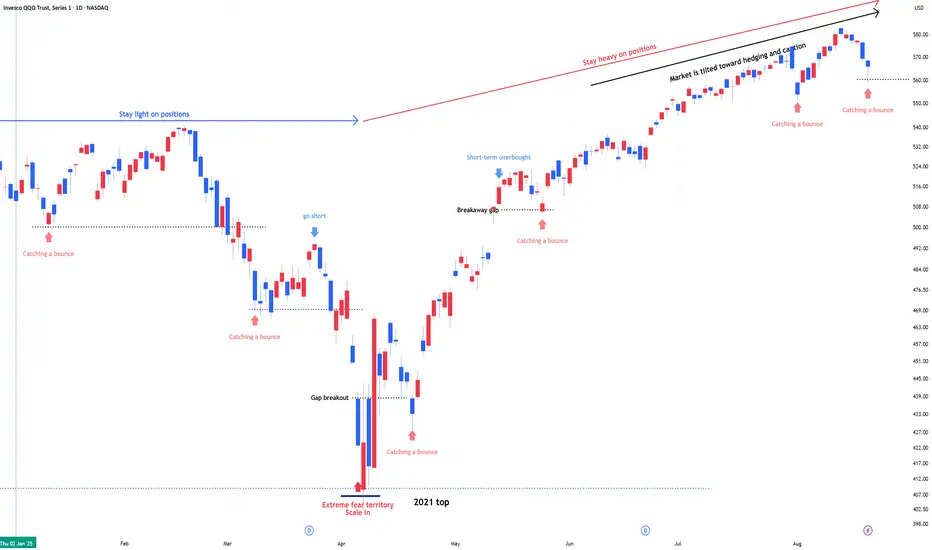
QQQ , Stay heavy on positions. QLD or TQQQ , Stay heavy on positions.
Same view as before. No change.
A signal for catching a bounce has emerged.
The bounce signal reflects a swing-to-intraday view and is not tied to the broader trend.
In stay light on positions zones, I hold QQQ and reduce exposure.
In stay heavy on positions zones, I increase allocation using a mix of QLD and TQQQ.
** This analysis is based solely on the quantification of crowd psychology.
It does not incorporate price action, trading volume, or macroeconomic indicators.
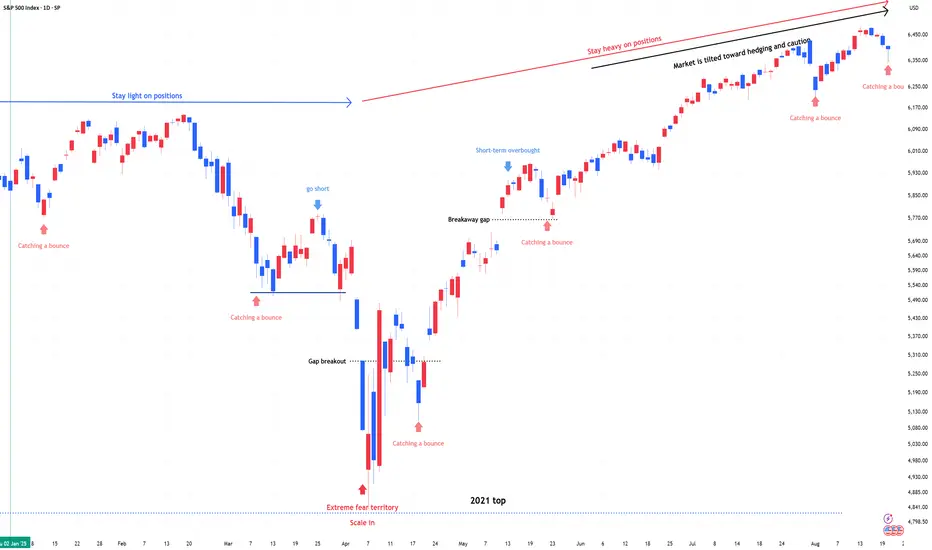
SPX & NDX , Stay heavy on positions.SPX & NDX , Stay heavy on positions. (2x leverage)
Same view as before. No change.
A signal for catching a bounce has emerged.
The bounce signal reflects a swing-to-intraday view and is not tied to the broader trend.
** This analysis is based solely on the quantification of crowd psychology.
It does not incorporate price action, trading volume, or macroeconomic indicators.
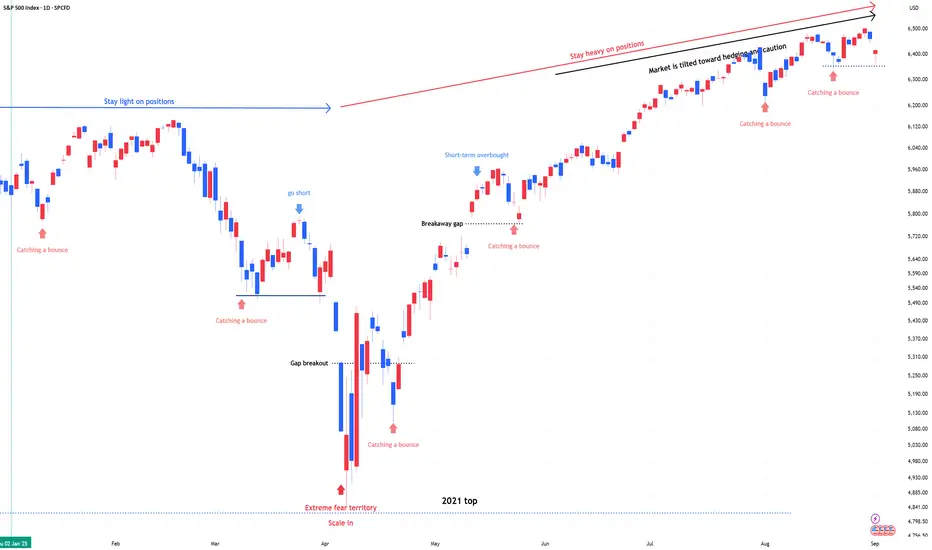
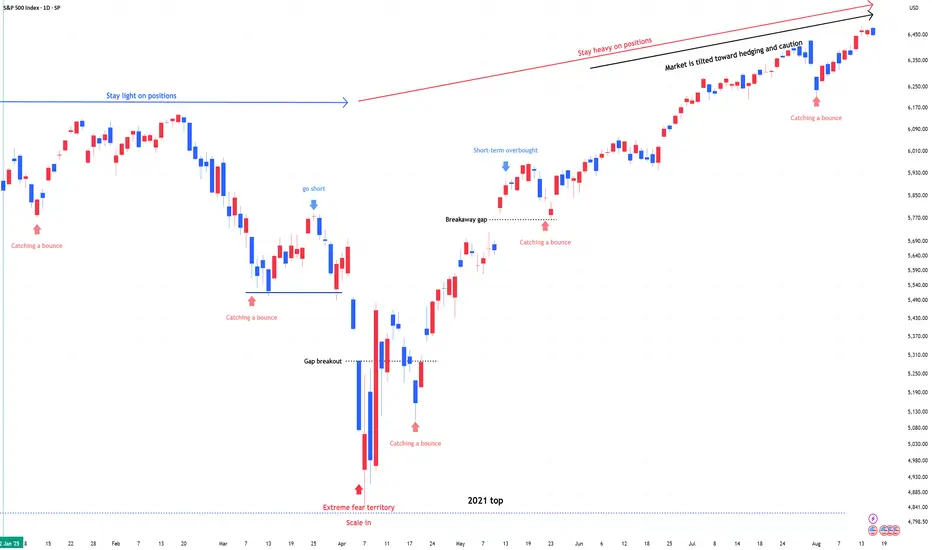
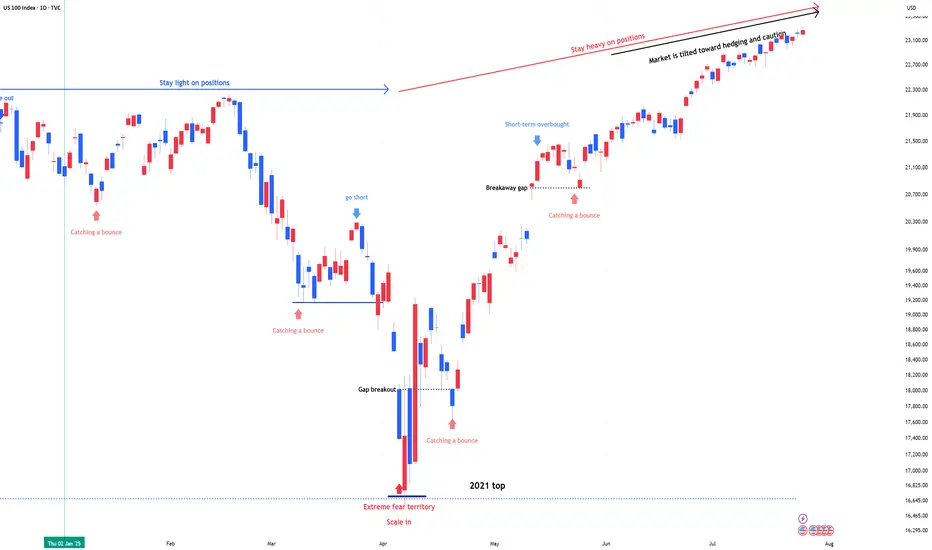
SPX & NDX , Stay heavy on positions.SPX & NDX , Stay heavy on positions. (2x leverage)
Same view as before. No change.
While the market continues to break all-time highs, market participants remain cautious.
Some are even anticipating a pullback in September, and overall, expectations for a correction are widely present.
** This analysis is based solely on the quantification of crowd psychology.
It does not incorporate price action, trading volume, or macroeconomic indicators.
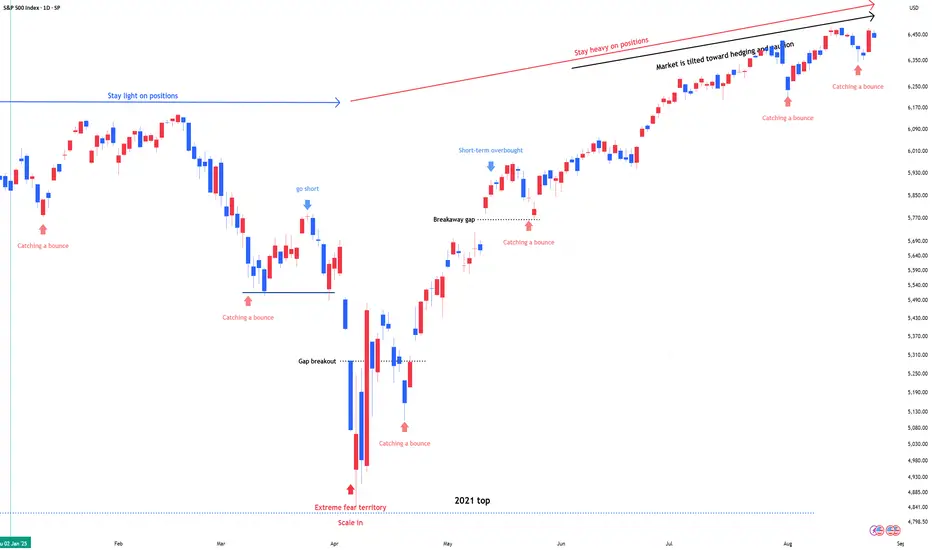
NDX & SPX , Stay heavy on positionsNDX & SPX , Stay heavy on positions. (QLD, TQQQ)
While the market continues to break all-time highs, market participants remain cautious.
Some are even anticipating a pullback in September, and overall, expectations for a correction are widely present.
Interestingly, market participants often have a good instinct for major turning points.
The issue, however, is timing—they tend to act too early.
** This analysis is based solely on the quantification of crowd psychology.
It does not incorporate price action, trading volume, or macroeconomic indicators.
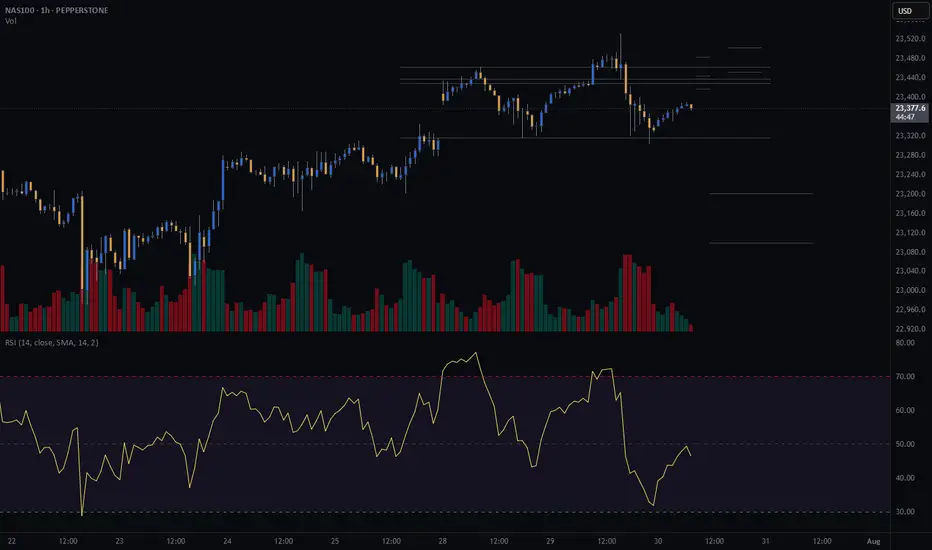
NASDAQ (CASH100) is Approaching KEY ResistanceSince 15 May, the Cash100 has been trading within an upward channel.
It’s now approaching diagonal resistance — will it hold, or break higher?
On the chart, I have marked every time NAS has tested the diagonal resistance and failed to break through.
I’ll be watching this area closely for shorts.
What do you think: will NAS continue climbing, or is a reversal coming?

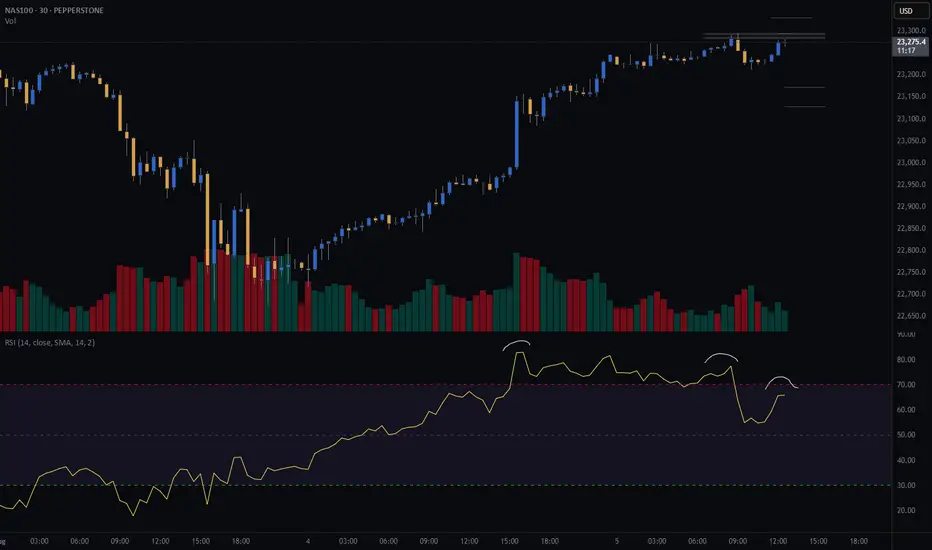
NAS100 (CASH100) Short - Double top 30minThe 15min head and shoulders setup got invalidated.
However, my double top variables are currently being met.
Still need confirmation before entering trade.
Risk/reward = 2.7
Entry price = 23 284
Stop loss price = 23 331
Take profit level 1 (50%) = 23 173
Take profit level 2 (50%) = 23 129
What does everyone thing the NASDAQ is going to do today?
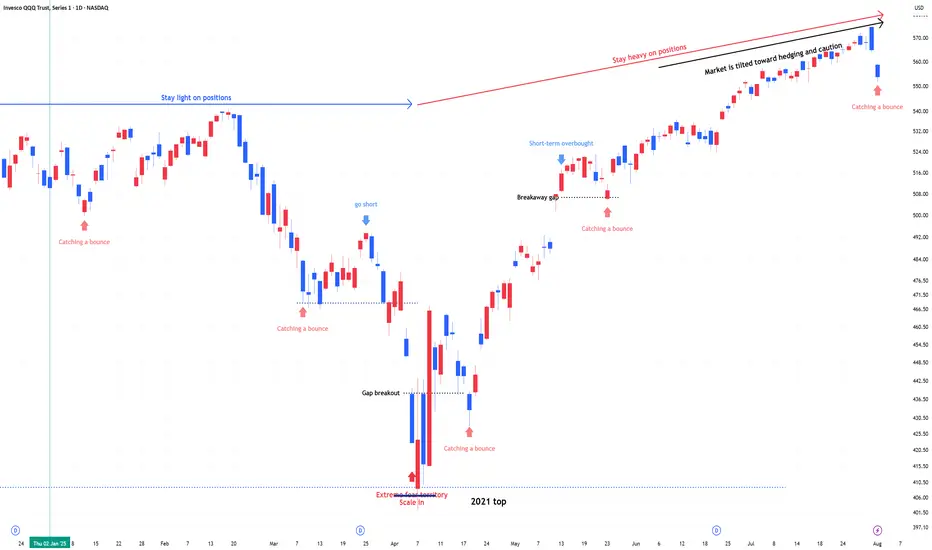
QQQ (+ QLD, TQQQ) , Stay heavy on positionsQQQ (+ QLD, TQQQ) , Stay heavy on positions
Despite downside volatility, the trend remains intact. I’m maintaining the same view as before—this is still a zone to stay heavy.
NDX & SPX , Stay heavy on positionsNDX & SPX , Stay heavy on positions (QLD, TQQQ)
Despite downside volatility, the trend remains intact. I’m maintaining the same view as before—this is still a zone to stay heavy.
CASH100 (NASDAQ) CRASH - Head and shoulders Risk/reward = 3.7
Entry price = 23 430
Stop loss price = 23 503.2
Take profit level 1 (50%) = 23 202
Take profit level 2 (50%) = 23 099
Still waiting for some variables to confirm before entering the trade
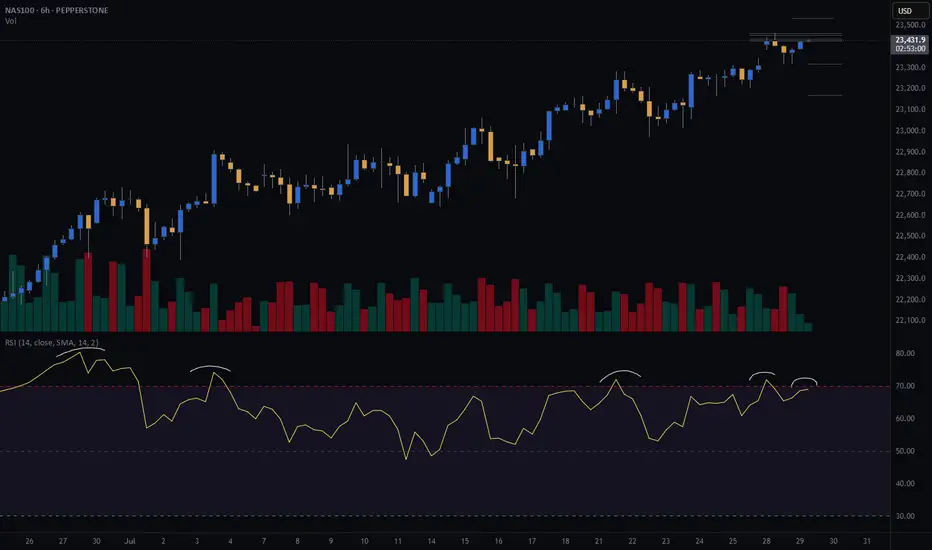
NASDAQ (CASH100) SHORT - Double top H6Risk/reward = 4
Entry price = 23 463.1
Stop loss price = 23 534.2
Take profit level 1 (50%) = 23 169
Take profit level 2 (50%) = 23 169
All variables met. Now just need price to reach entry level and close back within range.
NDX & SPX , Stay heavy on positionsNDX & SPX , Stay heavy on positions (QLD, TQQQ)
Market sentiment is currently tilted toward betting on downside volatility, which ironically supports the case for the stock market to continue its upward trend.
QQQ : Stay Heavy on Positions QQQ, QLD, TQQQ : Stay Heavy on Positions
Amid record-high markets, fear-hedging sentiment is slowly transitioning into renewed risk-taking.
When entering an underweight zone, I rotate out of QLD or TQQQ into QQQ and reduce overall exposure.
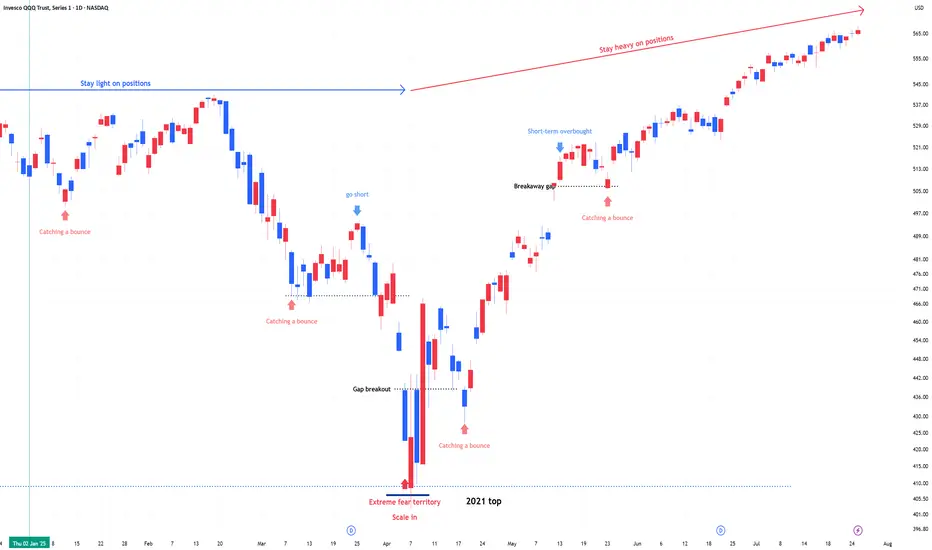
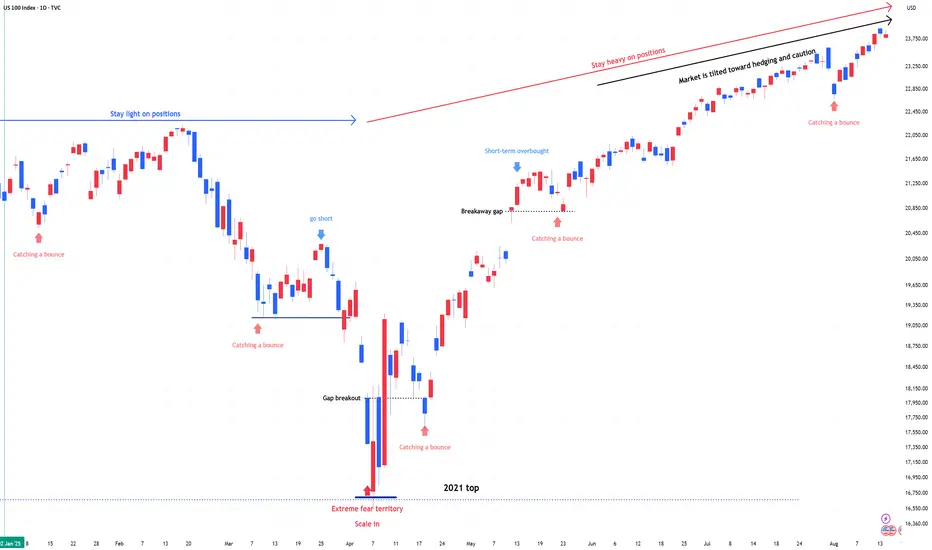
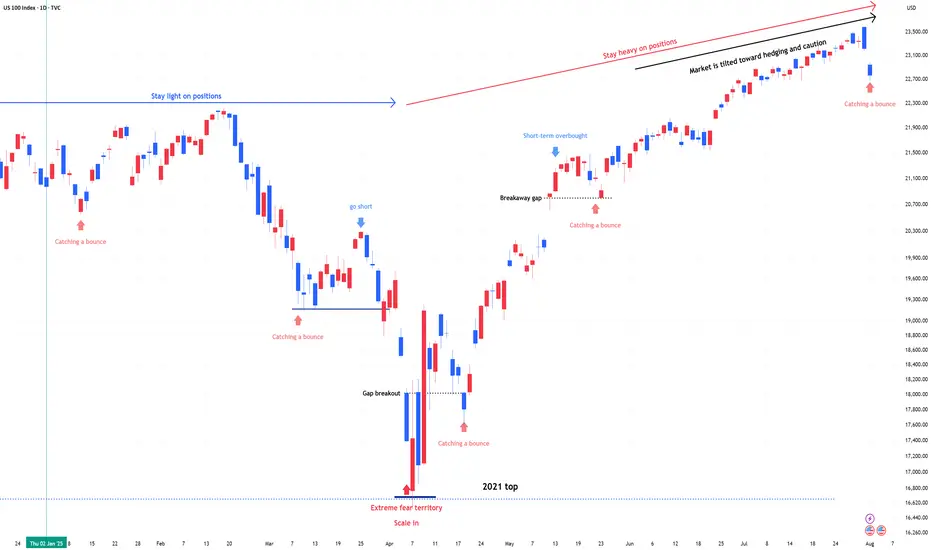
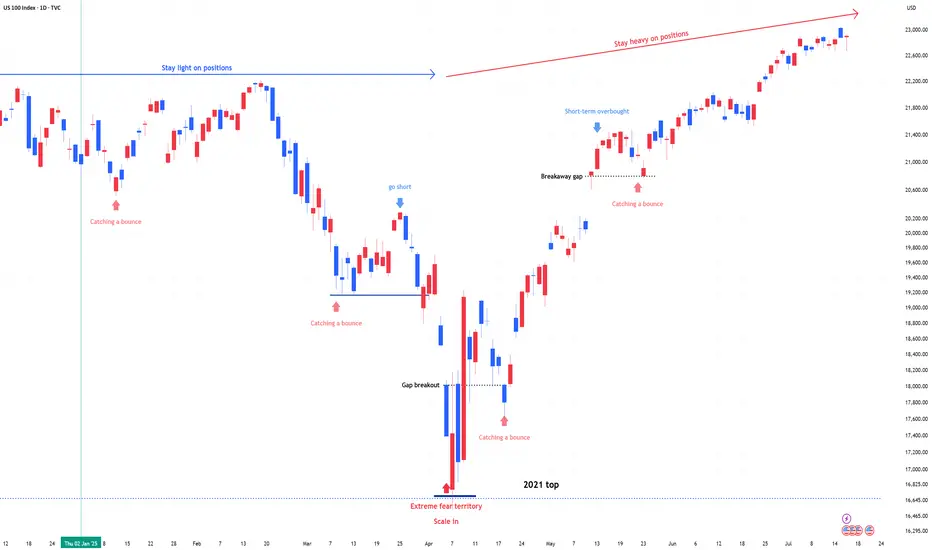
US 100 (NDQ) : Stay Heavy on Positions1) April Fear & Buy Signals
In early April, the Nasdaq 100 experienced a sharp sell-off, triggering extreme fear sentiment across the market.
At that point, scale-in buy signals appeared—classic "buy the fear" conditions.
2) Current Market State: No More Fear, but Watching
Since then, the market has stabilized.
The fear has disappeared, but we are still in a wait-and-see mode as traders assess the next move.
Momentum is holding, but participation remains cautious.
3) Stay Heavy on Positions
Despite short-term uncertainty, I’m maintaining an overweight position on the Nasdaq 100.
As long as we don’t see a major breakdown, the bias remains bullish.
NASDAQ Analysis scenarios ideaWe can see 2 Gaps in the Nasdaq, with USA Elections ahead i expect volatility.
I think we will close the 19800 gap first, then 19600 for then going up.
It depends a lot in the USA elections results
Always do your research

Nasdaq GAP We can see a Nasdaq GAP could we see it close in the next hours? USA elections starting soon, let's see how market react
Always do your research

NASDAQ ~ US100 NASDAQ100 Prediction: Potential Return to Buy Area
Based on recent market analysis, the NASDAQ100 appears to be forming a pattern of lower lows and lower highs. Considering various technical factors, it seems likely that the index will make another attempt to reach the buy area. Over the past few weeks, there have been gaps that remain unfilled and liquidity that needs to be collected. This confluence of signals suggests a potential move upwards in the near term. Traders should watch for key support levels and be prepared for potential bullish opportunities as the market seeks to correct and fill these gaps.
Take profit 1 - 19450-19500 Area
Take profit 2 - 19650-19700 Area

NDX / NAS100 long idea 17780 point is the point to be protected and the stop point. I still think bullish, target point 18400. long position can be taken with bullish confirmations or long can be taken from the region above 17300.


Nasdaq 100 Index 15MLike and comment if you find value in our analysis.
Feel free to post your ideas and questions at the comments section.
Good luck

QQQ Nasdaq 100 ETF Price Prediction for 2024This was my price prediction for QQQ in 2023. I was bullish, but not enough:
Considerations about 2024:
In the July 2023 meeting, the FOMC chose to raise interest rates to a range of 5.25%–5.50%, marking the 11th rate hike in the current cycle aimed at mitigating heightened inflation. The prevailing consensus among market experts hints at a potential shift in strategy, suggesting that the Fed might commence rate cuts later in 2024 as inflation gradually aligns with the Fed's 2% target. Statistically, historical data indicates that approximately 11 months after the cessation of interest rate increases, a recession tends to manifest. This pattern places us around June 2024, aligning with my prediction of a dip in the QQQ to approximately $370.
Given that 2024 is an election year, there's an additional layer of complexity in predicting market behavior. Despite the anticipated mid-year dip, my inclination is that the QQQ will conclude the year on a bullish note. This optimistic outlook hints at the onset of a 3-5 year AI bubble cycle, with the QQQ boasting a year-end price target of $460.
The integration of artificial intelligence into various sectors is expected to catalyze market growth and innovation, propelling the QQQ to new heights by the close of 2024.

NDX Broke Double Bullish Pattern, 16600 SoonDear Traders,
NDX broke the falling channel (long purple trendlines) and then repeated a breakout from the falling wedge (short purple trendlines).
I believe NDX can continue its rally because MACD turned bullish, and I can see a confirmed bullish cross on the RSI. The price is above EMAs, and the volume is high enough for the continuation. I believe the target could be around 16600.
NDX is also overbought. While I expect further upside, traders without an existing position from lower target prices could wait for a corrective retracement to enter.
Kind regards,
Ely
