HTF Supply in ControlCAPITALCOM:US100 As seen on the daily chart, price continued to respect the OG supply zone at 25,900 – 26,000, a level marked and shared earlier.
The rejection from this area remained valid and downside continuation followed as expected.
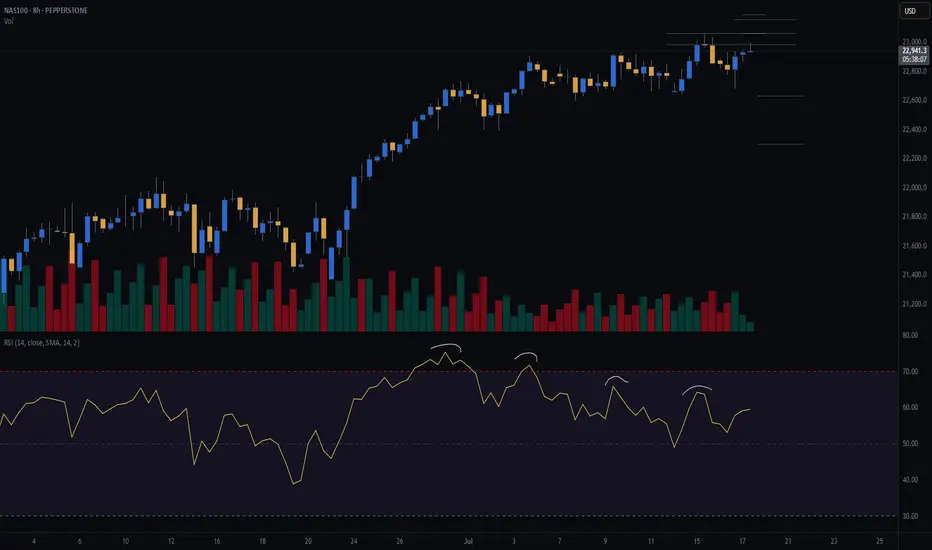
VANTAGE:NAS100 On the 1H chart, structure stayed bearish while price remained below key resistance levels.
There was no acceptance back above resistance, keeping sellers in control.
📉 Daily Bias
Bearish below 25,900 – 26,000 (OG Supply Zone).
As long as price trades below this zone, downside scenarios remain valid.
🎯 1H Expectations
• Any move toward 25,300 – 25,350 is considered corrective
• While below 25,300, selling pressure remains active
• Acceptance below 25,150 confirms continuation toward lower levels
📌 Key Levels (HTF & 1H)
• 25,900 – 26,000 → Daily OG Supply / Invalidation
• 25,300 – 25,350 → 1H resistance
• 25,150 → Intraday decision level
• 25,000 – 24,950 → Lower liquidity / demand area
⚡ Intraday Execution Note (15M & 5M)
Bias is taken from Daily and 1H. Execution is refined on 15M and confirmed on 5M.
🔴 SHORT execution (primary direction)
• Entry zone: 25,250 – 25,300 (sell confirmation on 5M)
• Targets: 25,150 then 25,050 – 25,000
• Invalidation: acceptance above 25,350
🟢 LONG execution (reaction-based scalp)
• Entry zone: 25,000 – 25,050 (hold + confirmation on 5M)
• Targets: 25,150 then 25,230 – 25,250
• Invalidation: acceptance below 24,950
These are execution scenarios only and remain aligned with the higher time frame bearish structure.
🛑 Invalidation
Only a daily acceptance above 25,900 – 26,000 invalidates the bearish bias.
Until then, structure favors shorts.
🧠 Execution Reminder
Higher time frame first.
Lower time frame execution second.
Not investment advice. Always manage your own risk.
Ndxshort

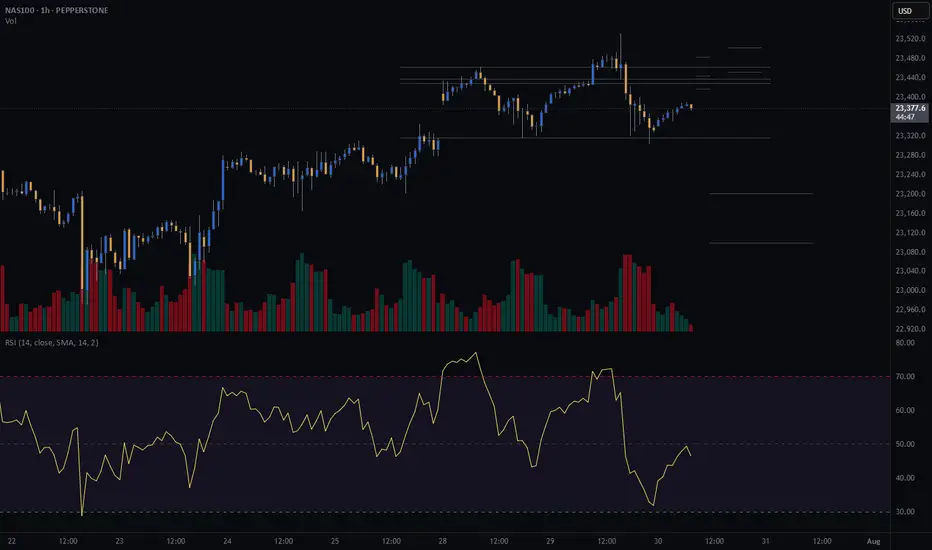
NASDAQ (CASH100) is Approaching KEY ResistanceSince 15 May, the Cash100 has been trading within an upward channel.
It’s now approaching diagonal resistance — will it hold, or break higher?
On the chart, I have marked every time NAS has tested the diagonal resistance and failed to break through.
I’ll be watching this area closely for shorts.
What do you think: will NAS continue climbing, or is a reversal coming?

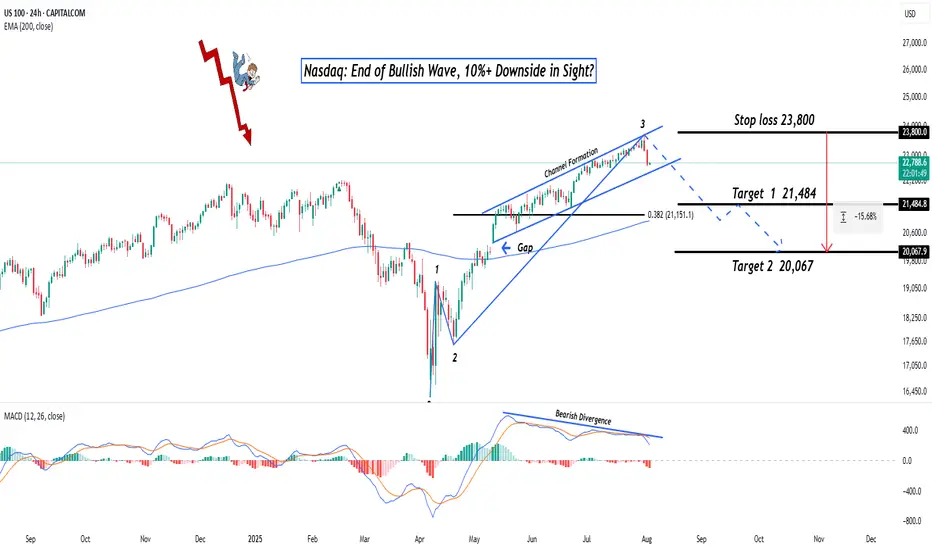
Nasdaq: End of Bullish Wave, 10%+ Downside in Sight?Hey Realistic Traders!
Has CAPITALCOM:US100 (Nasdaq) Finally Peaked? A Reversal Signal Just Flashed. Is This the Turning Point Toward a Deeper Pullback?
Let’s dive into the technicals to see what the chart is really telling us.
Technical Analysis
On the daily chart, the Nasdaq is starting to show signs of weakness. A bearish divergence has formed between the MACD and price movement , which is a classic signal that bullish momentum may be fading. This often indicates the potential for a trend reversal or a deeper correction.
A recent drop, confirmed by a strong bearish full-body candlestick, suggests that selling pressure is increasing. If this continues, we expect a breakdown from the current bullish channel.
In this scenario, the extended Wave 3 may have reached its peak. A correction could follow, with the first target at 21484, which lines up with the 0.382 Fibonacci retracement level. If the decline continues, the next downside target would be around 20067, where a previous gap may be filled.
This bearish outlook remains valid as long as the price stays below 23800 . A move above that level would invalidate the setup and return the outlook to neutral.
Support the channel by engaging with the content, using the rocket button, and sharing your opinions in the comments below.
Disclaimer: "Please note that this analysis is solely for educational purposes and should not be considered a recommendation to take a long or short position on Nasdaq.
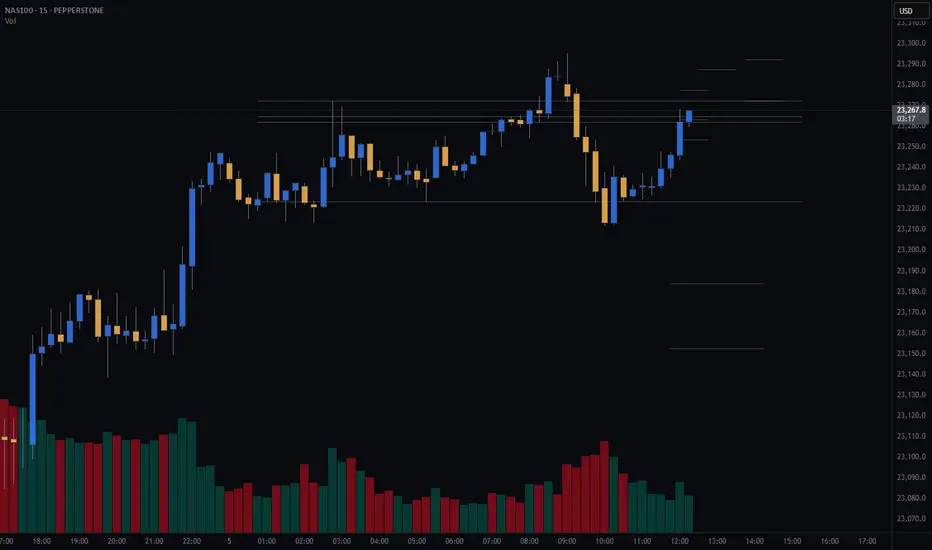
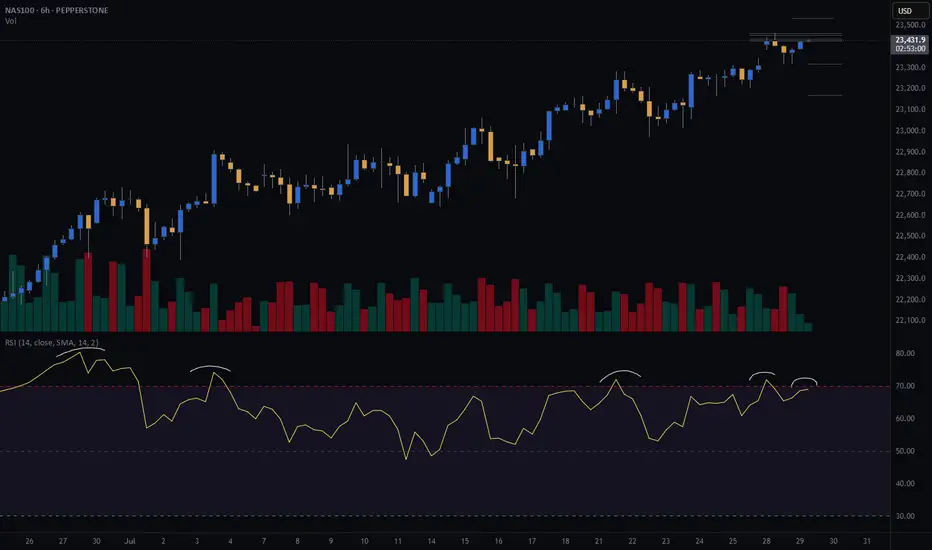
NAS100 (CASH100) Short - Double top 30minThe 15min head and shoulders setup got invalidated.
However, my double top variables are currently being met.
Still need confirmation before entering trade.
Risk/reward = 2.7
Entry price = 23 284
Stop loss price = 23 331
Take profit level 1 (50%) = 23 173
Take profit level 2 (50%) = 23 129
What does everyone thing the NASDAQ is going to do today?
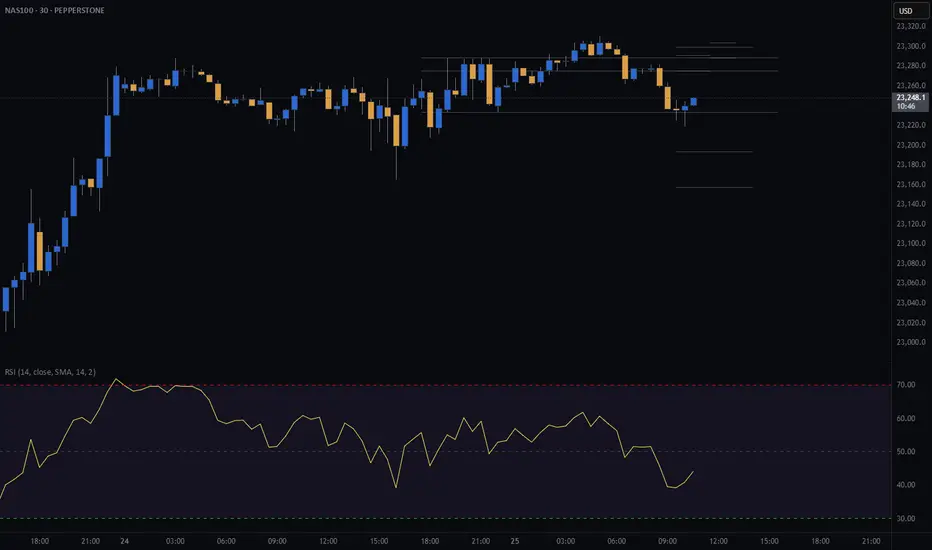
NASDAQ (CASH100) SHORT - head and shoulders 15minPotential short on nas100 (cash100) with head and shoulders on the 15min.
Still waiting for confirmation on some of my variables before I enter.
Risk/reward = 3.3
Entry price = 23 262
Stop loss price = 23 287.3
Take profit level 1 (50%) = 23 184
Take profit level 2 (50%) = 23 153
What do you guys and girls think the nasdaq is going to do?
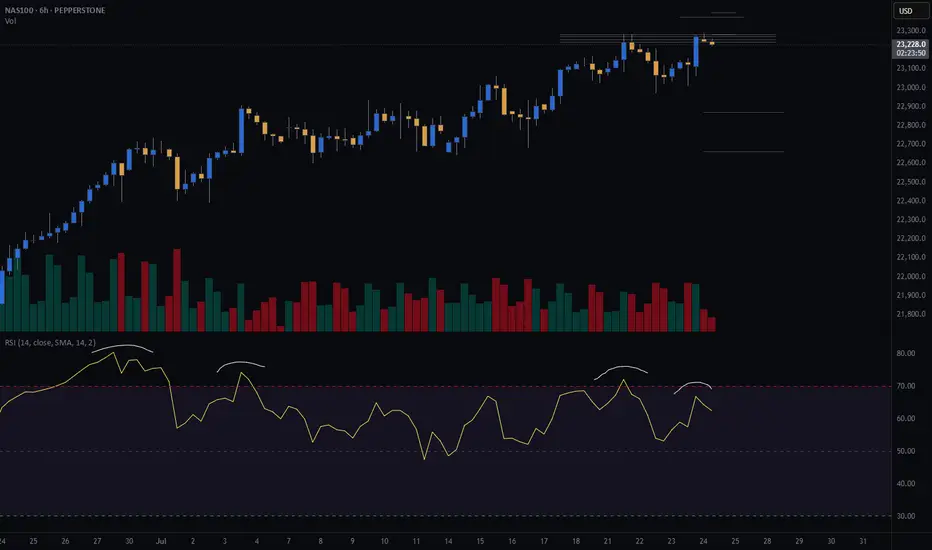
CASH100 (NASDAQ) CRASH - Head and shoulders Risk/reward = 3.7
Entry price = 23 430
Stop loss price = 23 503.2
Take profit level 1 (50%) = 23 202
Take profit level 2 (50%) = 23 099
Still waiting for some variables to confirm before entering the trade
NASDAQ (CASH100) SHORT - Double top H6Risk/reward = 4
Entry price = 23 463.1
Stop loss price = 23 534.2
Take profit level 1 (50%) = 23 169
Take profit level 2 (50%) = 23 169
All variables met. Now just need price to reach entry level and close back within range.
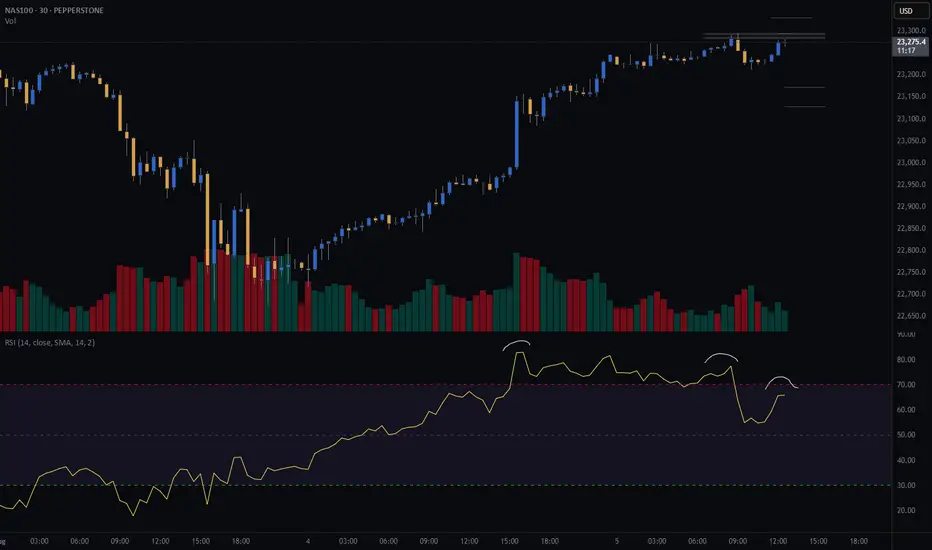
NDX (NASDAQ) CASH500 SHORT - Head and shoulders 30minRisk/reward = 3.2
Entry price = 23 275.7
Stop loss price = 23 303.9
Take profit level 1 (50%) = 23 193
Take profit level 2 (50%) = 23 157
Waiting on confirmation on a number of variables before entering the trade.
NASDAQ (CASH100) SHORT - double top H6Risk/reward = 4.3
Entry price = 23 282
Stop loss price = 23 398
Take profit level 1 (50%) = 22 871
Take profit level 2 (50%) = 22 663
If current H6 goes back into range, I will open short position.
All variables on checklist have been met.
I was out last night so I missed my initial entry. Hoping for a second chance.
Hopefully this short works because the last few higher time frame short setups have failed, although because of exit plan I have made very little losses.
NASDAQ (CASH100) SHORT - Head and shoulders H1Risk/reward = 3.8
Entry price = 23 167.9
Stop loss price = 23 232.8
Take profit level 1 (50%) = 22 943
Take profit level 2 (50%) = 22 878
Still waiting on confirmation on some variables in checklist

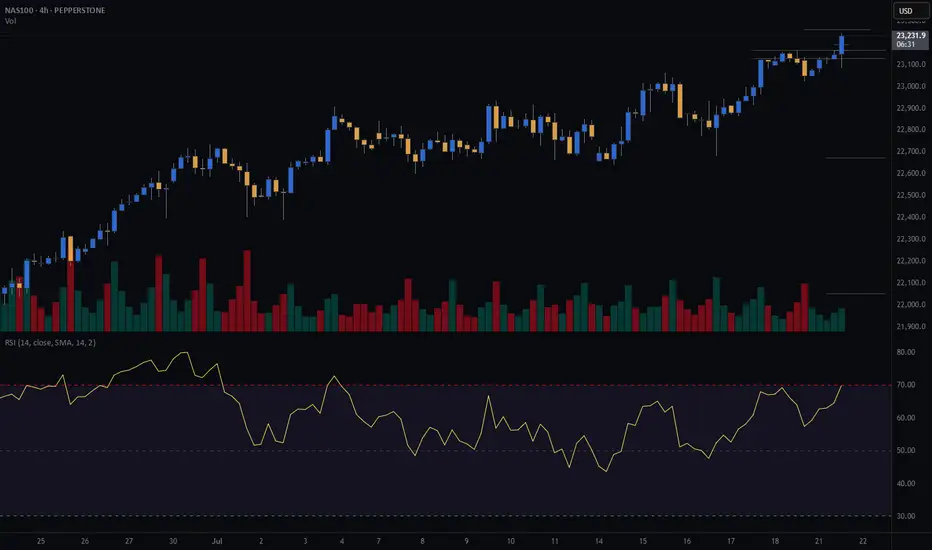
NASDAQ (CASH100) SHORT - Double TOP H4Risk/reward = 11.3
Entry price = 23 190
Stop loss price = 23 270.4
Take profit level 1 (50%) = 22 674
Take profit level 2 (50%) = 22 053
All variables met, and entered the trade.
What is everyone's thoughts on shorting or longing cash100?
NAS100 (CASH100) SHORT - head and shoulders 30minRisk/reward = 3.9
Entry price = 23 137.9
Stop loss price = 23 153.9
Take profit level 1 (50%) = 23 071
Take profit level 2 (50%) = 23 060
Still need to validate a few variables.
Lets goooooo

NAS100 (CASH100) SHORT - Double Top H8Risk/reward = 4.6
Entry price = 23 063
Stop loss price = 23 190
Take profit level 1 (50%) = 22 635
Take profit level 2 (50%) = 22 303
Still waiting for confirmation on some variables.
For example, need H8 candle to close in range and volume to validate, amongst other variables.
NDX its a short for like month?this is only an Idea !
due to many fvg's and gaps this is more likely to happen
you can see the long 30d / 40d target on chart

Short Position - NASDAQShort Position Entry: Consider initiating a short position if the Nasdaq-100 Index falls below 21,000.
Stop Loss (SL): Set a stop loss at 21,555 to manage potential losses.'
Market Sentiment: The combination of the Federal Reserve's cautious approach and rising inflation may contribute to a weakening market sentiment, potentially leading to a downward movement in the index.
his recommendation is for educational purposes only. Always consult your financial advisor before making any investment decisions. Stock trading involves risks, including the potential loss of capital. Ensure to evaluate your risk tolerance and conduct thorough research.

NASDAQ ShortBased on the previous analysis, I am still bearish biased and my entry might be based around the 4H Order / Breaker lock at around 21730.
If it respects it, then we will be on a bearish run. If not, we might look for a buy setup towards the All Time High


NASDAQ Analysis scenarios ideaWe can see 2 Gaps in the Nasdaq, with USA Elections ahead i expect volatility.
I think we will close the 19800 gap first, then 19600 for then going up.
It depends a lot in the USA elections results
Always do your research

NASDAQ100 Plummets! Short Trade Nears Final Target!NASDAQ100 (NDX) Analysis:
NASDAQ100 (NDX) has seen a strong downward trend on the 15-minute chart, with the trade setup delivering impressive results. Targets 1 through 3 have been hit, and the price is closing in on the final TP4 level, making this an ideal short trade for traders leveraging the momentum.
Trade Summary:
Entry Level: 20429.42
Target Levels:
TP1: 20323.94 ✅
TP2: 20153.26 ✅
TP3: 19982.58 ✅
TP4: 19877.10 (nearly hit)
Stop Loss: 20514.76
The Risological Dotted Trendline guided traders perfectly through this short trade, marking a strong resistance level as the index continued its descent.

NASDAQ 100 Sinks on AI Cost Woes - Full Target Breakthrough HIT!NASDAQ 100 (NDX) Analysis using Risological Swing Trader:
In the 15-minute timeframe, NASDAQ 100 (NDX) demonstrated a powerful bearish move, with all targeted profit levels being achieved in a swift drop. This short trade setup showed significant follow-through as investor sentiment shifted negatively due to concerns over escalating AI expenses reported by Wall Street's megacaps.
Key Highlights:
Entry Level: 20,429.42
Target Levels:
TP1: 20,323.94
TP2: 20,153.26
TP3: 19,982.58
TP4: 19,877.10
Stop Loss: 20,514.76
Context:
This bearish momentum aligns with Wall Street’s close on a lower note as major tech giants highlighted rising costs linked to AI developments. The day's range fluctuated between 19,880.26 and 20,227.19, underscoring the volatility and risk aversion among investors. The setup capitalized effectively on this negative sentiment, reinforcing the bearish outlook.
Summary:
This trade on NASDAQ 100 hit all targets with precision, benefiting from the broader market's reaction to heightened cost pressures in the tech sector. This downward move underscores the impact of macroeconomic concerns on equity performance, particularly in high-cost sectors like AI.

NasdaqA strong divergence is in the making. If it's valid, it would send NDX down at least 9%, and BTC may go aggressively down, too.

U.S. Stocks' foreseeable goalsThe most important index for the reflection of the American Stocks market is the SP:SPX , so let's start with it. Unfortunately, now the chart of this index is not rich in models, so the current logic of movements in our opinion is described by the EXP model from July 30 on the daily timeframe👇
As long as the price is below the 4-point level (5 390.95), the target levels are 100% (5 125.93) and 200% (4 873.94). In case the price returns above the level of 4 point and goes beyond the trend line, there will be a second attempt to reach the target resistance level of 5 582.31 - the formally reached target of the impulse of August 1. It is necessary to mention that this pattern, despite being on the daily timeframe - is weak.
In addition, let's look at a chart of the NASDAQ:NDX - this index includes the 100 largest non-financial companies traded on the Nasdaq exchange, primarily technology stocks.
Consideration of this index is additionally interesting because most institutional managers consider BINANCE:BTCUSDT to be in the technology sector, so NASDAQ:NDX and BINANCE:BTCUSDT is often correlated.
First, let's look at the AMEXP model that formed in mid-March 2023 on the weekly timeframe and described the entire uptrend within the 2023-2024 period on this index👇
In this model we are primarily interested in the level of HP (18 289.68), currently acting as an extreme support on the weekly timeframe, and if the price can consolidate under this level, the next support will be the level of 100% (15 891.73).
More locally, on the daily timeframe, the current movement is described by the EXP model from July 24, where the price has already reached the first target level of 100% (18 355.48)👇
It is very interesting that now on NASDAQ:NDX the price has settled in the zone of 18 355.45-18 289.68 formed by 100% and HP levels and if we don't see a rebound soon and the price tries to consolidate under this zone, the next target level will be 17 296.42.
By the way, we do not exclude that the movement towards 17,296.42 will be accompanied by an attempt of CME:BTC1! to close the CME GEP at the level of $57,805👇

❌A bearish MTR setup has been formed❌Considering the breaking of the upward trend line and the formation of the descending MTR, it is likely that it can continue to fall until the first target, 17500
