NEAR - an addition to the original idea (AMD model).My first review here -
Nothing has changed; everything is still relevant. I'm just analyzing it in terms of the AMD model.
It looks really technical and cool!
BINANCE:NEARUSDT.P
Nearprotocol

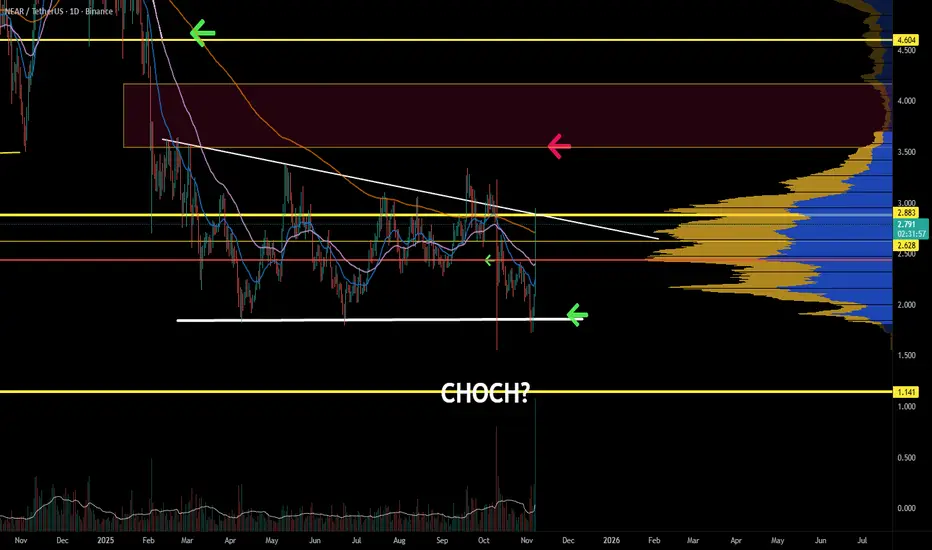
NEAR Protocol (NEAR) – TA UpdateNEAR is at a critical decision point.
Price has formed a short-term higher low and is pushing back into a key resistance / prior supply zone. This area has repeatedly capped price in the past, so how NEAR behaves here matters.
Momentum is recovering from oversold conditions, pointing to seller exhaustion rather than strong buyer control just yet. For this to become meaningful, price needs to reclaim and hold above this zone, which would confirm a short-term CHoCH and shift structure to neutral.
The volume profile shows a low-volume pocket above current price. If NEAR can hold this reclaim, there’s room for a sharp move into the next high-volume area. A rejection here likely sends price back to retest recent demand.
This is the level that decides whether this move is just a bounce or the start of something bigger.
Watching closely.

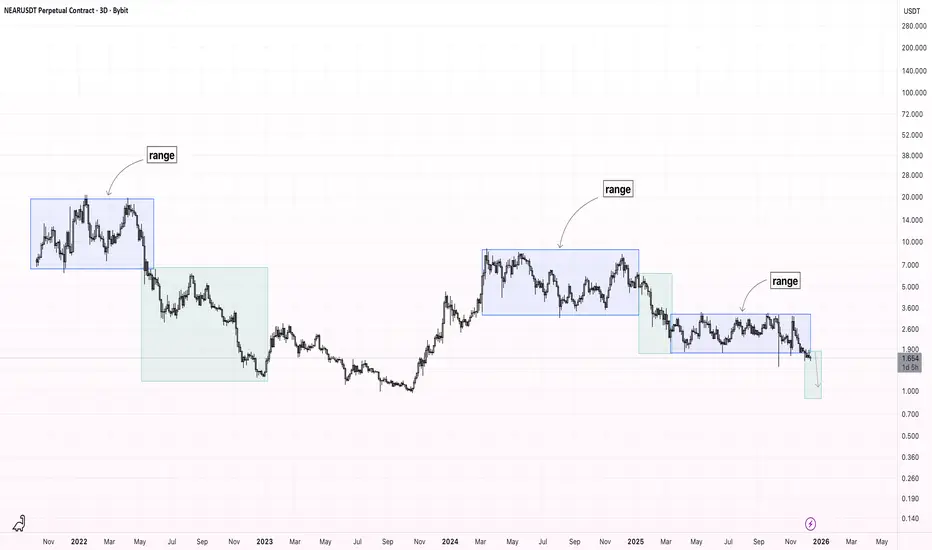
NEAR - spot, long term.BINANCE:NEARUSDT.P
Throughout 2025, the coin remained within its range.
I consider exiting the range a deviation, and we will get the same deviation on the other side of the range.
Good luck with your trading! Use your risk management strategy.
The ideal entry point will be: $1.4 and $1.25.
The targets on the chart are a minimum of $3.2.

NEAR Protocol Long Trade Setup on 4-Hour TimeframeTrade Setup Details
Direction: Long (buy).
Entry Trigger: Enter on a confirmed breakout above the upper trendline of the falling wedge, ideally around $1.60-$1.65, with a 4H candle close above and accompanying volume increase. Wait for confirmation to avoid false breaks.
Stop Loss: Set at $1.45 (just below the wedge's recent low and near $1.53 support for buffer). This limits downside risk if the pattern fails and price breaks lower.
Take Profit Targets (scale out progressively):TP1: $1.75 (partial exit at minor resistance, ~15% gain from entry).
TP2: $1.89 (aligns with recent predictions and wedge projection height, ~20-25% gain).
blockchain.news
TP3: $2.00+ (trail stops or exit at R1 for ~30-40% gain, as suggested in some analyses).
tradingview.com
Risk-Reward Ratio: Aim for 1:2 minimum (e.g., $0.15 risk for $0.30+ reward), scaling up to 1:3 on full targets.
Position Sizing: Risk no more than 1-2% of total capital per trade. For a $10,000 account, position size would be ~$5,000-$6,000 assuming 1% risk ($100 max loss).
Additional Confirmations: RSI breaking above 50 for momentum.
MACD histogram flipping positive.
Stochastic crossover in oversold territory.
Avoid entry if broader market (e.g., BTC) is in sharp decline.
This setup leverages the potential bullish reversal from the 4H wedge while respecting the neutral-to-bearish indicators. Monitor for invalidation below $1.45, which could signal continuation of the downtrend toward $1.29.

NEAR protocol price analysis#NEARprotocol: early signs of stabilization after a prolonged correction
On the OKX:NEARUSDT chart, price action shows several notable technical elements worth monitoring.
trading volumes remain relatively stable, despite broader market weakness.
price is currently respecting a descending trendline from the outside, suggesting controlled downside rather than a structural breakdown
Additionally, the long corrective A–B–C pattern appears to be approaching its terminal phase.
From a fundamental perspective, Near Protocol’s market capitalization is around $2 billion. While token emission and supply dynamics could be more deflationary, the current valuation is not excessive for a layer-1 ecosystem of this size.
If the market environment improves, a medium-term recovery scenario becomes plausible:
$4–6 as a conservative target range,
$8 as an optimistic scenario under strong market sentiment.
Further upside would likely require a broader market expansion and renewed ecosystem demand.
Question:
Do you believe CRYPTOCAP:NEAR still has room for growth in this cycle, or has its primary expansion phase already passed?
______________
◆ Follow us ❤️ for daily crypto insights & updates!
🚀 Don’t miss out on important market moves
🧠 DYOR | This is not financial advice, just thinking out loud

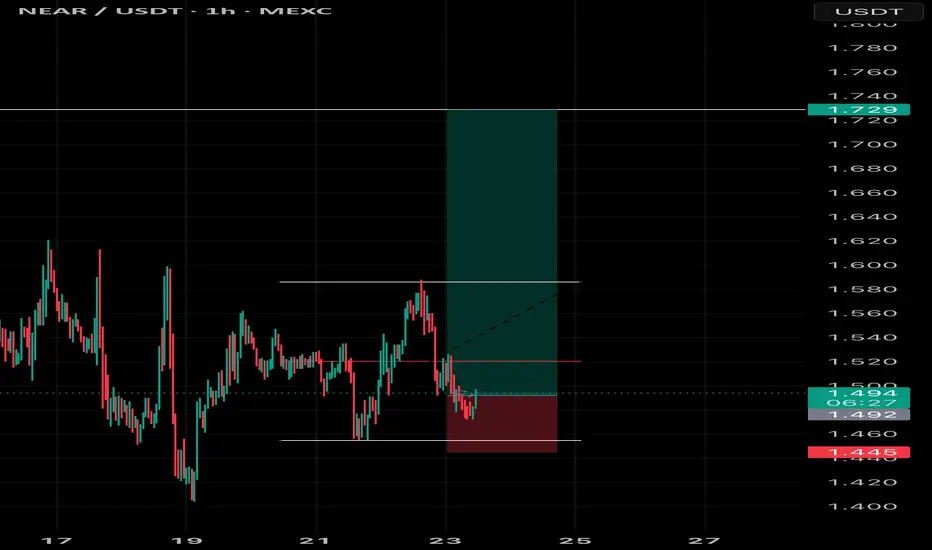
NEAR / USDT – 1HNEAR / USDT – 1H
Bullish context remains intact.
On Total Market Cap we saw a clear 4H MSS close, followed by a clean 50% retrace.
NEAR is showing the same structure and reaction.
Price is currently reacting from the 50% retracement / discount zone, with support holding.
As long as this level holds, bias stays bullish
This looks like a continuation setup in line with HTF market structure.
What do you expect next: a small liquidity sweep below support or direct continuation to the upside? 📈
NEAR - Range-Based Market Structure – Bearish Breakdown Price action is predominantly range-bound.
Throughout the chart, price forms clear consolidation ranges, followed by directional moves after range breakouts.
Currently, the latest range has been broken to the downside, confirming bearish continuation. Structure remains weak below former range support, which is now acting as resistance.
Expectation: continuation of the downside move toward the following levels:
$1.25
$1.00
$0.90
As long as price stays below the broken range, bearish bias remains valid.
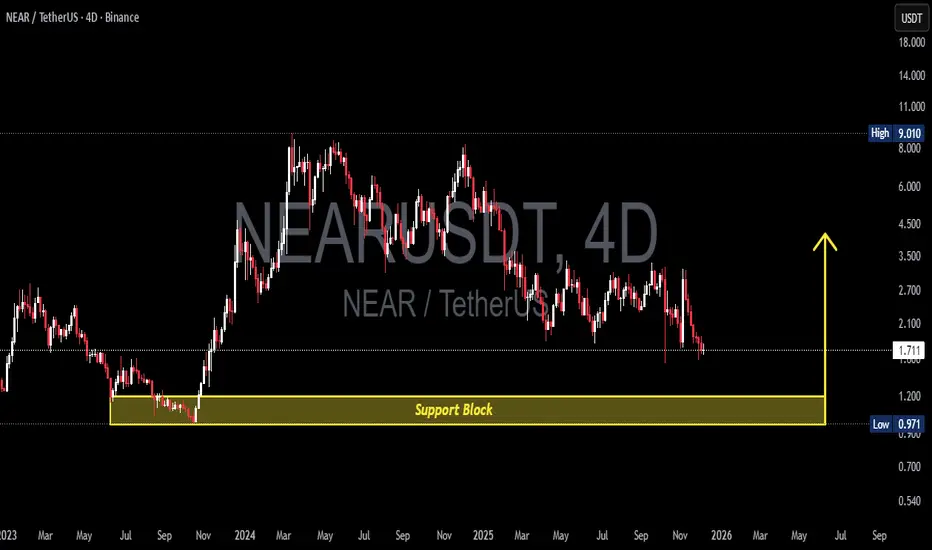
NEAR/USDT: Approaching the Ultimate Decision Zone (1.20–0.97)NEAR/USDT is entering a critical phase. Price is moving toward the major Support Block at 1.20–0.97, the same demand zone that previously triggered NEAR’s explosive rally during 2023–2024.
This isn’t just another support level — it’s a macro accumulation zone where institutional orders historically stepped in.
Although the broader trend still prints lower highs, signaling a bearish macro structure, NEAR is now testing the most significant demand area of the last two years. Zones like this often become the battlefield where large buyers versus exhausted sellers decide the next major trend.
---
🔥 Bullish Scenario — A Major Rebound Could Begin Here
The 1.20–0.97 block has the potential to generate a macro reversal if we see:
A strong 4D bullish reversal candle (engulfing/hammer)
A clear volume spike
The formation of a higher low after the retest
If confirmed:
Target 1: 2.70
Target 2: 3.50 – 4.50
Reward potential is massive because entries near the bottom give extremely favorable R:R.
---
⚠️ Bearish Scenario — A Breakdown Opens the Door to Deeper Discounts
A 4D close below 0.97 would be a structural shift.
The yellow block turns from demand → supply, and the next leg down could unfold:
Target 1: 0.54
Target 2: 0.30–0.40
Failure to hold 0.97 signals buyers are not yet ready to defend the macro trend.
---
📌 Market Structure & Pattern Insight
NEAR is currently within a descending structure, but approaching macro demand capable of ending this pattern.
This zone may become the foundation for a large Double Bottom, or a full trend breakdown if it fails.
This is a decision point that will define NEAR’s direction entering 2026.
---
#NEAR #NEARUSDT #Crypto #PriceAction #SupportZone #DemandBlock #CryptoAnalysis #MarketStructure
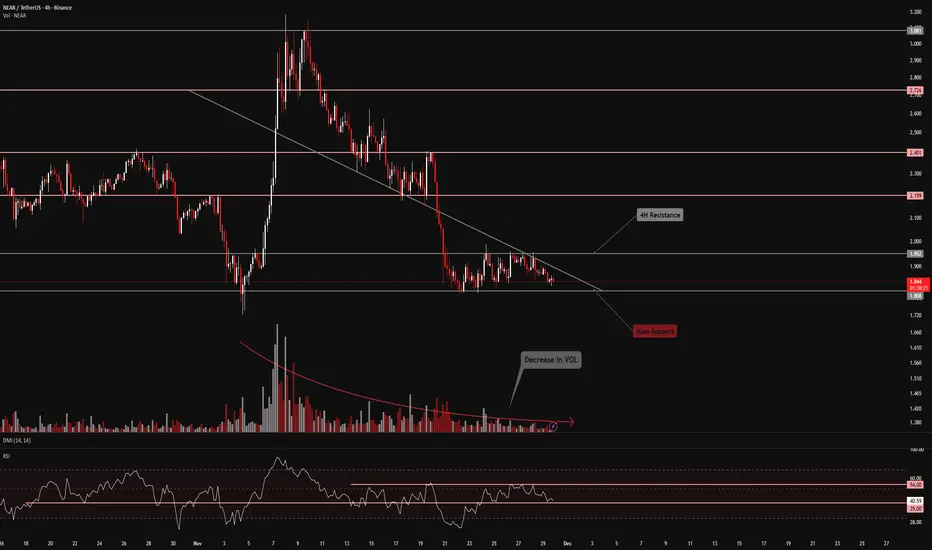
FireHoseReel | NEAR: Bulls and Bears Face Off at Key Levels🔥 Welcome to FireHoseReel !
Let’s dive into the 4H analysis of NEAR.
👀 After a sharp and powerful rally, NEAR faced a heavy rejection at the $3.081 level and entered a corrective phase.
This correction has been unusually deep and aggressive.
📉 NEAR is now sitting on a critical support at $1.808. Losing this level could activate our short trigger and open the door for further downside.
📊 NEAR’s trading volume has dropped, similar to many other coins in the market.
The first solid volume expansion will likely signal NEAR’s next directional move.
🔭 NEAR is known for making sharp moves after losing or reclaiming key support or resistance levels, which often provides excellent risk-to-reward opportunities.
✍️ Potential NEAR scenarios are outlined below.
Always make sure to use them alongside your own trading strategy.
🟢 Long Scenario:
A breakout above the major resistance at $1.952, supported by rising buy volume and an RSI break above 54, could trigger a valid long setup.
🔴 Short Scenario:
A breakdown below the critical support at $1.808, combined with increasing sell volume and RSI dropping below 39, could lead to a significant downside move.
❤️ Risk Management & Emotional Discipline
Crypto trading is highly risky. Without proper risk management and emotional control, trading becomes pure gambling.
Let logic always lead your decisions—not emotions. Trade with control and discipline.
Near can act as rochet 24$ gain toward 2.81$ is on the table Hi the support and resistances on the chart are based on the previous data and weekly candlesticks if BINANCE:NEARUSDT holds this last support the potential of 24% gain is logical toward 2.81$

NEAR may get its bounce soon. NEAR is testing a key horizontal support after a sharp rejection from the trendline. This level has held multiple times, and we’re now watching for a potential CHoCH that could signal early bullish structure.
Momentum oscillators are sitting near oversold conditions, showing the first hints of exhaustion from sellers — but structure hasn’t flipped yet. If buyers can defend this zone and push back toward the mid-range, the setup becomes far more interesting.
Lose this support, and the chart opens up a wide low-volume gap below. Until a clean CHoCH prints, this remains a reactive, not predictive zone. Patience.

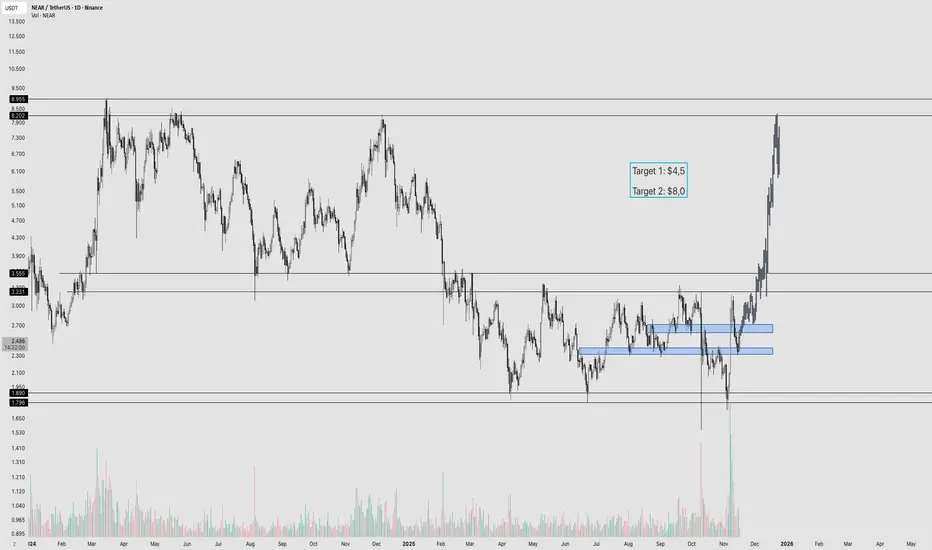
NEAR Protocol - Ready for $8? NEAR has been stuck in a 10-month range between $3.50 and $1.80. Recently, price pumped nearly 80%, followed by a 25% correction, and now it has returned to a crucial support zone at $2.30–$2.40.
This level is extremely important:
✅ If $2.30–$2.40 holds:
Price can bounce and potentially break the top of the range. The first upside target is $4.50–$5.00, and if that breaks, the next mid-term target is $8–$9.
❌ If this level fails:
The next support is $1.80–$2.00, the bottom of the long-term range.
Right now both NEAR and the crypto market are struggling, but if Bitcoin stabilizes or retraces upward, NEAR could gain the momentum needed to push higher. For now, the key is whether buyers defend $2.30–$2.40.
NEAR OR FARHello friends
NEAR After the price compression in the channel, you will see that the channel has been broken and pumped with great force and the price has returned to the specified level.
Now, we need to see how the buyers react in the specified support levels. That is why we have set the support levels and if the price is supported by these levels, it can move to the targets we have set.
Be sure to observe risk and capital management and buy in stages.
*Trade safely with us*

$NEAR – Approaching a key support zoneCRYPTOCAP:NEAR has reached an important Fibonacci + structural support zone, aligning perfectly with the long-term trendline.
This area has acted as a strong demand zone multiple times in the past — making it a good DCA (dollar-cost averaging) region for long-term investors.
If price holds this level, we could see a reversal or strong bounce toward the $4.5 and $6.6 resistance zones.
Key levels to watch:
🟢 Support: $1.8 – $2.2 (Fib + Trendline zone)
🔴 Resistance: $4.5 → $6.6
Patience pays off near major confluence zones 👀

NEAR tries to breakout #NEAR / USDT
NEAR is trying to breakout resistance area with strong volume … once we got valid breakout and stability above the first R/S we go straight to next one in my chart
For the best approach Keep your eye on resistance area and monitor price action
Best of wishes

NEARUSDT Epic Breakout! Is This the Beginning of Major Bullish?After more than a year trapped in a steep downtrend, NEAR is finally showing strong signs of revival!
The latest large bullish candle has broken above the long-term descending trendline — a crucial moment that often signals the beginning of a major trend reversal in the crypto market.
This move represents a potential shift in market structure after a long period of accumulation. However, as always, the market never gives certainty — we are now at a critical turning point: is this a confirmed breakout or just a false move before another correction?
---
Structure & Technical Pattern
A descending trendline has been suppressing the price since the late 2024 peak.
The recent 2D candle breakout confirms a shift in supply-demand dynamics.
This pattern suggests that selling pressure has weakened, and buyers are starting to gain control.
The 3.00–3.40 USDT zone now acts as the key confirmation area — whether the price can hold above it will determine the next major direction.
---
Bullish Scenario (Buyers Take Over)
If NEAR manages to close and sustain above the trendline and the 3.00–3.40 zone, it could open the door for a significant bullish continuation.
Potential upside targets include:
🎯 Target 1: 3.40 (nearest resistance & breakout validation)
🎯 Target 2: 4.85 (next supply zone)
🎯 Target 3: 6.05
🎯 Target 4: 7.77–8.24 (major high zone, potential full reversal from the long bearish trend)
If a successful retest occurs around 3.00–3.10 and the price rebounds with strong volume, it would serve as a powerful confirmation of a new bullish trend forming.
---
Bearish Scenario (False Breakout & Continuation of Correction)
However, if the price fails to hold above the trendline — especially if a strong bearish reversal candle appears — this move could become a bull trap, leading to renewed selling pressure.
Key levels to watch:
⚠️ Main support: 2.20
⚠️ Major support: 1.55 (a strong demand zone tested multiple times)
A breakdown below 2.20 would confirm a new lower low structure, potentially pushing the price back toward the 1.55 USDT demand zone.
---
Strategic Conclusion
NEAR is currently at a critical transition point — between the birth of a new bullish trend or the final test of its long-term bearish phase.
Strong breakouts like this don’t happen often, and they often mark the beginning of major directional shifts.
However, confirmation is key — a strong close above the trendline with high volume will solidify the bullish case.
Aggressive traders may look for entries around the trendline retest, while conservative traders may wait for a solid close above 3.40.
---
Additional Technical Notes
Buyer momentum is surging, as the bullish candle broke through a major supply zone with conviction.
Volume confirmation is crucial: a breakout without volume could signal a false move.
Correlation with BTC/ETH matters — if Bitcoin remains bullish, NEAR’s breakout is more likely to sustain.
Indicators like RSI/MACD are likely beginning to show positive momentum — a classic sign of early-stage reversal.
---
#NEAR #NEARUSDT #CryptoBreakout #TrendReversal #CryptoAnalysis #TechnicalAnalysis #Altcoins #CryptoTrading #SupportResistance #PriceAction #BullishBreakout #TrendChange #NEARProtocol

NEAR — not so clear, but still in gear Hi everyone 👋
It’s Sunday — time to slow down a bit, recharge, and get ready for a new trading week.
As for NEAR, I believe it’s forming a sustainable uptrend, and right now we can see signs of potential continuation.
As usual, I’ve marked two possible scenarios on the chart with orange and purple arrows.
The invalidation zone is shown in red.
🎯 Local target: 2.944
❌ Plan invalidation: below 2.818
🚀 Global target: 3.20 and higher — however, for now, I’m only looking for the price to reach my local target at 2.944, since, in my view, a corrective triangle is still forming. After hitting 2.944, the price might pull back to around 2.8 before any further continuation upward.
⚠️ Disclaimer: This is not financial advice.
Trade responsibly — and never trade without stop-losses.
If you enjoy my analysis — don’t forget to like, comment, and follow so you don’t miss my next updates 💬

NEARUST - On the vergeof breakout!Keep your eyes on it — it’s about to explode very soon.
It’s currently sitting right on the trendline, and once it breaks through, that’ll give it the push it needs to break out of the accumulation zone it’s been forming for about 276 days.
The EMA is preparing for a golden cross, and yesterday’s pump indicates a massive inflow of liquidity entering the market — a clear bullish signal showing strong buying pressure
Try to get in while it’s still in the accumulation zone.
Best Regards:
Ceciliones🎯

NEAR Protocol... moves to the top of the rangeNEAR made a bullish move — and while every pump deserves recognition, the reality is that nothing significant has changed. Price action has simply pushed to the top of the range, meaning that if you’re looking for entries here, you’re effectively buying into resistance on lower timeframes.
Higher timeframes remain structurally valid, but a confirmed Change of Character (CHoCH) would strengthen the case for a true reversal. At the moment, momentum and trend oscillators are overbought on lower timeframes, while those on higher timeframes remain oversold, highlighting a mixed and uncertain setup.
NEAR reversal areaNear is in a perfect level to bounce. Market is in extreme fear but this might be a good level to add on to holdings. Its both a good level of support from past price actions and current fibo levels.
Initial target is marked on the chart, lets see if we get rekt again :) Risk reward ratio looks good to me.
Cheers

Near Protocol holding the rangeNEAR is showing strength by holding the range and shaking of the flush like nothing happened. As long as PA is within range, a breakout still could be planned for. A bullish reversal would require a CHOCH that confirms a HH, and BOS to the downside would require a confirmed LL. Patients.

#NEAR/USDT can give massive rally but breakout needed#NEAR
The price is moving within a descending channel on the 1-hour frame, adhering well to it, and is heading for a strong breakout and retest.
We have a bearish trend on the RSI indicator that is about to be broken and retested, which supports the upward breakout.
There is a major support area in green at 2.353, which represents a strong support point.
We are heading for consolidation above the 100 moving average.
Entry price: 2.437
First target: 2.529
Second target: 2.625
Third target: 2.744
Don't forget a simple matter: capital management.
When you reach the first target, save some money and then change your stop-loss order to an entry order.
For inquiries, please leave a comment.
Thank you.

$NEAR will reach to 8$ soonIf it's close above 3.4$ weekly it's easy move to 8$ and then 12$ target.
