NEAR Traders Are Being Set Up Is This the Final Trap Before DropYello Paradisers! Are you watching what’s happening with #NEAR right now? Because this move might be the last warning before a much deeper drop. We’ve spotted a series of red flags, and the chart is speaking loud and clear smart money is positioning, and it’s not on the bullish side.
💎#NEAR respected the descending resistance and failed to break above it, which confirms ongoing weakness. The price action on higher time frames shows a probable bearish structure there is a major probability for the downside move., further we have seen a clean divergence as well, as long momentum sustained within the supply zone, we can expect a further move down toward the support level of 1.616, which aligns both as a structure level and a moderate demand zone.
💎#NEAR broke lower trigger line of the buying climax (climactic action bar) with a strong momentum candle after swept the upper trigger line of buying climax. strongly suggesting that institutional players are offloading and preparing for more downside move according to volume spread analysis (VSA). We’ve seen a buying climax on the retracement, followed by a climactic action candle with ultra-high volume a textbook probability of smart money distribution.
💎If momentum holds, the probability of next major level sits around 1.49, which is a major support level that could be tested soon.
💎If #NEAR manages to break above the key resistance at 1.91 with a strong momentum candle, this whole bearish probability would be invalidated, and we could instead see a bullish continuation. As always, we let price confirm our bias.
Discipline is key, Paradisers! The charts may look volatile, but this is where professionals thrive and amateurs panic. Don’t let emotions guide your trades. Wait for clear confirmation and manage risk like a pro. Strive for consistency, not quick profits. Treat the market as a businessman, not as a gambler.
MyCryptoParadise
iFeel the success🌴
NEARUSD

NEAR Trend Reversal | Sellers Breaking Down (4H)We have a bullish CH (Change of Character) on the chart, which is the first sign of a trend reversal. Note that this trend change is referring to hourly timeframes trend reversals always start from lower timeframes.
It is also located on a key level. This is the same shadow low (wick) that price previously created during the market crash. A move back above this shadow indicates that the bottom was likely formed around this area, and traders expect the low to be around this zone.
Additionally, we have price compression/consolidation, which represents a battle between buyers and sellers. This suggests that the trend may change soon, as many traders have been buying against the prevailing trend.
A liquidity pool at the lows has also been swept.
The market structure and chart signals support buy/long positions. We have two entry points, and we can enter using a DCA approach.
Targets are marked on the chart.
If you would like us to analyze a coin or altcoin for you, first like this post, then comment the name of your altcoin below.

NEAR protocol price analysis#NEARprotocol: early signs of stabilization after a prolonged correction
On the OKX:NEARUSDT chart, price action shows several notable technical elements worth monitoring.
trading volumes remain relatively stable, despite broader market weakness.
price is currently respecting a descending trendline from the outside, suggesting controlled downside rather than a structural breakdown
Additionally, the long corrective A–B–C pattern appears to be approaching its terminal phase.
From a fundamental perspective, Near Protocol’s market capitalization is around $2 billion. While token emission and supply dynamics could be more deflationary, the current valuation is not excessive for a layer-1 ecosystem of this size.
If the market environment improves, a medium-term recovery scenario becomes plausible:
$4–6 as a conservative target range,
$8 as an optimistic scenario under strong market sentiment.
Further upside would likely require a broader market expansion and renewed ecosystem demand.
Question:
Do you believe CRYPTOCAP:NEAR still has room for growth in this cycle, or has its primary expansion phase already passed?
______________
◆ Follow us ❤️ for daily crypto insights & updates!
🚀 Don’t miss out on important market moves
🧠 DYOR | This is not financial advice, just thinking out loud

$NEAR / Accumulation Broken Down- UPDATED CHART -
Removed accumulation box as it is fully broken down past demand/support as well and noted the change of character to the downside ✍🏽
Next weekly demand/support level to watch is $1.00. Hard to see us dipping even further but ready with dry powder if we do.
Still willing to add to my position with NEAR but not until buyers come back. #paytience

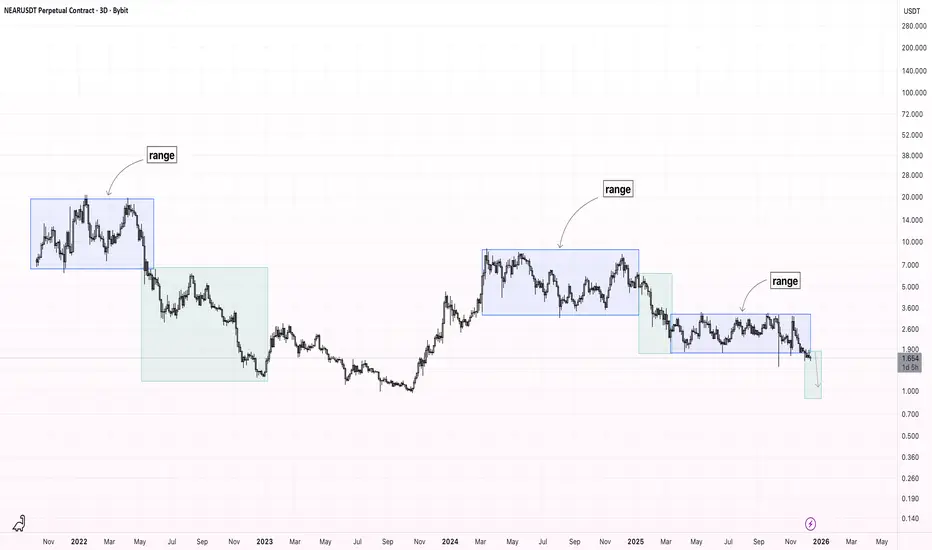
NEAR - Range-Based Market Structure – Bearish Breakdown Price action is predominantly range-bound.
Throughout the chart, price forms clear consolidation ranges, followed by directional moves after range breakouts.
Currently, the latest range has been broken to the downside, confirming bearish continuation. Structure remains weak below former range support, which is now acting as resistance.
Expectation: continuation of the downside move toward the following levels:
$1.25
$1.00
$0.90
As long as price stays below the broken range, bearish bias remains valid.
NEAR Looks Bullish (4H)In the orange circle, liquidity has been swept, and the price has reacted to a strong historical demand zone.
After the change of character (CH), we can enter a buy/long position on the pullback.
The targets are marked on the chart.
If the stop-loss is touched, the setup will be invalidated.
Do not enter the position without capital management and stop setting
Comment if you have any questions
thank you

NEARUSDT - Catch the Bottom!NEAR is pumping hard right now — honestly I really like its price action.
Remember the post where I explained how to enter a successful futures setup?
I’ll attach it below for you, take a look at it.
NEAR is showing the same pattern from the Ceciliones futures methodology :
-It’s a strong coin with a solid market cap.
-It formed a bearish pattern and is giving a bearish signal suggesting a drop.
-A lot of traders are hunting for the “perfect” short entry.
-Almost everyone who was long either closed or got liquidity-grabbed.
-Spot holders got hit hard and exited with losses.
This creates the perfect environment for an upside move — remember what I’m telling you.
Add it to your watchlist: the coin is currently at the bottom, fear levels are at their peak, and that’s exactly the kind of environment that fuels a bull run.
Keep your eye on NEAR — you won’t regret it.
Best Regards:
Ceciliones🎯

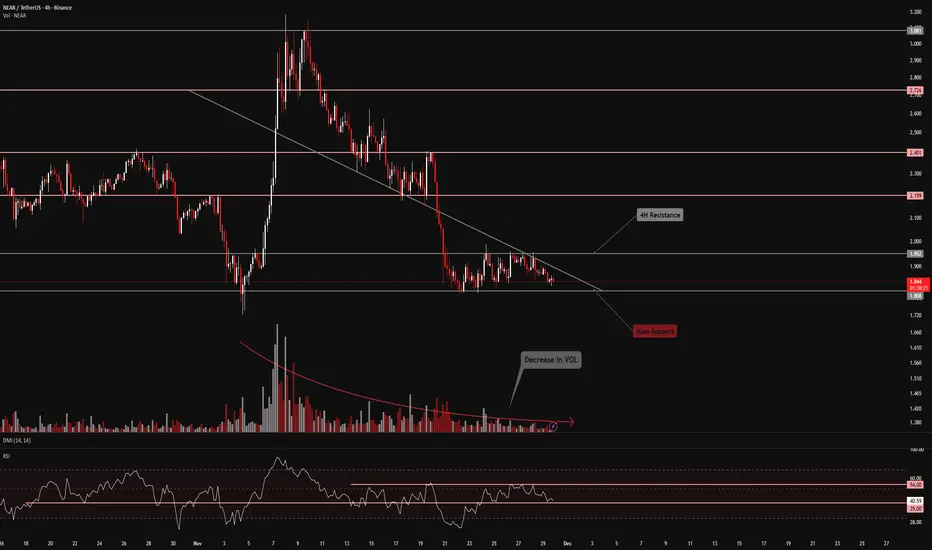
FireHoseReel | NEAR: Bulls and Bears Face Off at Key Levels🔥 Welcome to FireHoseReel !
Let’s dive into the 4H analysis of NEAR.
👀 After a sharp and powerful rally, NEAR faced a heavy rejection at the $3.081 level and entered a corrective phase.
This correction has been unusually deep and aggressive.
📉 NEAR is now sitting on a critical support at $1.808. Losing this level could activate our short trigger and open the door for further downside.
📊 NEAR’s trading volume has dropped, similar to many other coins in the market.
The first solid volume expansion will likely signal NEAR’s next directional move.
🔭 NEAR is known for making sharp moves after losing or reclaiming key support or resistance levels, which often provides excellent risk-to-reward opportunities.
✍️ Potential NEAR scenarios are outlined below.
Always make sure to use them alongside your own trading strategy.
🟢 Long Scenario:
A breakout above the major resistance at $1.952, supported by rising buy volume and an RSI break above 54, could trigger a valid long setup.
🔴 Short Scenario:
A breakdown below the critical support at $1.808, combined with increasing sell volume and RSI dropping below 39, could lead to a significant downside move.
❤️ Risk Management & Emotional Discipline
Crypto trading is highly risky. Without proper risk management and emotional control, trading becomes pure gambling.
Let logic always lead your decisions—not emotions. Trade with control and discipline.
Near can act as rochet 24$ gain toward 2.81$ is on the table Hi the support and resistances on the chart are based on the previous data and weekly candlesticks if BINANCE:NEARUSDT holds this last support the potential of 24% gain is logical toward 2.81$

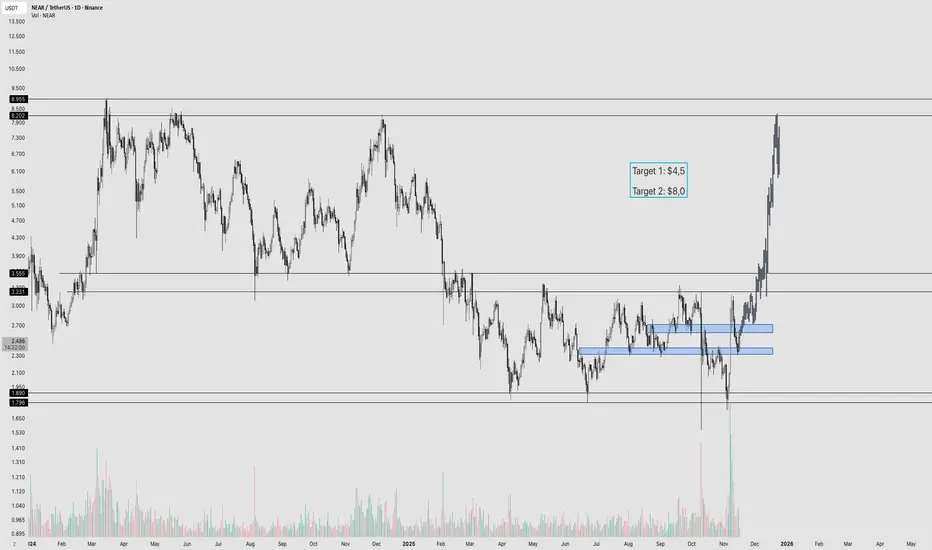
NEAR Protocol - Ready for $8? NEAR has been stuck in a 10-month range between $3.50 and $1.80. Recently, price pumped nearly 80%, followed by a 25% correction, and now it has returned to a crucial support zone at $2.30–$2.40.
This level is extremely important:
✅ If $2.30–$2.40 holds:
Price can bounce and potentially break the top of the range. The first upside target is $4.50–$5.00, and if that breaks, the next mid-term target is $8–$9.
❌ If this level fails:
The next support is $1.80–$2.00, the bottom of the long-term range.
Right now both NEAR and the crypto market are struggling, but if Bitcoin stabilizes or retraces upward, NEAR could gain the momentum needed to push higher. For now, the key is whether buyers defend $2.30–$2.40.
NEAR OR FARHello friends
NEAR After the price compression in the channel, you will see that the channel has been broken and pumped with great force and the price has returned to the specified level.
Now, we need to see how the buyers react in the specified support levels. That is why we have set the support levels and if the price is supported by these levels, it can move to the targets we have set.
Be sure to observe risk and capital management and buy in stages.
*Trade safely with us*

$NEAR – Approaching a key support zoneCRYPTOCAP:NEAR has reached an important Fibonacci + structural support zone, aligning perfectly with the long-term trendline.
This area has acted as a strong demand zone multiple times in the past — making it a good DCA (dollar-cost averaging) region for long-term investors.
If price holds this level, we could see a reversal or strong bounce toward the $4.5 and $6.6 resistance zones.
Key levels to watch:
🟢 Support: $1.8 – $2.2 (Fib + Trendline zone)
🔴 Resistance: $4.5 → $6.6
Patience pays off near major confluence zones 👀

NEAR tries to breakout #NEAR / USDT
NEAR is trying to breakout resistance area with strong volume … once we got valid breakout and stability above the first R/S we go straight to next one in my chart
For the best approach Keep your eye on resistance area and monitor price action
Best of wishes

NEAR — not so clear, but still in gear Hi everyone 👋
It’s Sunday — time to slow down a bit, recharge, and get ready for a new trading week.
As for NEAR, I believe it’s forming a sustainable uptrend, and right now we can see signs of potential continuation.
As usual, I’ve marked two possible scenarios on the chart with orange and purple arrows.
The invalidation zone is shown in red.
🎯 Local target: 2.944
❌ Plan invalidation: below 2.818
🚀 Global target: 3.20 and higher — however, for now, I’m only looking for the price to reach my local target at 2.944, since, in my view, a corrective triangle is still forming. After hitting 2.944, the price might pull back to around 2.8 before any further continuation upward.
⚠️ Disclaimer: This is not financial advice.
Trade responsibly — and never trade without stop-losses.
If you enjoy my analysis — don’t forget to like, comment, and follow so you don’t miss my next updates 💬

NEAR Is Super Bullish (3D)One of the strong Layer 1 projects in the market with a solid chart that is not showing a correction like most altcoins is NEAR.
It has a bullish contracting pattern on the higher timeframes, and it seems that its strongest wave has just started.
This coin has good growth potential in the larger timeframes.
It can be considered for investment and holding, even in this non-bullish market phase.
It’s likely that NEAR will be among the first altcoins to lead the upcoming altseason.
For risk management, please don't forget stop loss and capital management
When we reach the first target, save some profit and then change the stop to entry
Comment if you have any questions
Thank You

NEARUST - On the vergeof breakout!Keep your eyes on it — it’s about to explode very soon.
It’s currently sitting right on the trendline, and once it breaks through, that’ll give it the push it needs to break out of the accumulation zone it’s been forming for about 276 days.
The EMA is preparing for a golden cross, and yesterday’s pump indicates a massive inflow of liquidity entering the market — a clear bullish signal showing strong buying pressure
Try to get in while it’s still in the accumulation zone.
Best Regards:
Ceciliones🎯

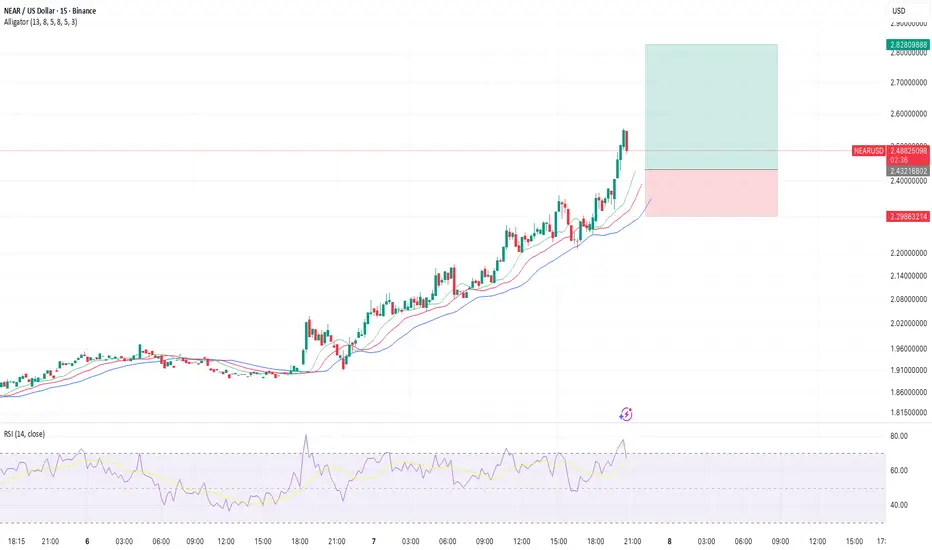
NEARUSD, 1H, 1:3 RRRUsing FVG (Fair Value Gap), it would reap a RR of 1:3. Entry point 2.432, SL 2.298, and TP around 2.828
#NEAR/USDT can give massive rally but breakout needed#NEAR
The price is moving within a descending channel on the 1-hour frame, adhering well to it, and is heading for a strong breakout and retest.
We have a bearish trend on the RSI indicator that is about to be broken and retested, which supports the upward breakout.
There is a major support area in green at 2.15, representing a strong support point.
We are heading for consolidation above the 100 moving average.
Entry price: 2.18
First target: 2.23
Second target: 2.27
Third target: 2.33
Don't forget a simple matter: capital management.
When you reach the first target, save some money and then change your stop-loss order to an entry order.
For inquiries, please leave a comment.
Thank you.

#NEAR/USDT can give massive rally but breakout needed#NEAR
The price is moving within a descending channel on the 1-hour frame, adhering well to it, and is heading for a strong breakout and retest.
We have a bearish trend on the RSI indicator that is about to be broken and retested, which supports the upward breakout.
There is a major support area in green at 2.353, which represents a strong support point.
We are heading for consolidation above the 100 moving average.
Entry price: 2.437
First target: 2.529
Second target: 2.625
Third target: 2.744
Don't forget a simple matter: capital management.
When you reach the first target, save some money and then change your stop-loss order to an entry order.
For inquiries, please leave a comment.
Thank you.

$NEAR will reach to 8$ soonIf it's close above 3.4$ weekly it's easy move to 8$ and then 12$ target.

NEAR Ready For Higher!CBOE:NEAR done a 10x last year renewing faith in the asset.
Price is attempting to breakout above the High Volume Node resistance, $3, where we should see some strong momentum. Price may struggle at the weekly 200EMA before heading to the first target at $5.5, the weekly pivot.
Wave 2 is complete at the ' alt-coin golden pocket', 78.6 Fibonacci retracement and S1 pivot. Weekly RSi is bullish at the EQ.
Near could run to all time high this alt season..
Safe trading

NEAR/USDT - Swing Long | Low-Risk Setup Targeting +88%🚀 Trade Setup Details:
🕯 #NEAR/USDT 🔼 Buy | Long 🔼
⌛️ TimeFrame: 1D
--------------------
🛡 Risk Management (Example):
🛡 Based on $10,000 Balance
🛡 Loss-Limit: 1% (Conservative)
🛡 The Signal Margin: $789.89
--------------------
☄️ En1: 2.76 (Amount: $78.99)
☄️ En2: 2.638 (Amount: $276.46)
☄️ En3: 2.554 (Amount: $355.45)
☄️ En4: 2.474 (Amount: $78.99)
--------------------
☄️ If All Entries Are Activated, Then:
☄️ Average.En: 2.599 ($789.89)
--------------------
☑️ TP1: 3.079 (+18.47%) (RR:1.46)
☑️ TP2: 3.342 (+28.59%) (RR:2.26)
☑️ TP3: 3.709 (+42.71%) (RR:3.37)
☑️ TP4: 4.234 (+62.91%) (RR:4.97)
☑️ TP5: 4.901 (+88.57%) (RR:7)
☑️ TP6: Open 🔝
--------------------
❌ SL: 2.27 (-12.66%) (-$100)
--------------------
💯 Maximum.Lev: 4X
⌛️ Trading Type: Swing Trading
‼️ Signal Risk: 🙂 Low-Risk! 🙂
--------------------
🔗 www.tradingview.com
❤️ Your Like & Comments are valuable to us ❤️

Near moving above invh&s w/ a double bottom neckline just aboveThe inverse head and shoulders breakout not yet fully confirmed, but price is currently comfortably above its neckline. In hitting the inverse head and shoulders full target, it should also validate the double bottom breakout as well. *not financial advice*
