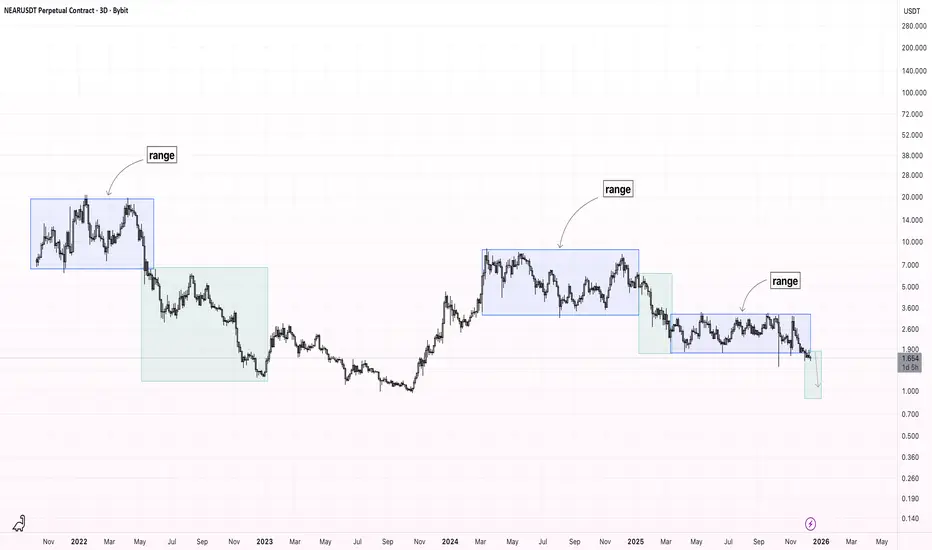
NEAR - Range-Based Market Structure – Bearish Breakdown Price action is predominantly range-bound.
Throughout the chart, price forms clear consolidation ranges, followed by directional moves after range breakouts.
Currently, the latest range has been broken to the downside, confirming bearish continuation. Structure remains weak below former range support, which is now acting as resistance.
Expectation: continuation of the downside move toward the following levels:
$1.25
$1.00
$0.90
As long as price stays below the broken range, bearish bias remains valid.
Nearusdtanalysis
NEARUSDT - historical bottom worth it!I know you’re tired of waiting and fed up with everyone saying “this is the bottom.”
But I’m telling you — this time is different from every previous cycle.
Alts have reached bottom zones they haven’t seen in years.
Take NEAR for example:
On a high timeframe like the 3D, it has printed a historical bottom — the same liquidity low it keeps bouncing from every cycle, after sweeping the previous low.
It’s forming a very strong bullish structure.
You have to take advantage of boredom, frustration, fear, and negative news.
If you’re not buying now… then when exactly are you planning to buy?
From here, the minimum target for this coin is $4
Best Regards: Ceciliones🎯

NEAR protocol price analysis#NEARprotocol: early signs of stabilization after a prolonged correction
On the OKX:NEARUSDT chart, price action shows several notable technical elements worth monitoring.
trading volumes remain relatively stable, despite broader market weakness.
price is currently respecting a descending trendline from the outside, suggesting controlled downside rather than a structural breakdown
Additionally, the long corrective A–B–C pattern appears to be approaching its terminal phase.
From a fundamental perspective, Near Protocol’s market capitalization is around $2 billion. While token emission and supply dynamics could be more deflationary, the current valuation is not excessive for a layer-1 ecosystem of this size.
If the market environment improves, a medium-term recovery scenario becomes plausible:
$4–6 as a conservative target range,
$8 as an optimistic scenario under strong market sentiment.
Further upside would likely require a broader market expansion and renewed ecosystem demand.
Question:
Do you believe CRYPTOCAP:NEAR still has room for growth in this cycle, or has its primary expansion phase already passed?
______________
◆ Follow us ❤️ for daily crypto insights & updates!
🚀 Don’t miss out on important market moves
🧠 DYOR | This is not financial advice, just thinking out loud

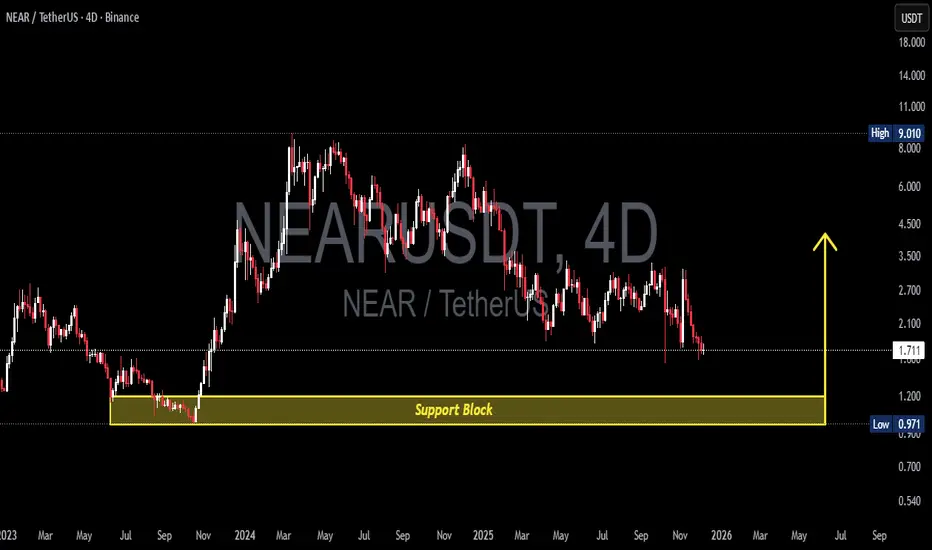
NEAR/USDT: Approaching the Ultimate Decision Zone (1.20–0.97)NEAR/USDT is entering a critical phase. Price is moving toward the major Support Block at 1.20–0.97, the same demand zone that previously triggered NEAR’s explosive rally during 2023–2024.
This isn’t just another support level — it’s a macro accumulation zone where institutional orders historically stepped in.
Although the broader trend still prints lower highs, signaling a bearish macro structure, NEAR is now testing the most significant demand area of the last two years. Zones like this often become the battlefield where large buyers versus exhausted sellers decide the next major trend.
---
🔥 Bullish Scenario — A Major Rebound Could Begin Here
The 1.20–0.97 block has the potential to generate a macro reversal if we see:
A strong 4D bullish reversal candle (engulfing/hammer)
A clear volume spike
The formation of a higher low after the retest
If confirmed:
Target 1: 2.70
Target 2: 3.50 – 4.50
Reward potential is massive because entries near the bottom give extremely favorable R:R.
---
⚠️ Bearish Scenario — A Breakdown Opens the Door to Deeper Discounts
A 4D close below 0.97 would be a structural shift.
The yellow block turns from demand → supply, and the next leg down could unfold:
Target 1: 0.54
Target 2: 0.30–0.40
Failure to hold 0.97 signals buyers are not yet ready to defend the macro trend.
---
📌 Market Structure & Pattern Insight
NEAR is currently within a descending structure, but approaching macro demand capable of ending this pattern.
This zone may become the foundation for a large Double Bottom, or a full trend breakdown if it fails.
This is a decision point that will define NEAR’s direction entering 2026.
---
#NEAR #NEARUSDT #Crypto #PriceAction #SupportZone #DemandBlock #CryptoAnalysis #MarketStructure
$NEAR/USDT ANALYSISNEAR/USDT on the 2-hour chart is trading at 1.77 and has just broken above the descending trendline, showing the first sign of bullish strength after a long downtrend. Price is holding above the short-term moving average, and candles are trying to sustain the breakout level which is acting as fresh support. If the price remains above this trendline and the moving average continues supporting, momentum can slowly push towards higher levels, but if it fails to hold above the breakout zone then weakness may return back toward the previous lows.

NEARUSDT - Catch the Bottom!NEAR is pumping hard right now — honestly I really like its price action.
Remember the post where I explained how to enter a successful futures setup?
I’ll attach it below for you, take a look at it.
NEAR is showing the same pattern from the Ceciliones futures methodology :
-It’s a strong coin with a solid market cap.
-It formed a bearish pattern and is giving a bearish signal suggesting a drop.
-A lot of traders are hunting for the “perfect” short entry.
-Almost everyone who was long either closed or got liquidity-grabbed.
-Spot holders got hit hard and exited with losses.
This creates the perfect environment for an upside move — remember what I’m telling you.
Add it to your watchlist: the coin is currently at the bottom, fear levels are at their peak, and that’s exactly the kind of environment that fuels a bull run.
Keep your eye on NEAR — you won’t regret it.
Best Regards:
Ceciliones🎯

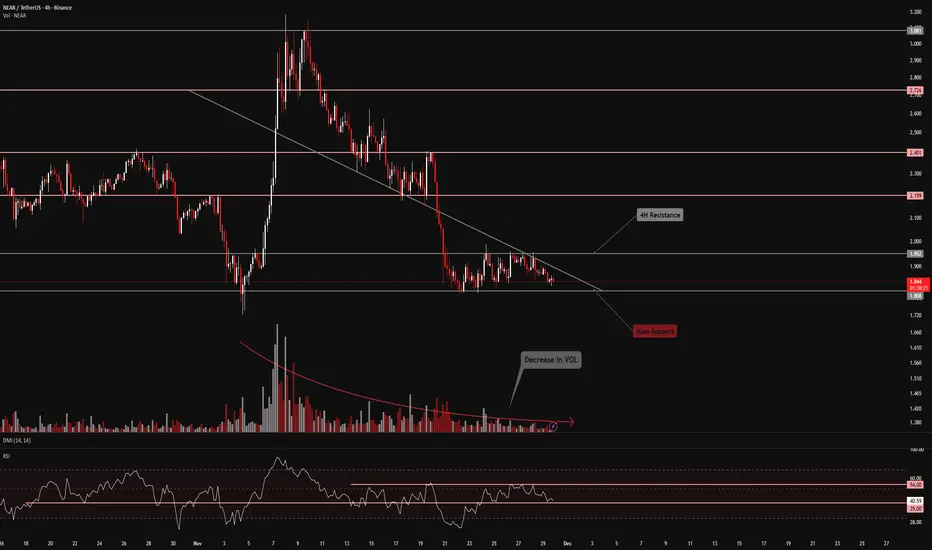
FireHoseReel | NEAR: Bulls and Bears Face Off at Key Levels🔥 Welcome to FireHoseReel !
Let’s dive into the 4H analysis of NEAR.
👀 After a sharp and powerful rally, NEAR faced a heavy rejection at the $3.081 level and entered a corrective phase.
This correction has been unusually deep and aggressive.
📉 NEAR is now sitting on a critical support at $1.808. Losing this level could activate our short trigger and open the door for further downside.
📊 NEAR’s trading volume has dropped, similar to many other coins in the market.
The first solid volume expansion will likely signal NEAR’s next directional move.
🔭 NEAR is known for making sharp moves after losing or reclaiming key support or resistance levels, which often provides excellent risk-to-reward opportunities.
✍️ Potential NEAR scenarios are outlined below.
Always make sure to use them alongside your own trading strategy.
🟢 Long Scenario:
A breakout above the major resistance at $1.952, supported by rising buy volume and an RSI break above 54, could trigger a valid long setup.
🔴 Short Scenario:
A breakdown below the critical support at $1.808, combined with increasing sell volume and RSI dropping below 39, could lead to a significant downside move.
❤️ Risk Management & Emotional Discipline
Crypto trading is highly risky. Without proper risk management and emotional control, trading becomes pure gambling.
Let logic always lead your decisions—not emotions. Trade with control and discipline.
$NEAR – Approaching a key support zoneCRYPTOCAP:NEAR has reached an important Fibonacci + structural support zone, aligning perfectly with the long-term trendline.
This area has acted as a strong demand zone multiple times in the past — making it a good DCA (dollar-cost averaging) region for long-term investors.
If price holds this level, we could see a reversal or strong bounce toward the $4.5 and $6.6 resistance zones.
Key levels to watch:
🟢 Support: $1.8 – $2.2 (Fib + Trendline zone)
🔴 Resistance: $4.5 → $6.6
Patience pays off near major confluence zones 👀

NEAR tries to breakout #NEAR / USDT
NEAR is trying to breakout resistance area with strong volume … once we got valid breakout and stability above the first R/S we go straight to next one in my chart
For the best approach Keep your eye on resistance area and monitor price action
Best of wishes

NEARUSDT Epic Breakout! Is This the Beginning of Major Bullish?After more than a year trapped in a steep downtrend, NEAR is finally showing strong signs of revival!
The latest large bullish candle has broken above the long-term descending trendline — a crucial moment that often signals the beginning of a major trend reversal in the crypto market.
This move represents a potential shift in market structure after a long period of accumulation. However, as always, the market never gives certainty — we are now at a critical turning point: is this a confirmed breakout or just a false move before another correction?
---
Structure & Technical Pattern
A descending trendline has been suppressing the price since the late 2024 peak.
The recent 2D candle breakout confirms a shift in supply-demand dynamics.
This pattern suggests that selling pressure has weakened, and buyers are starting to gain control.
The 3.00–3.40 USDT zone now acts as the key confirmation area — whether the price can hold above it will determine the next major direction.
---
Bullish Scenario (Buyers Take Over)
If NEAR manages to close and sustain above the trendline and the 3.00–3.40 zone, it could open the door for a significant bullish continuation.
Potential upside targets include:
🎯 Target 1: 3.40 (nearest resistance & breakout validation)
🎯 Target 2: 4.85 (next supply zone)
🎯 Target 3: 6.05
🎯 Target 4: 7.77–8.24 (major high zone, potential full reversal from the long bearish trend)
If a successful retest occurs around 3.00–3.10 and the price rebounds with strong volume, it would serve as a powerful confirmation of a new bullish trend forming.
---
Bearish Scenario (False Breakout & Continuation of Correction)
However, if the price fails to hold above the trendline — especially if a strong bearish reversal candle appears — this move could become a bull trap, leading to renewed selling pressure.
Key levels to watch:
⚠️ Main support: 2.20
⚠️ Major support: 1.55 (a strong demand zone tested multiple times)
A breakdown below 2.20 would confirm a new lower low structure, potentially pushing the price back toward the 1.55 USDT demand zone.
---
Strategic Conclusion
NEAR is currently at a critical transition point — between the birth of a new bullish trend or the final test of its long-term bearish phase.
Strong breakouts like this don’t happen often, and they often mark the beginning of major directional shifts.
However, confirmation is key — a strong close above the trendline with high volume will solidify the bullish case.
Aggressive traders may look for entries around the trendline retest, while conservative traders may wait for a solid close above 3.40.
---
Additional Technical Notes
Buyer momentum is surging, as the bullish candle broke through a major supply zone with conviction.
Volume confirmation is crucial: a breakout without volume could signal a false move.
Correlation with BTC/ETH matters — if Bitcoin remains bullish, NEAR’s breakout is more likely to sustain.
Indicators like RSI/MACD are likely beginning to show positive momentum — a classic sign of early-stage reversal.
---
#NEAR #NEARUSDT #CryptoBreakout #TrendReversal #CryptoAnalysis #TechnicalAnalysis #Altcoins #CryptoTrading #SupportResistance #PriceAction #BullishBreakout #TrendChange #NEARProtocol

NEAR — not so clear, but still in gear Hi everyone 👋
It’s Sunday — time to slow down a bit, recharge, and get ready for a new trading week.
As for NEAR, I believe it’s forming a sustainable uptrend, and right now we can see signs of potential continuation.
As usual, I’ve marked two possible scenarios on the chart with orange and purple arrows.
The invalidation zone is shown in red.
🎯 Local target: 2.944
❌ Plan invalidation: below 2.818
🚀 Global target: 3.20 and higher — however, for now, I’m only looking for the price to reach my local target at 2.944, since, in my view, a corrective triangle is still forming. After hitting 2.944, the price might pull back to around 2.8 before any further continuation upward.
⚠️ Disclaimer: This is not financial advice.
Trade responsibly — and never trade without stop-losses.
If you enjoy my analysis — don’t forget to like, comment, and follow so you don’t miss my next updates 💬

NEARUST - On the vergeof breakout!Keep your eyes on it — it’s about to explode very soon.
It’s currently sitting right on the trendline, and once it breaks through, that’ll give it the push it needs to break out of the accumulation zone it’s been forming for about 276 days.
The EMA is preparing for a golden cross, and yesterday’s pump indicates a massive inflow of liquidity entering the market — a clear bullish signal showing strong buying pressure
Try to get in while it’s still in the accumulation zone.
Best Regards:
Ceciliones🎯

NEAR/USDT - Swing Long | Low-Risk Setup Targeting +88%🚀 Trade Setup Details:
🕯 #NEAR/USDT 🔼 Buy | Long 🔼
⌛️ TimeFrame: 1D
--------------------
🛡 Risk Management (Example):
🛡 Based on $10,000 Balance
🛡 Loss-Limit: 1% (Conservative)
🛡 The Signal Margin: $789.89
--------------------
☄️ En1: 2.76 (Amount: $78.99)
☄️ En2: 2.638 (Amount: $276.46)
☄️ En3: 2.554 (Amount: $355.45)
☄️ En4: 2.474 (Amount: $78.99)
--------------------
☄️ If All Entries Are Activated, Then:
☄️ Average.En: 2.599 ($789.89)
--------------------
☑️ TP1: 3.079 (+18.47%) (RR:1.46)
☑️ TP2: 3.342 (+28.59%) (RR:2.26)
☑️ TP3: 3.709 (+42.71%) (RR:3.37)
☑️ TP4: 4.234 (+62.91%) (RR:4.97)
☑️ TP5: 4.901 (+88.57%) (RR:7)
☑️ TP6: Open 🔝
--------------------
❌ SL: 2.27 (-12.66%) (-$100)
--------------------
💯 Maximum.Lev: 4X
⌛️ Trading Type: Swing Trading
‼️ Signal Risk: 🙂 Low-Risk! 🙂
--------------------
🔗 www.tradingview.com
❤️ Your Like & Comments are valuable to us ❤️

NEAR/USDT – Between Bullish Reversal or Bearish Continuation?NEAR Protocol (NEAR/USDT) is currently trading at a very decisive point. The chart is showing a clear Descending Triangle pattern: sellers keep pressing the price lower with a series of lower highs, while buyers are defending a strong support zone around 2.325–2.460 (Fibonacci 0.618–0.5).
This is a make-or-break level: NEAR is either preparing for a major bullish reversal, or a breakdown that could extend the bearish trend.
---
🔹 Pattern & Structure Analysis
Main pattern: Descending Triangle (generally bearish, but a breakout above can flip the bias to bullish).
Key Support Zone: 2.325 – 2.460 (Fibo confluence).
Trendline Resistance: descending yellow line that has capped prices for months.
Key Levels to watch:
Critical Support: 2.325 – 2.460
Major Support: 1.793 (previous low)
Resistances: 2.676 → 3.010 → 3.570
Higher Resistances: 4.873 → 6.00 → 6.96 → 8.04
---
📈 Bullish Scenario
Trigger: Daily close above the descending trendline + a clear break of 2.676.
Stronger confirmation: breakout and hold above 3.010.
Upside targets:
Target 1: 3.010
Target 2: 3.570
Extended: 4.873 – 6.00
Extra signal: strong breakout volume + successful retest of broken trendline as support.
Invalidation: if price fails to hold above 2.325 after breakout.
---
📉 Bearish Scenario
Trigger: Daily close below 2.325 (Fibo 0.618).
Downside targets:
Target 1: 1.793 (previous low)
Target 2 (aggressive measured move projection): ~1.08
Extra signal: declining buy volume + strong red candle closing below support.
Invalidation: if price reclaims 2.460–2.676 after breakdown.
---
⚖️ Conclusion
NEAR is standing at a key decision zone.
A bullish breakout above the descending trendline could spark a trend reversal with potential rally toward 3.0 – 3.57.
A bearish breakdown below 2.325 would confirm bearish continuation, targeting 1.79 and potentially lower.
In short, the 2.325–2.460 zone is NEAR’s lifeline — holding above it may trigger a reversal, breaking below it could extend the downtrend.
---
📌 Notes
Always wait for daily close confirmation to avoid false breakouts.
Watch volume for breakout/breakdown validation.
Apply proper risk management (cut loss & position sizing).
#NEAR #NEARProtocol #NEARUSDT #Crypto #Altcoins #CryptoAnalysis #DescendingTriangle #SupportResistance #Fibonacci #BullishScenario #BearishScenario

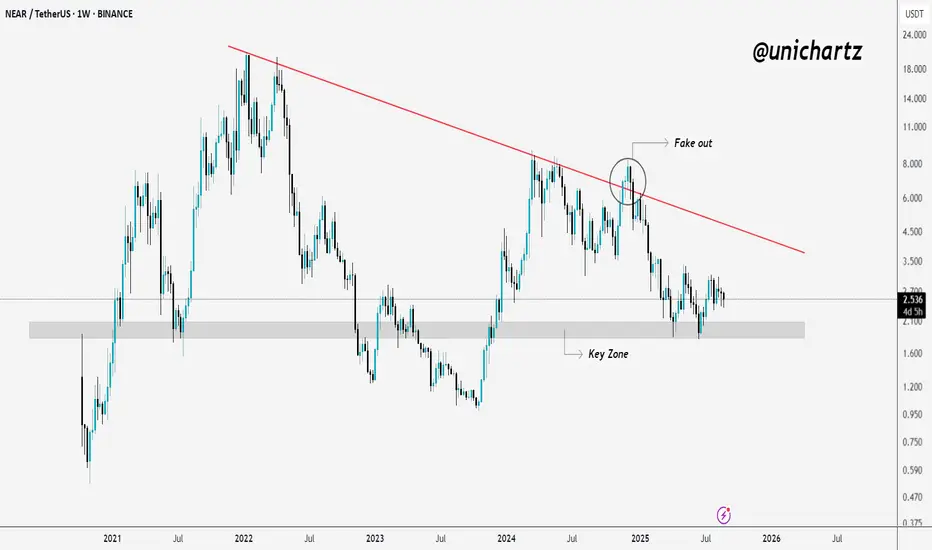
$NEAR at a Decision Point – Will This Support Crack?CBOE:NEAR remains under its long-term downtrend line, with a clear fakeout rejection near $8. Since then, it's been trending lower and is now sitting just above a key support zone that has held multiple times.
If this zone breaks, more downside is likely. But if it holds, NEAR could see a bounce or consolidation, though momentum still favors the bears for now.
DYOR, NFA
NEAR Breakout Confirmed—But Is This Just a Bull Trap?Yello Paradisers! Did you see that breakout on #NEARUSDT? After weeks of consistent lower highs and a clearly defined descending resistance, price action has finally snapped that bearish structure and completed a textbook inverse Head and Shoulders formation on the 12H chart. This kind of pattern doesn’t appear often at key cycle points, and when it does—especially with confirmation—it becomes a high-probability signal of a trend reversal.
💎#NEARUSDT ,The neckline of the inverse H&S, sitting around the $2.17–$2.23 zone, has now been broken and crucially retested as support. This means the former resistance is now acting as a probable base for bulls, and if price remains above this area, the market is likely preparing for a strong probable impulsive move to the upside.
💎The structure shows clear bullish intent, and from a technical perspective, the first resistance comes in at $2.72. A clean break above that could open the door toward the major resistance zone between $2.97 and $3.05, which would complete the projected breakout target of the H&S pattern.
💎If bulls manage to maintain control above the $2.17–$2.23 support zone, we expect price to slowly build momentum toward $2.72, with increased volatility likely once that level is tested. Should that break occur with volume, the next leg may extend rapidly into the major resistance zone. However, if price fails to hold above this flipped support zone, we will be closely watching the $2.02–$1.89 area as the last major support before invalidation.
💎A daily candle closing below $1.798 would invalidate this entire bullish thesis and put the market back into a neutral-to-bearish range.
💎Adding more probability to this setup, NEAR is now trading above multi-timeframe EMA on higher time frame. This multi-timeframe EMA alignment supports bullish continuation, as momentum begins to shift in favor of buyers. However, continuation depends heavily on how price reacts at each resistance level—especially as we enter the mid-$2.70s.
💎The probable move from here is bullish, with the expectation that NEAR pushes toward the $2.72 level in the short term, followed by a potential rally to $2.97–$3.05 if momentum sustains. This scenario remains valid as long as price holds above $2.17, and especially above $2.02. Below that, the structure weakens. Below $1.798, the bullish bias becomes fully invalidated.
This is the only way you will make it far in your crypto trading journey. Stay sharp and patient, Paradisers. It’s not about chasing pumps—it’s about positioning smartly before the crowd.
MyCryptoParadise
iFeel the success🌴

NEAR/USDT – Breakout in Progress? Watch This Zone CloselyNEAR is attempting to break out of a long-standing descending triangle. After a previous fakeout near the $2.70 zone, the price is again testing the upper trendline with strong momentum.
Chart Overview:
Price crossing the resistance of the descending structure.
Strong support held at $2.01 and $2.24 zones.
Volume is gradually increasing on breakout attempts.
RSI pushing higher, indicating building bullish momentum.
Trade Setup (on Break & Retest):
Entry: Wait for breakout and retest around $2.24–$2.28 zone
Stop Loss: Below $2.01
Targets:
Target 1: $2.44
Target 2: $2.70
Target 3: $2.97
Risk-Reward Estimate:
Approximately 2.5–3.5x RR depending on retest depth.
If NEAR reclaims $2.44 with conviction, this could trigger a sustained move toward $3+.
Watch BTC stability before entering.
DYOR | Not financial advice

NEARUSDT Breakout Watch Descending Triangle Reversal in Progress🧠 Pattern and Structure Analysis
The NEAR/USDT pair is currently displaying a long-term Descending Triangle pattern that has been developing for over 6 months. While descending triangles are typically bearish continuation patterns, a breakout to the upside often signals a strong trend reversal.
Descending resistance trendline: Multiple touchpoints confirming the structure.
Horizontal support zone: Strong base formed between $1.79 – $2.21.
The current price action shows a potential breakout above the descending resistance, indicating a possible shift in trend.
🚀 Bullish Scenario
If the breakout is confirmed (especially with high volume and daily close above the trendline), NEAR could rally toward the following resistance levels:
1. Target 1: $2.693 – minor resistance
2. Target 2: $3.021 – key psychological and technical level
3. Target 3: $3.568 – previous support/resistance flip
4. Target 4: $4.635 – major resistance zone
5. Extended Targets: $6.028 and $8.062 – historical highs
📌 Breakout confirmation requires a daily close above $2.25 with increased volume.
🐻 Bearish Scenario
If the breakout fails and the price gets rejected at the trendline:
Price may revisit the strong support zone around $1.79.
A breakdown below this support would open the door to deeper downside levels, possibly below $1.70 or even toward $1.50.
The bearish outlook would be invalidated if the price sustains above $2.30 and forms a higher-high structure.
🔍 Strategic Summary
Pattern: Descending Triangle (Potential Reversal)
Breakout Level: ~$2.25
Key Support: $1.79 – $2.21
Recommendation: Watch for a confirmed breakout with strong volume. Use a trailing stop strategy to lock in profits as targets are reached.
#NEAR #NEARUSDT #CryptoBreakout #AltcoinSeason #DescendingTriangle #TechnicalAnalysis #CryptoTrading #BullishSetup #ReversalPattern #ChartPattern

NEARUSDT 1D AnalysisNEAR ~ 1D Analysis
#NEAR Buy back on retest of this support block with short term target of at least 15%+ from here.

NEARUSDT 1D AnalysisNEAR ~ 1D Analysis
#NEAR Buy again from here if you still have confidence in this coin with a short term target of at least 10%+ and a long term target of $8

$CATUSD Breakout Setup OKX:CATUSD Breakout Setup
CATUSDT is holding above key support and an ascending trendline, showing bullish strength.
If the structure holds, a move toward 0.00025344 is possible, a potential 173% gain.
Key resistances are at 0.00013776 and 0.00018994.
It’s a volatile coin, so manage risk wisely.
DYOR, NFA.

NEARUSDT Retest in Play After Breakout — Bulls May Take Charge!BINANCE:NEARUSDT has turned the tide after a prolonged downtrend, now forming higher highs and signaling a shift in momentum. Recently, it broke through a key resistance level, flipping it into support, a classic breakout-retest setup. Right now, price action is retesting that breakout zone, and if it holds, we could see a strong bounce and continuation of the bullish structure. This level is crucial, and a successful retest could pave the way for another leg up.
As always, don’t forget to manage your risk. keep a well placed stop loss in case the market flips unexpectedly.
BINANCE:NEARUSDT Currently trading at $2.8
Buy level : Above $2.75
Stop loss : Below $2.2
Target : $5.5
Max leverage 3x
Always keep stop loss
Follow Our Tradingview Account for More Technical Analysis Updates, | Like, Share and Comment Your thoughts

NEAR Breakdown Confirmed! More Blood Before the Reversal?Yello, Paradisers! Is #NEAR about to drop even lower, or is a major reversal brewing? Let’s break it down!
💎#NEARUSDT recently suffered a descending triangle breakdown, sending prices tumbling lower. Adding to the bearish pressure, we’ve also got a death cross formation, reinforcing the weakness in price action. Right now, before NEAR can find any long-term bottom, the probability of further downside remains high.
💎The bulls are currently struggling. Multiple resistance levels are blocking any attempts to gain momentum, with all EMAs currently sloping downward—not a good sign for any immediate recovery.
💎NEAR is expected to slowly bleed into the long lower wick of February 3rd. Strong support exists between $2.65 and $2.40, a key demand zone that could trigger a bullish reversal. But if sellers continue to dominate, they could overpower this level and drive prices down further toward $2.05 - $1.95. This is a major higher time frame support zone, where a long-term reversal could finally take shape.
💎For the bulls to negate this growing pressure, they must break above $4.50—a critical level reinforced by both horizontal and descending resistance. If the price secures a bullish breakout above this, NEAR could be in a prime position to rally over the next few months.
Paradisers, as always, patience and precision are key in this market. This isn’t a time for reckless trades—let the levels guide you, trade strategically, and stay disciplined.
MyCryptoParadise
iFeel the success🌴
