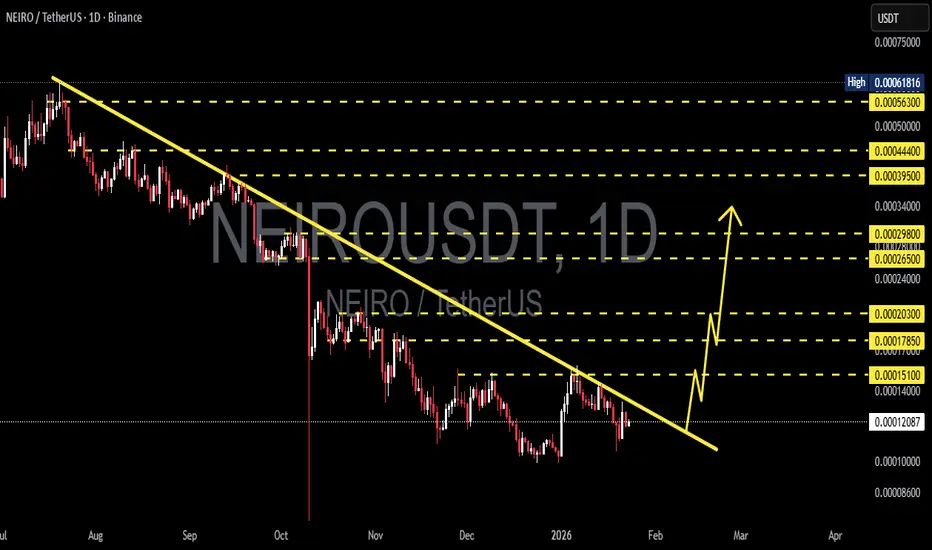
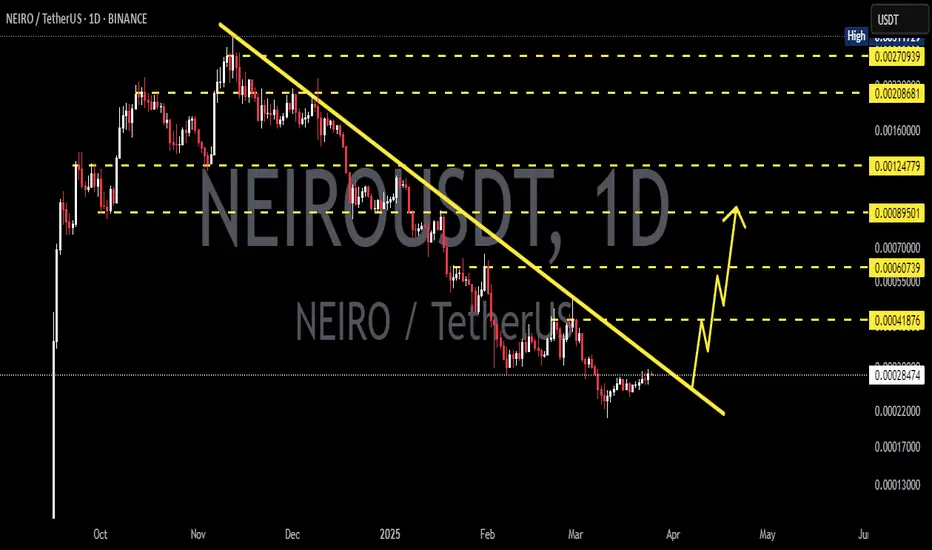
NEIRO/USDT at Critical Level – Breakout or Continue the Sell-OffNEIRO/USDT on the Daily (1D) timeframe remains in a medium- to long-term downtrend. Since the previous peak, price has consistently formed lower highs and lower lows, confirming strong bearish control. Currently, price is trading below a well-respected descending trendline, which continues to act as a major dynamic resistance.
---
Pattern Explanation
The dominant structure on the chart is a:
Descending Trendline / Bearish Market Structure
The descending trendline connects multiple lower highs.
Price has been rejected several times from this trendline, confirming it as a strong dynamic resistance.
As long as price stays below the trendline, the overall bias remains bearish.
Additional observations:
No valid trend reversal structure is present yet (no higher high).
Recent upward moves are considered pullbacks or retracements within the broader downtrend.
---
Key Levels
Major Resistance Levels:
0.00015100
0.00017850
0.00020300
0.00026500
0.00029800
0.00039500
0.00044400
0.00056300
Support Zone:
Current price area around 0.00012
A breakdown below this zone could trigger a continuation toward new lower lows.
These levels should be treated as reaction zones, not exact prices.
---
Bullish Scenario
The bullish scenario becomes valid only if clear confirmation occurs:
1. Price breaks and closes above the descending trendline on the daily timeframe.
2. A higher high and higher low structure is established.
3. Ideally, a retest of the broken trendline as support follows.
Potential bullish targets:
0.00015100
0.00017850
0.00020300
0.00026500
Without a confirmed breakout, any upward movement remains counter-trend.
---
Bearish Scenario
The bearish scenario remains the primary outlook if:
1. Price is rejected again at the descending trendline.
2. The current support zone fails to hold.
3. Price forms a new lower low.
Bearish continuation would confirm sustained selling pressure and continuation of the broader downtrend.
---
Conclusion
NEIRO/USDT is still trading within a well-defined bearish structure. The descending trendline is the key technical level that will determine the next major move.
Traders should remain patient and wait for clear breakout or breakdown confirmation before making decisions.
The trend remains bearish until proven otherwise.
#NEIRO #NEIROUSDT #CryptoAnalysis #TechnicalAnalysis #Altcoin #BearishTrend #Downtrend #Trendline #PriceAction
NEIROETHUSDT
NEIRO/USDT — Accumulation Before an Explosion or a Deeper Fall?NEIRO is currently sitting at a critical juncture that could define the next major move. The 2D timeframe structure shows a Descending Triangle pattern that’s tightening — a sign that selling pressure remains dominant, yet buyers are starting to show strong defense around the main demand area.
---
📊 Technical Overview
Primary trend: Mid-term downtrend with consecutive lower highs since early 2025.
Main Demand Zone: 0.00019 – 0.00015, a strong accumulation area that has repeatedly held against heavy selling pressure.
Descending Trendline Resistance: Pressuring the price since March, marking a key level to confirm a potential breakout.
Volume: Gradually declining throughout the pattern — often a precursor to a major volatility spike.
A long wick below the demand zone that quickly closed back inside indicates a liquidity grab — a classic signal of smart money accumulation from panic sellers before a large move unfolds.
---
🟢 Bullish Scenario
If the price successfully breaks and closes above 0.00026 with rising volume, it would invalidate the descending trendline pressure.
A confirmed breakout from this pattern could trigger a mid-term reversal, with targets at:
0.00039 (first resistance),
0.00056, and
0.00081 as extended targets.
A 2D candle close above the trendline would strongly suggest that momentum is shifting to the bulls.
Such moves are often followed by short-covering rallies and a sharp volume increase.
---
🔴 Bearish Scenario
However, if a 2D candle closes below the demand zone at 0.00015, the Descending Triangle would confirm itself as a bearish continuation pattern.
A breakdown like this could drag NEIRO further down toward the 0.00012 – 0.00009 range, or even lower if sell pressure intensifies.
This scenario would indicate a lack of strong buying interest at this level — implying that the market might seek a new structural support area below.
---
🧭 Conclusion
NEIRO is now in the final accumulation phase of a classical pattern that often precedes a major move.
The market is simply waiting for directional confirmation.
Breakout above → potential reversal and rally ahead.
Breakdown below → continuation of the bearish trend.
Be prepared for significant volatility — when a descending triangle completes, the move that follows is often sharp and decisive.
---
#NEIRO #NEIROUSDT #CryptoBreakout #DescendingTriangle #CryptoSetup #AltcoinAnalysis #MarketStructure #AccumulationPhase #SwingTradeSetup #CryptoTrading

NEIRO on Reversal Watch #NEIRO
The price is moving within a descending channel on the 1-hour frame and is expected to break and continue upward.
We have a trend to stabilize above the 100 moving average once again.
We have a downtrend on the RSI indicator that supports the upward break.
We have a support area at the lower boundary of the channel at 0.00033500, acting as a strong support from which the price can rebound.
We have a major support area in green that pushed the price upward at 0.00032700.
Entry price: 0.000352560.
First target: 0.00036600.
Second target: 0.00038073.
Third target: 0.00029830.
To manage risk, don't forget stop loss and capital management.
When you reach the first target, save some profits and then change the stop order to an entry order.
For inquiries, please comment.
Thank you.

NEIRO/USDT — Bullish Reversal Setup or Bearish Continuation?🔑 Key Takeaways
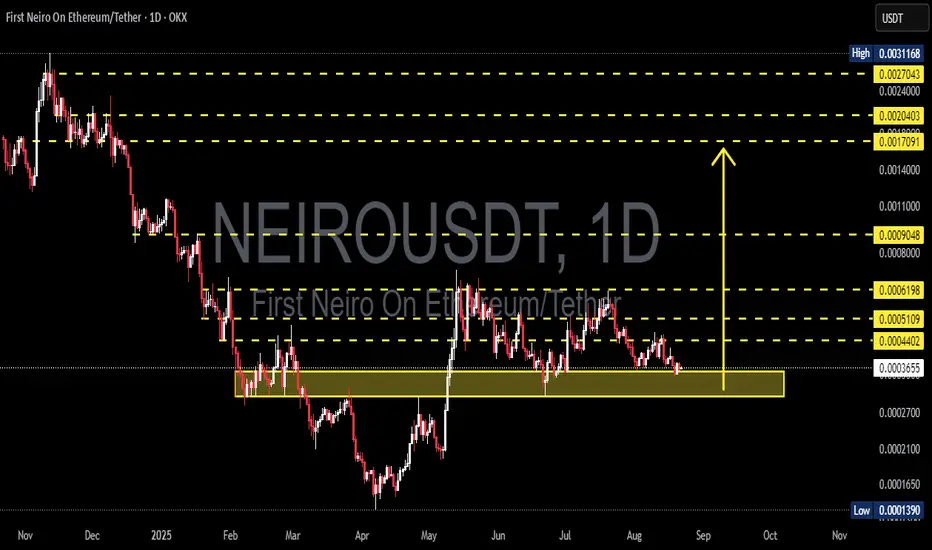
NEIRO/USDT is currently sitting at a critical demand zone between 0.00030–0.00044. This area has acted as a strong defensive level for buyers, preventing deeper declines multiple times in recent months.
While the macro trend remains bearish, the recent structure shows a consolidation phase (sideways range), which could either become a base for a relief rally or a continuation pattern for another leg down.
The market stands at a crossroad: Will buyers push for a breakout, or will sellers take control with a breakdown?
---
📌 Key Technical Levels
Demand Zone (Main Support): 0.00030 – 0.00044
Additional supports (if breakdown occurs): 0.00022 and 0.00013
Key Resistance Levels (bullish targets):
R1: 0.00061749
R2: 0.00090443
R3: 0.00126321
R4: 0.00208555
R5: 0.00273117
R6: 0.00311729 (major swing high)
---
📉 Chart Structure & Pattern
The broader downtrend remains visible (lower highs & lower lows).
A sharp rebound in May 2025 indicates a possible liquidity sweep.
Current price action shows range-bound consolidation around the yellow demand box.
This setup resembles an accumulation base: strong demand could trigger a rally.
Failure to hold this zone would confirm a bearish continuation toward lower supports.
---
🚀 Bullish Scenario
1. Breakout confirmation: Daily close above 0.00044182 with strong volume.
2. Upside targets:
Target 1: 0.00061749
Target 2: 0.00090443
Target 3: 0.00126321
Extended targets (if momentum builds): 0.00208555 – 0.00273117
3. This zone could serve as the foundation for a strong relief rally if buyers step in.
4. Risk-to-reward is favorable: entries near support offer high potential upside vs. limited downside.
---
🐻 Bearish Scenario
1. Breakdown confirmation: Daily close below 0.00030.
2. This would invalidate the demand zone → buyers lose control.
3. Downside targets:
Target 1: 0.00022
Target 2: 0.00013
4. Breakdown could trigger panic selling or a capitulation move.
---
📝 Trading Approach
Conservative traders: Wait for daily close confirmation (breakout or breakdown).
Aggressive traders: Consider entries inside the demand zone (0.00036–0.00040) with tight stops below 0.000295.
Take profit gradually at key resistance levels to lock gains.
Always check volume and momentum indicators (RSI, MACD) for confirmation.
---
⚠️ Risk Note
Crypto markets are highly volatile — never go all-in.
This analysis is for educational purposes only, not financial advice.
Always apply stop-loss and proper risk management.
---
✨ Conclusion
NEIRO/USDT is currently trading at its most critical demand zone.
If it holds, buyers may fuel a significant rebound toward 0.00061749 → 0.00090443 → 0.00126321.
If it fails, a breakdown toward 0.00022 and 0.00013 becomes highly likely.
The market is at a major decision point: will this demand zone serve as the foundation for a bullish reversal, or will it lead to the next bearish leg down?
#NEIRO #NEIROUSDT #AltcoinAnalysis #CryptoTrading #SupportResistance #DemandZone #Breakout #BearishOrBullish #PriceAction #CryptoChart

NEIRO/USDT — Accumulation Before Rally or Breakdown?✨ Overview:
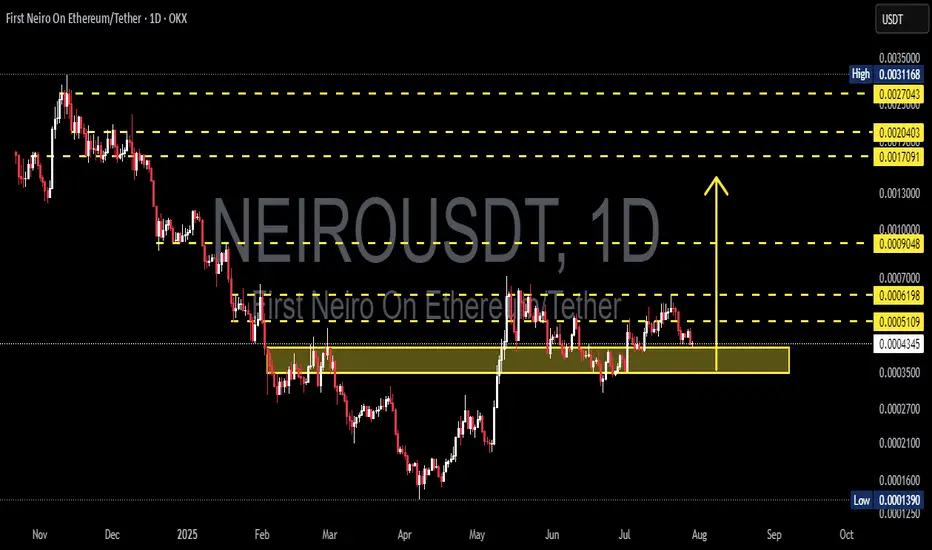
NEIRO is now at a make-or-break level. Price has once again tested the daily demand zone (0.00033–0.00038), the same area that fueled the strong rally back in May. This zone acts as the last line of defense for buyers to hold the structure and prevent deeper downside.
At the same time, the chart is shaping a descending triangle pattern — consistent lower highs pressing down into a flat support zone. This signals compression and building pressure, ready to explode either upward (bullish breakout) or downward (bearish breakdown).
---
🟢 Bullish Scenario
1. A positive reaction from demand with a D1 close above 0.00040 could spark a recovery.
2. Stronger confirmation comes with a break above 0.0004402, opening the path to higher resistances:
🎯 Target 1: 0.0005109
🎯 Target 2: 0.0006198
🎯 Target 3: 0.0009048 (major supply retest)
3. If buyers can maintain a higher low above 0.00036–0.00038, momentum shift toward reversal is likely.
---
🔴 Bearish Scenario
1. A daily close below 0.00033 confirms a breakdown, turning the demand zone into fresh supply.
2. Downside targets then extend to:
⚠️ Target 1: 0.0002700
⚠️ Target 2: 0.0001650
⚠️ Final Extension: 0.0001390 (the chart’s marked low).
3. This would reinforce the broader bearish trend that has dominated since the January 2025 peak.
---
📌 Pattern & Context
Descending Triangle: lower highs compressing toward flat support — a typical breakout setup.
Demand Zone: the yellow block is a historical base that once fueled a rally; now it’s the battleground.
Momentum: the longer price compresses here, the stronger the breakout reaction is expected.
---
📖 Trading Plan Summary
Bullish Play: look for entries near support with stop below 0.00033 → targets 0.00044 / 0.00051 / 0.00062.
Bearish Play: wait for D1 close below 0.00033 → sell on retest → targets 0.00027 / 0.000165.
Key: The 0.00033–0.00038 demand zone is the ultimate decision point.
#NEIROUSDT #Altcoin #CryptoAnalysis #DemandZone #DescendingTriangle #PriceAction #SupportResistance
NEIROUSDT: Critical Support Zone – Rebound or Breakdown Ahead?🔍 Price Structure & Pattern Formation
On the daily chart, NEIROUSDT is currently testing a major demand zone (highlighted in yellow) between 0.0004337 – 0.0003500 USDT. This area previously acted as a strong accumulation zone back in May and is now being retested as key support.
Price has entered a consolidation range after a short-term rally from April to May 2025.
Strong Support: 0.0004337 – 0.0003500
Nearest Resistance Levels: 0.0005109, 0.0006198
---
📈 Bullish Scenario
If the price holds above the demand zone and forms a valid bullish reversal pattern (e.g., bullish engulfing, pin bar), then a bullish move could follow.
Upside Targets (Resistance Levels):
1. 0.0005109
2. 0.0006198
3. 0.0009048
4. 0.0017091 (extended target)
5. 0.0020403
6. 0.0027043 (mid/long-term target)
Bullish Confirmation:
Daily close above 0.0006198
Increasing volume on bounce
Bullish candlestick formation in demand zone
---
📉 Bearish Scenario
If the price breaks below 0.0004337 and closes the day under it, it would indicate further downside potential.
Downside Targets (Support Levels):
1. 0.0003500 (bottom of demand zone)
2. 0.0002700
3. 0.0001600
4. 0.0001390 (previous major low)
Bearish Confirmation:
Strong daily close below 0.0004337
Retest of the zone fails as resistance
Bearish volume spikes
---
📐 Price Patterns
Potential Double Bottom: A bounce from this zone may form a double bottom pattern, with the neckline near 0.0006198.
Sideways Range / Accumulation: Price action since June indicates potential accumulation if the support holds.
---
🔑 Conclusion
NEIROUSDT is at a critical juncture — waiting for confirmation whether it will bounce from this strong demand zone or break down to continue the bearish trend. Key resistance and support levels are well-defined, providing clear strategies for breakout or rebound traders.
---
📌 Trading Suggestions
Aggressive Longs: Look for bullish signals inside the demand zone (0.00043 – 0.00035)
Conservative Longs: Wait for a breakout above 0.0006198 for trend reversal confirmation
Shorts: Enter if there's a confirmed breakdown below 0.0004337
#NEIROUSDT #CryptoAnalysis #TradingView #AltcoinWatch #SupportResistance #TechnicalAnalysis #BullishSetup #BearishScenario #CryptoTA #ChartUpdate #PriceAction
NEIROETH Breakout Loading!$NEIROETH is currently consolidating within a symmetrical triangle pattern on the daily chart, suggesting a potential breakout in either direction. The price action has respected this pattern for several weeks, gradually forming higher lows and lower highs. Notably, both the 100 EMA and 200 EMA are acting as dynamic support, reinforcing the bullish structure. A confirmed breakout above the upper trendline could open the door for a strong move toward the $0.21 level, offering significant upside potential.
NLong

NEIRO/USDT On the Edge of a Breakout
🔍 Full Technical Analysis (1D Timeframe)
NEIRO/USDT is currently in a highly critical and potentially explosive phase. After a strong downtrend that began in late 2024, the price has entered a structured Falling Channel (Downward Parallel Channel) that has lasted for over 2 months.
This pattern often represents a quiet accumulation phase, where smart money prepares for the next big move — and right now, all eyes are on a potential bullish breakout.
🧩 Market Structure & Chart Pattern
📐 Falling Channel
Parallel support and resistance lines sloping downward.
Price has tested the upper boundary multiple times, building pressure toward a breakout.
🔍 Volume Analysis
Volume is decreasing as price nears the end of the channel — a classic sign of an impending breakout.
⚠️ Breakout Watch
A breakout above the upper channel resistance (~0.00045 USDT) could lead to a multi-phase rally.
📈 Bullish Scenario (Breakout Confirmation)
If the price breaks above the upper boundary and confirms the breakout with strong volume, the following targets come into play:
1. 🔹 First Target:
0.00052438 USDT – The initial horizontal resistance.
2. 🔹 Second Target:
0.00061749 USDT – A previously broken support, likely to be retested.
3. 🔹 Major Target:
0.00090443 USDT – A strong resistance zone from a past distribution range.
4. 🎯 High Target Zone:
0.00273117 – 0.00311729 USDT – A historical supply zone and possible long-term target.
> ✅ Confirmation Needed: Valid breakout must be accompanied by strong volume, a daily candle close above the channel, and preferably a successful retest of the breakout level.
📉 Bearish Scenario (Failed Breakout / Rejection)
If the breakout fails and price gets rejected:
Price may fall back to the lower channel support near 0.00035 – 0.00037 USDT.
A breakdown below this range could push price toward:
0.00027 USDT
0.00013878 USDT (key historical support and cycle low)
This would indicate that accumulation is not yet complete and sellers still control the market.
📊 Strategic Summary
> NEIRO is approaching the end of a well-defined falling channel, setting up for a potential bullish breakout. If successful, the structure of the market provides multiple levels for profit-taking. However, validation through breakout confirmation and risk management is essential.
⏳ Watch daily candle closes and volume closely!
📌 Trading Plan Summary
✅ Buy on breakout and retest of channel resistance
🛑 Stop loss: Below invalidation levels or channel support
🎯 Targets: 0.000524 – 0.000617 – 0.000904 – 0.0027+
#NEIROUSDT #NEIRO #CryptoBreakout #AltcoinSetup #FallingChannel #BullishPattern #CryptoTechnicalAnalysis #BreakoutTrade #Altseason2025

NEIROUSDT 1D AnalysisNEIRO ~ 1D Analysis
#NEIRO This trade is very high risk
Buy after successfully breaking through this resistance line with large volume, minimum target 15%++

NEIRO on Reversal Watch – Waiting for ConfirmationBought a bit here, but the main trigger is above the Monthly Open and the block it's currently sitting on.
Structure still leans bearish on the daily and higher timeframes, so I'd prefer a strong S/R flip at a key level rather than blindly expecting a market structure shift.
With ETH holding well and sitting near its previous ATL vs BTC, this could open the door for NEIRO and similar names to perform. Just look at how EURONEXT:AAVE , CRYPTOCAP_OLD:ETHFI , MIL:ENA , and $EIGEN are moving today.
NLong

NEIROETH/USDT – Double Bottom Breakout Targeting Higher LevelsHello guys!
Did you buy and hold it?
Let's see if there is another area to buy it or not!
NEIROETH/USDT has formed a double bottom pattern, leading to a sharp 357% rally. The breakout signals a strong bullish reversal, with a target around $0.10232. There’s a possible retest zone at $0.03600–$0.04200 where buyers might step in again. The RSI shows overbought conditions, suggesting a potential short-term pullback, but overall momentum remains bullish.
______________________
Key Points:
Pattern: Double Bottom
Immediate Support: $0.03600–$0.04200 (retest zone)
Pattern Target: $0.10232
Momentum: Strong bullish with overbought RSI warning
Risk: Watch for possible pullbacks but overall trend favors bulls.
NLong

NeiroETH — Strong Rebound Zone Hit. Big Move Loading?We just tapped into a major demand zone at 0.01532–0.01607, and the reaction was immediate — strong bounce straight off the level.
From here, I’m looking for at least a recovery into the mid-range of the descending channel, with potential for much more.
Main target — a breakout above the local ATH at 0.01993.
More thoughts in my profile @93balaclava
Personally I trade on a platform that offers low fees and strong execution. DM me if you're curious.
NLong

#NEIROETHUSDT maintains bearish momentum❗️Keep an eye on the BYBIT:NEIROETHUSDT.P — the structure suggests a possible local rebound or a breakout of the wedge to the upside. Opening a short here goes against the structure and lacks confirmation
📉 SHORT BYBIT:NEIROETHUSDT.P from $0.01612
🛡 Stop loss $0.01693
🕒 Timeframe: 1H
✅ Overview:
➡️ The chart shows BYBIT:NEIROETHUSDT.P forming a bearish continuation move after breaking out of a consolidation range.
➡️ Entry at $0.01612 corresponds to a retest of former support turned resistance.
➡️ Selling volume is increasing, supporting bearish pressure.
➡️ The POC level at $0.02084 remains far above the current price, highlighting downward imbalance.
🎯 TP Targets:
💎 TP 1: $0.01586
💎 TP 2: $0.01535
💎 TP 3: $0.01500
📢 Additional scenario notes:
📢 A false breakout above the entry zone is possible — wait for confirmation of the $0.01620 break.
📢 Watch for volume spikes near TP1 and TP2 — could signal partial take profits.
📢 If price reclaims $0.01693, the setup becomes invalid.
🚀 BYBIT:NEIROETHUSDT.P maintains bearish momentum — downside move expected!
NShort

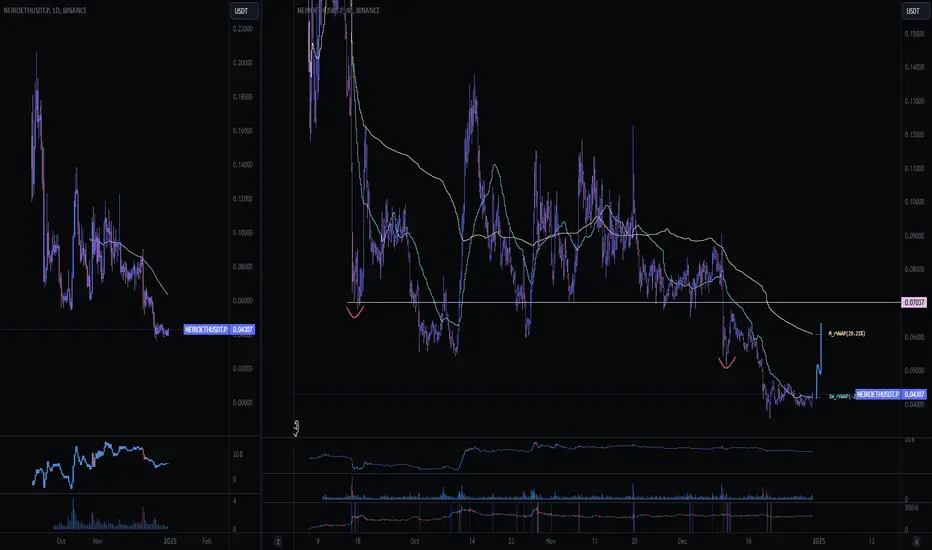
NEIROETH ANALYSIS (12H)It appears that the NEIROETH diametric pattern started from the point where we placed the green arrow on the chart and completed at the point where we placed the red arrow.
Since the bullish pattern has ended and the price is below the descending trendline, sell/short opportunities can be considered in the supply zones.
The target could be the green zone.
Closing a daily candle above the invalidation level will invalidate this analysis.
For risk management, please don't forget stop loss and capital management
When we reach the first target, save some profit and then change the stop to entry
Comment if you have any questions
Thank You
NShort

NEIROETH Looks Bullish (4H)The correction of NEIROETH started from the point where we placed the red arrow on the chart.
This correction appears to be a diametric pattern, and we are currently in wave f.
Wave g could complete in the green zone, leading to the start of a bullish wave.
The closure of a daily candle below the invalidation level will invalidate this analysis.
For risk management, please don't forget stop loss and capital management
When we reach the first target, save some profit and then change the stop to entry
Comment if you have any questions
Thank You
N

NEIROUSDT 1DNEIRO ~ 1D Analysis
#NEIRO Trading is very high risk. Buy after successfully penetrating this resistant line with a short -term target of at least 10%+.
#NEIRO/USDT#NEIRO
The price is moving in a descending channel on the 1-hour frame and is adhering to it well and is heading to break it upwards strongly and retest it
We have a bounce from the lower limit of the descending channel, this support is at a price of 0.00037460
We have a downtrend on the RSI indicator that is about to break and retest, which supports the rise
We have a trend to stabilize above the moving average 100
Entry price 0.00038150
First target 0.00039430
Second target 0.00040680
Third target 0.0004296

NEIROUSDT 1DNEIRO ~ 1D Analysis
#NEIRO This trade is very high risk. But if you still have a Conviction on this coin. Buy after successfully penetrating this resistant line, with a short -term target of at least 15%+

NEIROUSDT 1DNEIRO ~ 1D
#NEIRO If you still have Conviction on this coin,. Buy gradually on this support block,. with a minimum target of 15%++

NEIROUSDT 1DNEIRO ~ 1D
#NEIRO This is a very important support block for this meme coin,.if you still have Conviction on this coin,. Buy in stages from here. with a short term target of at least 20%+

$NEIROETH - Scalp Long SetupOver the past week, NEIROETH has experienced a significant drop of about -83% decrease over the month.
NEIROETH appears to be at a level where we could see a potential bounce.
If we can hold .040 (weekly_rvwap) , there's a chance we retest the nearest swing point at .052 or even tag (m_rvwap) at .060
We can long at current market price and leave something for DCA if we dip around .040 to .038 area
Setting stoploss below the low at .035
Targets:
.052 (swing point)
.060 (m_rvwap)
.72
N
NEIRO on Fire! All-Time Highs Ahead !!BINANCE:NEIROUSDT has broken a key resistance level with strong volume, signaling a potential big move upward. All-time highs are within reach. Look for pullbacks or confirmation, and always use a stop loss to manage risk. This breakout could lead to major gains!
BINANCE:NEIROUSDT Currently trading at $0.0022
Buy level: Above $0.00215
Stop loss: Below $0.00177
Target : $0.006
Max Leverage 3x
Always keep Stop loss
Follow Our Tradingview Account for More Technical Analysis Updates, | Like, Share and Comment Your thoughts

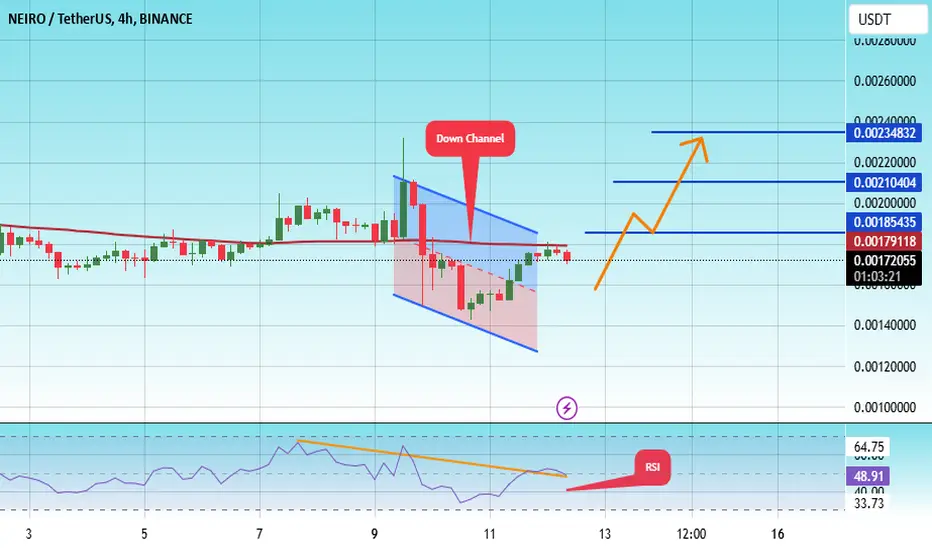
#NEIRO/USDT Ready to go higher#NEIRO
The price is moving in a descending channel on the 4-hour frame and sticking to it well
We have a bounce from the lower limit of the descending channel, this support is at 0.001570
We have a downtrend on the RSI indicator that is about to break, which supports the rise
We have a trend to stabilize above the moving average 100
Entry price 0.001582
First target 0.001854
Second target 0.002348
Third target 0.002348