#NEO/USDT is back at its historical demand zone!#NEO
The price is moving within a descending channel on the hourly timeframe. It has reached the lower boundary and is heading towards a breakout, with a retest of the upper boundary expected.
The Relative Strength Index (RSI) is showing a downward trend, approaching the lower boundary, and an upward bounce is anticipated.
There is a key support zone in green at 3.60. The price has bounced from this level several times and is expected to bounce again.
The indicator is showing a trend towards consolidation above the 100-period moving average, which we are approaching, supporting the upward move.
Entry Price: 3.68
First Target: 3.75
Second Target: 3.84
Third Target: 3.95
Stop Loss: Below the green support zone.
Don't forget one simple thing: Money Management.
For any questions, please leave a comment.
Thank you.
NEO

#NEO is back at its historical demand zone!#NEO
The price is moving within a descending channel on the 1-hour frame, adhering well to it, and is on its way to breaking it strongly upwards and retesting it.
We have a bounce from the lower boundary of the descending channel, this support at 5.45.
We have a downtrend on the RSI indicator that is about to be broken and retested, supporting the upside.
There is a major support area in green at 5.30, which represents a strong basis for the upside.
Don't forget a simple thing: ease and capital.
When you reach the first target, save some money and then change your stop-loss order to an entry order.
For inquiries, please leave a comment.
We have a trend to hold above the 100 Moving Average.
Entry price: 5.55
First target: 5.63
Second target: 5.73
Third target: 5.86
Don't forget a simple thing: ease and capital.
When you reach your first target, save some money and then change your stop-loss order to an entry order.
For inquiries, please leave a comment.
Thank you.

NEO: the market wakes up and hints at a bullish reversalNeoGenomics is breaking out of a mid-term descending wedge while forming a clear trend reversal structure with higher lows and steady support above key Fibonacci retracement levels. The 10.00–10.80 area acts as a consolidation range before a potential continuation of the upward move.
The price has already broken the descending trendline, retested it, and is now holding above the 0.705 Fibonacci zone. EMA 20/50/100 are shifting toward a bullish alignment, confirming renewed buying pressure. Volume is increasing — a classic behavior after a prolonged decline. If the structure holds, the next bullish impulse may form right after breaking the 10.80 resistance.
Fundamentally, NeoGenomics is recovering after a sector-wide selloff in biotech. The company continues to strengthen revenue growth, improve its diagnostics portfolio, and reduce financial pressure — factors that often precede medium-term trend reversals in this sector.
Tactical plan: consider long positions after a confirmed breakout above 10.80. Targets: 15.00 (primary supply zone) and 19.20 as an extended target at the upper boundary of the previous long-term structure. Invalidation: breakdown below 9.00.
If the bullish impulse confirms, the move to 15 and beyond may unfold much faster than the market currently expects.

Chinese Ethereum As much as I’m digging the belief that we actually never had 4 years cycle in altcoins getting stronger, if feels like a cool off years after 2017 cycle for old Altcoins specifically, now if you observe Neo you obviously can’t find a discipline or repetitive action. Or you see manipulation or hold off . Price playing at March 2020 level , in a huge channel on a strong historical support, I honestly can’t believe we won’t hold this support, if we start climbing we’ll sit in ATH by mid 2026 fingers crossed, DYOR .

20X opportunity NEO / USDT Long-Term Accumulation Zone (1M)📈 NEO / USDT – Long-Term Accumulation Zone (1M)
NEO is currently trading at a strong historical demand zone between 4.5 – 5.5 USD, a level that has acted as major support multiple times since 2019.
From a long-term perspective, this zone represents a key accumulation area, and if price holds above it, we could see a potential macro reversal in the coming months or years.
🎯 Major Targets:
$20 – First resistance / mid-range zone
$55 – Secondary target (2021 supply zone)
$100+ – Long-term target if the macro trend shifts bullish
🛑 Invalidation (Stop Loss): Monthly close below $4.0
I expect the price to rise from this multi-year support after studying market structure and historical cycles. The setup looks promising for investors focusing on long-term positions rather than short-term trades.
📘 This is not financial advice — only a personal analysis based on market behavior and historical data.

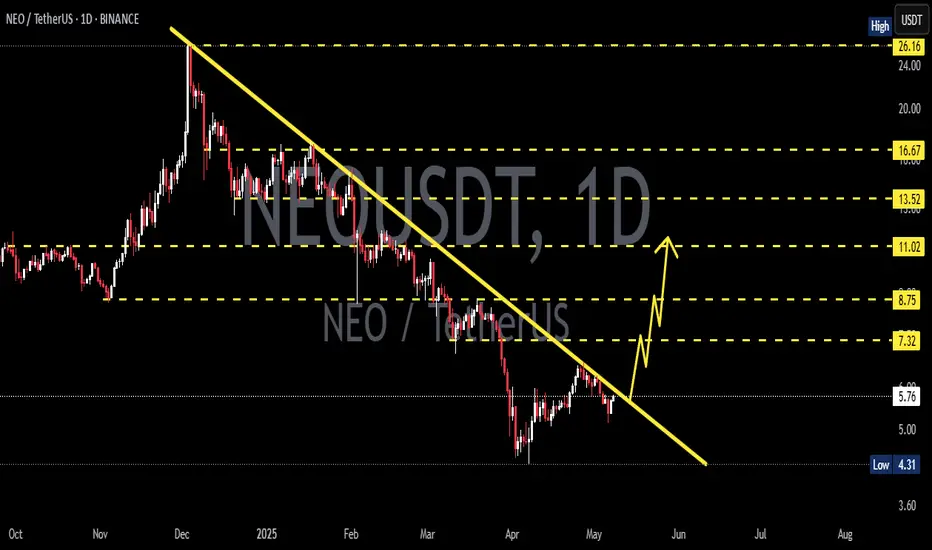
NEO / USDT – Bullish Breakout Setup (4H)Price has successfully broken above the descending trendline and is now holding near the 0.382 Fibonacci level at 5.84.
If momentum continues, a move toward the 0.5 and 0.618 retracement levels looks likely, confirming a potential short-term trend reversal.
🎯 Targets:
6.32
6.80
7.48
maybe to 26$ if we are lucky this year but that's
Based on market structure and the Fibonacci retracement zones, I expect further bullish continuation after this breakout and retest.
📘 This analysis is based on personal market study and structure observation – DYOR / Not financial advice.

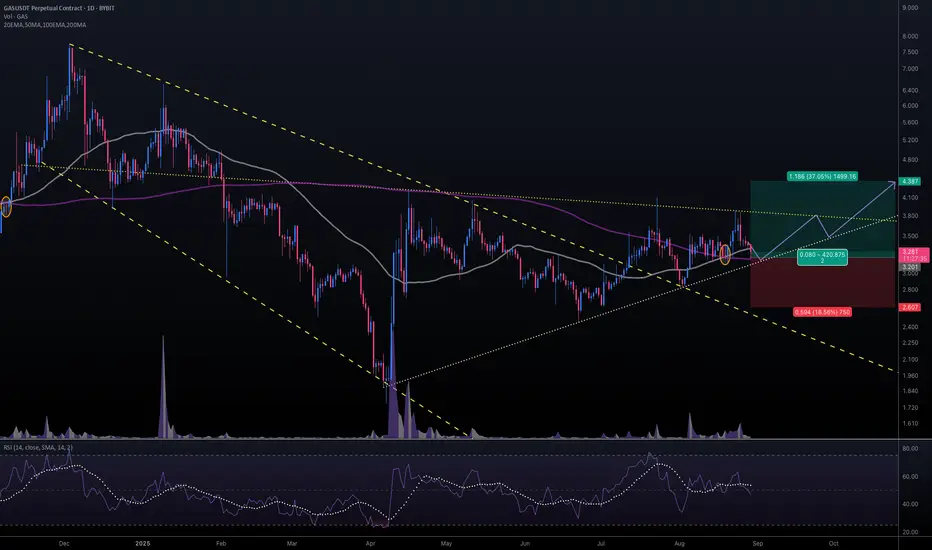
#GASUSDT #1D (ByBit) Falling broadening wedge breakout & retestNeoGas printed a golden cross on daily and a morning star at the same time, just like last year.
Also formed a triangle, seems likely to bounce on 200MA support then break bullish in the coming weeks.
⚡️⚡️ #GAS/USDT ⚡️⚡️
Exchanges: ByBit USDT
Signal Type: Regular (Long)
Leverage: Isolated (2.0X)
Amount: 5.4%
Current Price:
3.281
Entry Targets:
1) 3.201
Take-Profit Targets:
1) 4.387
Stop Targets:
1) 2.607
Published By: @Zblaba
HOSE:GAS BYBIT:GASUSDT.P #1D #NeoGas #dBFT neo.org
Risk/Reward= 1:2.0
Expected Profit= +74.1%
Possible Loss= -37.1%
Estimated Gaintime= 1-2 months
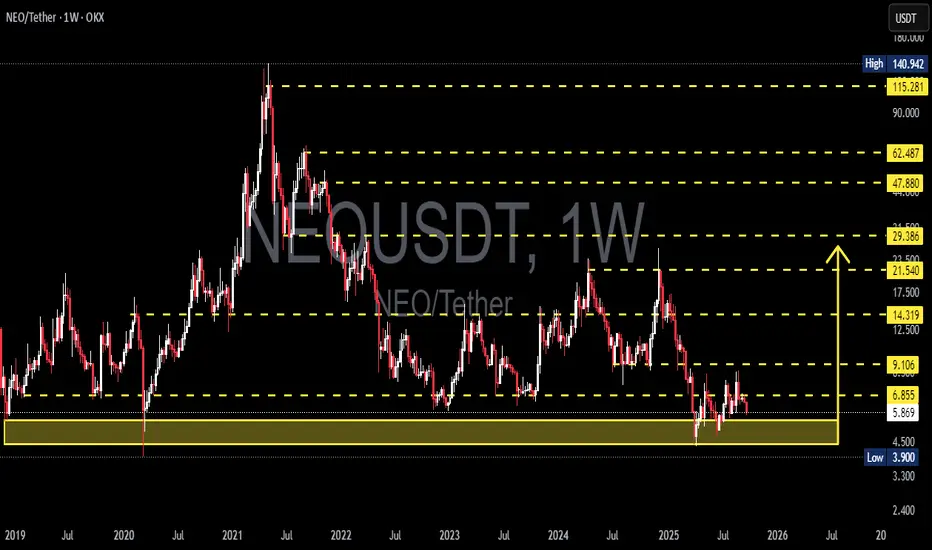
NEO/USDT — Multi-Year Decision Zone: Reversal or Breakdown?📊 Overview
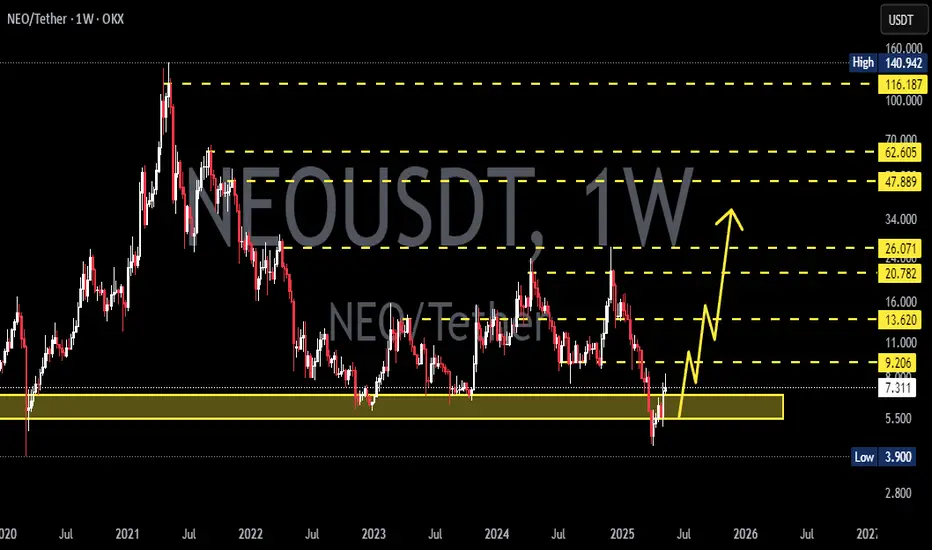
The NEO/USDT (Weekly, OKX) pair is currently sitting at a critical junction that could define its long-term direction. Since the 2021 peak, NEO has been in a macro downtrend, but once again it is testing the historical demand zone at 3.90 – 5.85 USDT (yellow box).
This zone isn’t just a minor support — it’s a multi-year structural level that has repeatedly acted as a floor since 2019.
---
🔍 Structure & Price Pattern
1. Macro Trend:
From the ATH ≈140 USDT (2021), price has consistently formed lower highs and lower lows.
Trend remains bearish, but extended consolidation at the lows suggests possible accumulation.
2. Key Levels:
Strong Support: 3.90 – 5.85 (multi-year demand).
Immediate Resistance: 6.855 USDT.
Next Resistance Levels: 9.106 → 14.319 → 21.540 → 29.386.
Psychological Long-Term Levels: 47.880, 62.487, 115.281, and ATH at 140.942.
3. Potential Patterns:
Holding above the yellow box + breakout over 6.855 could trigger a base breakout / double bottom reversal.
A breakdown below 3.90, however, would confirm a bearish continuation with significant downside risk.
---
🟢 Bullish Scenario
1. Early Confirmation:
Weekly close above 6.855 USDT.
2. Upside Targets:
Target 1: 9.106 USDT.
Target 2: 14.319 USDT.
Target 3: 21.540 USDT (macro structure begins shifting bullish if broken).
3. Supporting Signals:
Strong breakout volume.
RSI reclaiming > 50.
Bullish weekly candlestick closes near the highs.
---
🔴 Bearish Scenario
1. Early Confirmation:
Weekly close below 3.90 USDT.
2. Implications:
Loss of multi-year demand zone.
Opens the door for deeper downside with no clear structural support below.
3. Supporting Signals:
Lower highs failing near 6.855.
RSI staying below 50.
Weak volume on rallies, strong volume on sell-offs.
---
🎯 Conclusion & Sentiment
The 3.90 – 5.85 USDT zone = “Last Defense Zone” for NEO.
Holding this level could spark a long-term reversal toward 9 – 14 USDT.
Breaking below would signal a continuation of the multi-year downtrend with significant downside risk.
At this moment, NEO stands at a crossroad:
➡️ Will it be the start of a new bullish cycle after years of consolidation?
⬅️ Or will it break down its last major support and extend the bearish cycle further?
---
🔑 Notes for Traders
Always wait for weekly close confirmation to avoid bull/bear traps.
Watch the reaction at 3.90 – 5.85 USDT, as it’s critical for both swing traders and long-term investors.
Apply strict risk management (SL/TP), as volatility in this zone can be very high.
---
#NEO #NEOUSDT #NEOAnalysis #Altcoins #CryptoTrading #SwingTrade #SupportResistance #TechnicalAnalysis #CryptoMarket
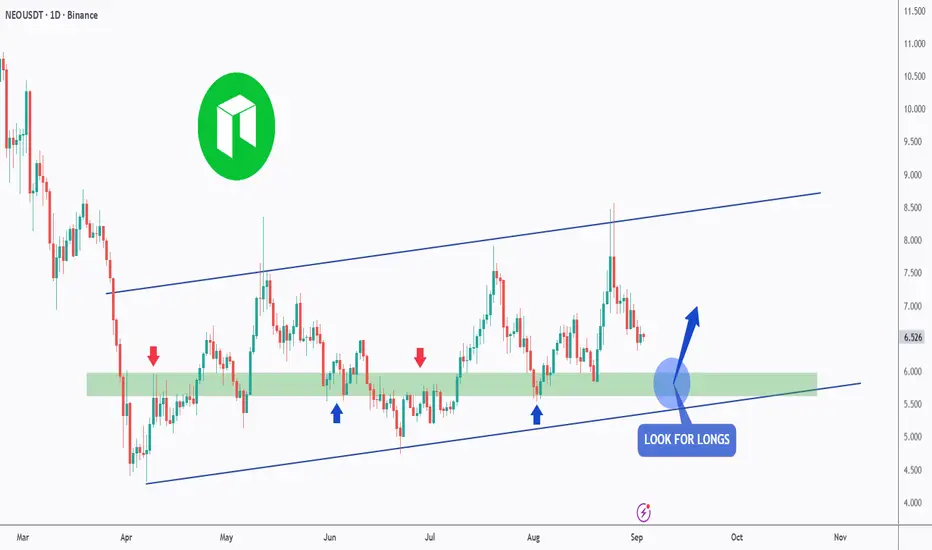
NEO - Will the Bulls take over?Hello TradingView Family / Fellow Traders. This is Richard, also known as theSignalyst.
📈NEO has been overall bullish trading within the flat rising channel marked in blue.
This week, NEO has been retesting the lower bound of the channel.
Moreover, the green zone is a strong support and structure.
🏹 Thus, the highlighted blue circle is a strong area to look for buy setups as it is the intersection of the lower blue trendline and green support.
📚 As per my trading style:
As #NEO approaches the blue circle zone, I will be looking for trend-following bullish reversal setups (like a double bottom pattern, trendline break , and so on...)
📚 Always follow your trading plan regarding entry, risk management, and trade management.
Good luck!
All Strategies Are Good; If Managed Properly!
~Richard Nasr
NEOUSDT Forming Bullish MomentumNEOUSDT has recently broken out of a consolidation structure, showing strong bullish momentum as it pushes higher with increasing trading volume. The current price action indicates that buyers are stepping in aggressively, reflecting renewed market confidence in this crypto pair. With the breakout supported by healthy liquidity, the probability of continuation towards higher levels looks favorable in the coming days.
This setup suggests that NEO could be entering a sustainable bullish phase, with short-term upside targets pointing towards a 30% to 40% potential gain from current levels. Historically, NEO has shown sharp moves once key resistance levels are cleared, and the recent price structure highlights that same momentum could be building again.
Investors are paying close attention as this project has maintained steady development and utility, which further supports market sentiment. If buyers continue to dominate, NEO has the potential to extend towards higher resistance levels and provide strong returns for both short-term traders and long-term holders.
✅ Show your support by hitting the like button and
✅ Leaving a comment below! (What is You opinion about this Coin)
Your feedback and engagement keep me inspired to share more insightful market analysis with you!
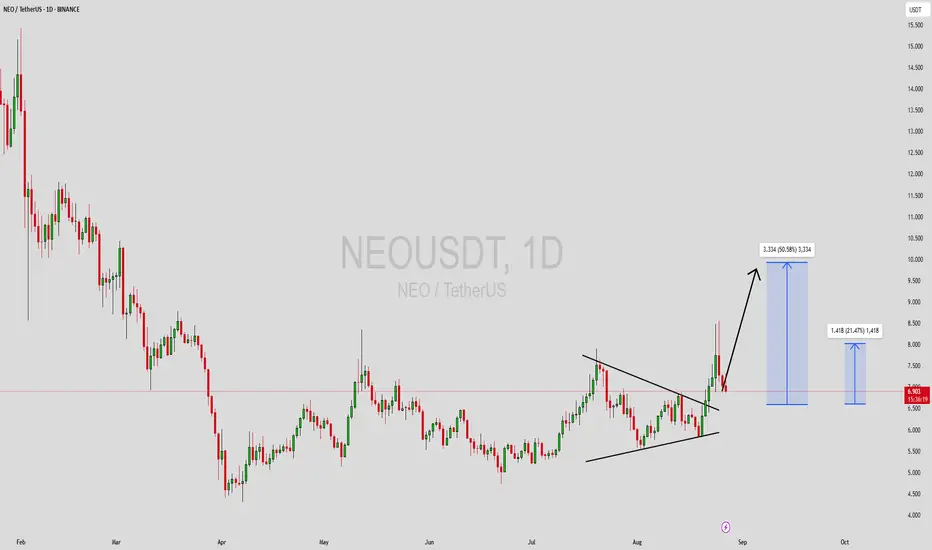
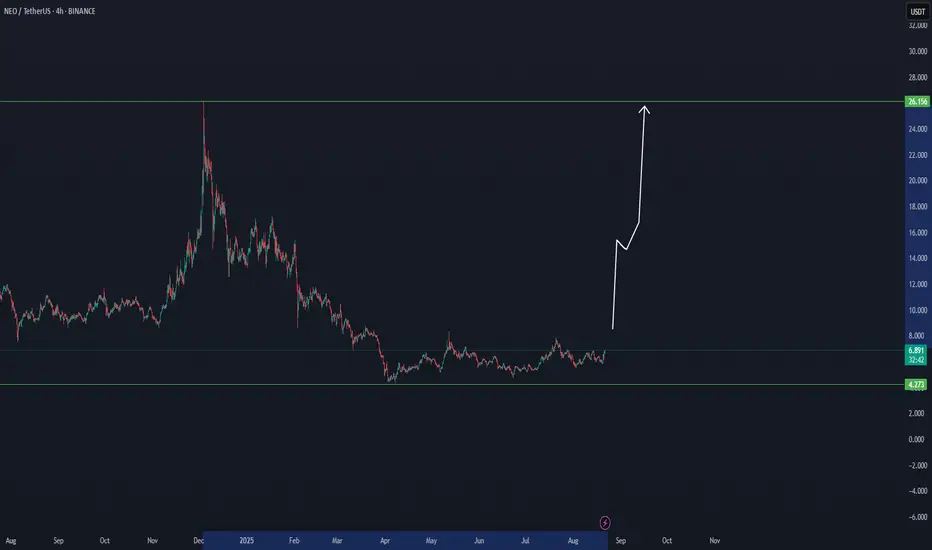
THE NEO CYCLE CAN BREAK TO $12-$26 N3 Blockchain comingThe NEO cycle is starting to confirm in this zone, but we are waiting for a second confirmation. If the cycle is confirmed, we could see a new high around $12, with the potential to reach a top target of $26.
NEO is showing an A-level setup, though it may take time to fully build. This is shaping up to be a swing trade, so it should be monitored closely, step by step.
Some exchange data show interesting views about NEW and the building of volume
TA shows possibilities for a new break.

NEO IS COMING BACK FROM 262 DAYS FOR NEW INCREASENEW looks depending low time frame, interesting for day trade, which allows it same time to become a follow coin.
NEO is one of the best coins at this moment to follow for confirmations.
NEOUSDT UPDATE#NEO
UPDATE
NEO Technical Setup
Pattern: Bearish Pennant Pattern
Current Price: $11.42
Target Price: $10.20, \$9.00
Target % Gain: 21% downside
Technical Analysis: NEO is trading in a bearish pennant on the 1D chart after a sharp drop. Price is consolidating with lower highs, and a breakdown below support could confirm further downside toward $13.00.
Time Frame: 1D
Risk Management Tip: Always use proper risk management.

NEO's Situation, A Comprehensive Analysis !!!The price on the 3-D timeframe is within an ascending triangle, which can be promising. If the price breaks this pattern with bullish candles, it could easily rise by the distance of AB=CD .
Best regards CobraVanguard.💚

NEO/USDT – Strong Long-Term Accumulation Zone Detected!
🧾 Full Technical Breakdown (1W Timeframe):
NEO is currently revisiting a multi-year demand zone in the range of $3.90 – $4.50, a historically critical level where price has previously bounced before initiating massive rallies.
This zone has acted as a strong accumulation base during:
March 2020 crash
Mid-2019 correction
And now again in 2025 — making this the third test of the zone in a macro cycle.
The recent candlestick behavior shows price compression with long wicks, signaling demand absorption and the potential emergence of buyers.
📐 Key Pattern Formation:
Possible Double Bottom or Adam & Eve Reversal Pattern forming on the weekly chart.
Combined with horizontal support and psychological round number zone ($4–$5), this can be the foundation of a long-term trend reversal.
Price has entered a volatility contraction phase, which often precedes an impulsive breakout.
📈 Bullish Scenario:
If the support holds and we see a breakout with increasing volume:
1. Short-Term Targets:
$6.85 (local resistance)
$9.10 (previous consolidation block)
2. Mid-Term Targets:
$14.31 (last major breakdown level)
$21.54 (multi-month range resistance)
3. Long-Term Targets:
$29.38 – psychological level from previous cycle
$47.88 – historical supply zone
$62.48+ – potentially a multi-year bullish cycle if macro market turns risk-on
Watch for:
Bullish engulfing or hammer candle on the weekly
Breakout from descending structure with strong RSI divergence
Volume expansion above key resistances
📉 Bearish Scenario:
If the yellow support box fails:
Breakdown below $3.90 may signal continuation of macro downtrend.
Immediate bearish targets: $3.30 (2019 low), followed by price discovery below.
Invalidates the bullish reversal structure.
Could coincide with overall crypto market capitulation.
Risk Mitigation:
Use tight stop-loss below $3.90 if entering early
Scale into positions gradually (DCA) instead of full entries
🔥 Strategic Summary:
> “High-conviction zones are not found often — but this looks like one of them.”
With confluence of:
Historical demand zone
Psychological support
Pattern structure
Volume tapering near bottom
…this could be one of the last best accumulation zones for NEO if the market recovers over the next 6–12 months. A macro trend reversal could offer 4x–10x returns if history plays out once again.
📊 Resistance Levels to Watch:
$6.85
$9.10
$14.31
$21.54
$29.38
$47.88
$62.48
$115.28 (macro ATH level)
#NEOUSDT #NEOTechnicalAnalysis #CryptoReversal #BullishCrypto #NEOAccumulation #AltcoinBreakout #NEOPricePrediction #WeeklyCryptoAnalysis #SupportAndResistance #NEOChart #DoubleBottomPattern

NEOUSDT 1W AnalysisNEO ~ 1W Analysis
#NEO This is the lowest support block for now. Buy gradually from here with a short term target of at least 20%+

Potential NEO 1H ScalpBITGET:NEOUSDT is currently testing resistance around $6.66 with RSI in overbought territory, which could trigger a short-term pullback.
A 0.5–0.618 retracement into the unmitigated hourly FVG ($6.39–$6.47) could provide a compelling long entry, while allowing an RSI reset and potentially forming an IH&S pattern.
The measured target for a breakout above ~$6.66 would be ~7.00 (still valid in case of a direct breakout without a pullback).
Setup 1
• Trigger: Pullback to $6.39–$6.47 and reversal
• Invalidation: Sustained break below $6.39
Setup 2
• Trigger: Break above $6.66 with volume
• Invalidation: Failure to hold $6.66 after breakout

NEOUSD: Minimum target for the end of this Cycle $30.Neo turned marginally bullish on its 1D technical outlook (RSI = 56.743, MACD = 0.356, ADX = 25.407) as it has validated the start of the new bullish wave, rebounding on the same level as it did on March 9th 2020. This is the least aggressive Bull Cycle for new but the presence of a HH trendline implies that a Cycle high can be minimum made on it. With the 1W MACD about to form a Bullish Cross, we expect the HH to get hit by the end of the year (TP = 30.000).
## If you like our free content follow our profile to get more daily ideas. ##
## Comments and likes are greatly appreciated. ##

NEOUSDT 1W AnalysisNEO ~ 1W Analysis
#NEO Buy gradually from here if you still have confidence in this coin with a short term target of at least 20%+.
NEOUSDT 1D AnalysisNEO ~ 1D Analysis
#NEO Buy after successfully breaking this resistance line with a short term target of at least 10%+ from here.
Trading opportunity for NEOUSDTBased on technical factors there is a Sell position in :
📊 NEOUSDT
🔴 Sell Now or by Breakout
🪫Stop loss 5.25
🔋Target 3.70
📏 R/R 2
💸RISK : 1%
We hope it is profitable for you ❤️
Please support our activity with your likes👍 and comments📝

NEOUSDT 1WNEO ~ 1W Analysis
#NEO Buy gradually from here with a short -term target of at least 20%+. This is the lowest support for now.

NEO is bearish (1D)The NEO structure is bearish. We have a support zone on the chart, and with this bearish structure, we expect the price to reach the demand zone.
The target is the same as the green box.
The closure of a daily candle above the invalidation level will invalidate this analysis.
Do not enter the position without capital management and stop setting
Comment if you have any questions
thank you
