#NEO/USDT is back at its historical demand zone!#NEO
The price is moving within a descending channel on the hourly timeframe. It has reached the lower boundary and is heading towards a breakout, with a retest of the upper boundary expected.
The Relative Strength Index (RSI) is showing a downward trend, approaching the lower boundary, and an upward bounce is anticipated.
There is a key support zone in green at 3.60. The price has bounced from this level several times and is expected to bounce again.
The indicator is showing a trend towards consolidation above the 100-period moving average, which we are approaching, supporting the upward move.
Entry Price: 3.68
First Target: 3.75
Second Target: 3.84
Third Target: 3.95
Stop Loss: Below the green support zone.
Don't forget one simple thing: Money Management.
For any questions, please leave a comment.
Thank you.
NEOBTC

#NEO is back at its historical demand zone!#NEO
The price is moving within a descending channel on the 1-hour frame, adhering well to it, and is on its way to breaking it strongly upwards and retesting it.
We have a bounce from the lower boundary of the descending channel, this support at 5.45.
We have a downtrend on the RSI indicator that is about to be broken and retested, supporting the upside.
There is a major support area in green at 5.30, which represents a strong basis for the upside.
Don't forget a simple thing: ease and capital.
When you reach the first target, save some money and then change your stop-loss order to an entry order.
For inquiries, please leave a comment.
We have a trend to hold above the 100 Moving Average.
Entry price: 5.55
First target: 5.63
Second target: 5.73
Third target: 5.86
Don't forget a simple thing: ease and capital.
When you reach your first target, save some money and then change your stop-loss order to an entry order.
For inquiries, please leave a comment.
Thank you.

NEO / USDT – Bullish Breakout Setup (4H)Price has successfully broken above the descending trendline and is now holding near the 0.382 Fibonacci level at 5.84.
If momentum continues, a move toward the 0.5 and 0.618 retracement levels looks likely, confirming a potential short-term trend reversal.
🎯 Targets:
6.32
6.80
7.48
maybe to 26$ if we are lucky this year but that's
Based on market structure and the Fibonacci retracement zones, I expect further bullish continuation after this breakout and retest.
📘 This analysis is based on personal market study and structure observation – DYOR / Not financial advice.

NEOUSDT Forming Bullish MomentumNEOUSDT has recently broken out of a consolidation structure, showing strong bullish momentum as it pushes higher with increasing trading volume. The current price action indicates that buyers are stepping in aggressively, reflecting renewed market confidence in this crypto pair. With the breakout supported by healthy liquidity, the probability of continuation towards higher levels looks favorable in the coming days.
This setup suggests that NEO could be entering a sustainable bullish phase, with short-term upside targets pointing towards a 30% to 40% potential gain from current levels. Historically, NEO has shown sharp moves once key resistance levels are cleared, and the recent price structure highlights that same momentum could be building again.
Investors are paying close attention as this project has maintained steady development and utility, which further supports market sentiment. If buyers continue to dominate, NEO has the potential to extend towards higher resistance levels and provide strong returns for both short-term traders and long-term holders.
✅ Show your support by hitting the like button and
✅ Leaving a comment below! (What is You opinion about this Coin)
Your feedback and engagement keep me inspired to share more insightful market analysis with you!
NEOUSDT UPDATE#NEO
UPDATE
NEO Technical Setup
Pattern: Bearish Pennant Pattern
Current Price: $11.42
Target Price: $10.20, \$9.00
Target % Gain: 21% downside
Technical Analysis: NEO is trading in a bearish pennant on the 1D chart after a sharp drop. Price is consolidating with lower highs, and a breakdown below support could confirm further downside toward $13.00.
Time Frame: 1D
Risk Management Tip: Always use proper risk management.

NEO is bearish (1D)The NEO structure is bearish. We have a support zone on the chart, and with this bearish structure, we expect the price to reach the demand zone.
The target is the same as the green box.
The closure of a daily candle above the invalidation level will invalidate this analysis.
Do not enter the position without capital management and stop setting
Comment if you have any questions
thank you

Detailed Overview of NEOBTC: Price Action Explained - NEO◳◱ On the $NEO/ CRYPTOCAP:BTC chart, the Bband Breakout pattern suggests a consolidation phase that could precede a trend continuation or reversal. Traders might observe resistance around 0.0001767 | 0.0001857 | 0.0002107 and support near 0.0001517 | 0.0001357 | 0.0001107. Entering trades at 0.0001727 could be strategic, aiming for the next resistance level.
◰◲ General info :
▣ Name: NEO
▣ Rank: 114
▣ Exchanges: Binance, Kucoin, Huobipro, Gateio, Mexc, Hitbtc
▣ Category/Sector: Infrastructure - Smart Contract Platforms
▣ Overview: NEO aims to build a comprehensive "smart economy" by incorporating digital assets, digital identities, and smart contracts.
◰◲ Technical Metrics :
▣ Mrkt Price: 0.0001727 ₿
▣ 24HVol: 22.703 ₿
▣ 24H Chng: 5.305%
▣ 7-Days Chng: 8.98%
▣ 1-Month Chng: 78.20%
▣ 3-Months Chng: 71.44%
◲◰ Pivot Points - Levels :
◥ Resistance: 0.0001767 | 0.0001857 | 0.0002107
◢ Support: 0.0001517 | 0.0001357 | 0.0001107
◱◳ Indicators recommendation :
▣ Oscillators: BUY
▣ Moving Averages: STRONG_BUY
◰◲ Technical Indicators Summary : BUY
◲◰ Sharpe Ratios :
▣ Last 30D: 6.91
▣ Last 90D: 3.26
▣ Last 1-Y: 0.75
▣ Last 3-Y: 0.11
◲◰ Volatility :
▣ Last 30D: 0.95
▣ Last 90D: 0.74
▣ Last 1-Y: 0.94
▣ Last 3-Y: 0.92
◳◰ Market Sentiment Index :
▣ News sentiment score is N/A
▣ Twitter sentiment score is N/A
▣ Reddit sentiment score is N/A
▣ In-depth NEOBTC technical analysis on Tradingview TA page
▣ What do you think of this analysis? Share your insights and let's discuss in the comments below. Your like, follow and support would be greatly appreciated!
◲ Disclaimer
Please note that the information and publications provided are for informational purposes only and should not be construed as financial, investment, trading, or any other type of advice or recommendation. We encourage you to conduct your own research and consult with a qualified professional before making any financial decisions. The use of the information provided is solely at your own risk.
▣ Welcome to the home of charting big: TradingView
Benefit from a ton of financial analysis features, instruments and data. Have a look around, and if you do choose to go with an upgraded plan, you'll get up to $30.
Discover it here - affiliate link -

Double W for $NEO BULL RUN INCOMINGNEO with the double double bottom - Bull run incoming! What do you think?
SET:NEO

NEO/USDT: Prime Buying Opportunity Amid Bullish Reversal SignalThe NEO/USDT pair is currently trading at 4.153, showing signs of a potential upward reversal after a recent downward correction. This retracement has brought the price to a critical support level, which is being closely watched by traders. The Relative Strength Index (RSI) has recently dipped into oversold territory, indicating that the selling pressure may be waning and a reversal could be imminent. Additionally, the Moving Average Convergence Divergence (MACD) is beginning to show a bullish crossover, which historically signals a shift in momentum from bearish to bullish.
Moreover, the price action suggests that NEO has formed a bullish divergence, where the price is making lower lows while the RSI is making higher lows. This divergence is often a precursor to a strong upward move. The 50-day moving average is also flattening out, suggesting that the recent downtrend may be losing steam and that a base is being formed.
Considering these technical indicators, the current level offers a strong buying opportunity for investors looking to capitalize on the potential medium-term upside. The combination of oversold conditions, bullish divergence, and a potential MACD crossover suggests that NEO could see significant gains from this point. With the price at 4.153, a well-timed entry could allow for substantial profits as the market reverses and begins to move higher. Therefore, this pullback should be viewed as a prime opportunity to buy, with the expectation of a strong rally in the coming weeks.

NEOUSDT 1W-TIMEFRAME ANALYSIS💥NEOUSDT 1W-TIMEFRAME ANALYSIS
💗Hello ladies and gentlemen
This is my new idea for 💥NEOUSDT Neo
I hope my idea is clear
Support me by like and share thank you
Stay Safe💯💲💲💲
Good luck💰😍

NEOBTC Can Be Trading At The SupportWe went through some XXXBTC cross pairs and we can see an interesting pattern on NEOBTC chart. On the weekly basis it can be finishing final subwave (5) of the wedge pattern within wave C of an A-B-C corrective decline from the highs. It's telling us that NEO looks promising, but it's weekly chart, so it may take some time before we will see a rally. Keep in mind that bulls may step in only above channel resistance line and 0.00085 region.

NEO is a ticking bomb, here is whyNeo is a ticking bomb because whales have been accumulating, which can be seen on the chart. We have a pretty long accumulation zone, and once it breaks, we can expect a Tremendeus pump. You want to buy NEO Lower, wait for a breakout, or just wait for my next analysis, and I will notify you, so make sure you follow my account. From the Elliott Wave perspective, we can see that NEO has completed the WXZXZ corrective pattern in the previous bear market. Also, the main downward-sloping trendline is broken. We have a lot of positive signs for a strong bull market on NEO. Let me know what you think about my analysis, and please hit boost and follow for more ideas. Thank you, and I wish you successful trades!
Neo’s platform allows developers to use its software to run smart contracts (known as NeoContracts) and design new programs (dapps) meant to replicate real world products and services.
NeoContracts differ from other smart contract-based protocols in that developers can build applications using a variety of popular existing languages (like C# and Java), rather than learning a new language.
Thus, NeoContract’s ability to work across various programming languages can be attractive to a larger pool of developers seeking to create dapps, or support existing ones.
Delegated Byzantine Fault Tolerant
To secure its blockchain and keep its distributed network of computers in sync, Neo employs a consensus mechanism method called delegated byzantine Fault Tolerant (dBFT).
dBFT works similarly to the delegated proof of stake (DPoS) and leverages a real-time voting system to determine which computers running the software can create the next block on the Neo blockchain. This means anyone who owns NEO can help operate the network.
Each NEO token (sometimes referred to as a Neo coin) can be locked, or “staked,” to represent a vote (the more staked NEO, the more voting power.) All owners who stake NEO then vote for the consensus nodes, who are responsible for creating blocks.
For proposing and adding new blocks to the Neo blockchain, consensus nodes receive the network’s transaction fees (paid in GAS cryptocurrency). Let me know what you think about my analysis, and please hit boost and follow for more ideas. Thank you, and I wish you successful trades!

NEO is still bullishFrom where we entered "start" on the chart, a time-consuming triangle has started, and from where we placed a green arrow on the chart, this triangle has ended and we have entered a bullish wave.
This bullish wave is either an ABC or a more complex pattern.
We should now be in the middle of wave B.
By maintaining the green range, it can move towards TP.
Closing a daily candle below the invalidation level will violate the analysis.
For risk management, please don't forget stop loss and capital management
When we reach the first target, save some profit and then change the stop to entry
Comment if you have any questions
Thank You

NEOUSDT 1W LONG📈Hi all. Timeframe 1 week. NEOUSDT, after a decline, is in accumulation with increased volumes. Fractal of past decline and accumulation, and subsequent growth. I’m considering recruitment to the spot now, with a possible addition from the green zone. Also long during breakout/retest. Let me remind you that the entry at the retest is the safest, but it may not be there if there is a strong exit from the accumulation. It all depends on your trading strategy. Marked goals and levels on the chart.

NEO - Heading straight to next targetBINANCE:NEOUSDT (4H CHART) Technical Analysis Update
NEO is currently trading at $11.73 and showing overall positive sentiment
Price broke-out from the resistance easily and we are seeing back to back green candles.
We are expect this trend to continue and see some pullbacks at the resistance around 13.5
Entry level: $ 11.00 - 11.74
Stop loss level: $0.06
Target 1: $ 12.51
Target 2: $ 13.39
Target 3: $ 14.91
Max Leverage: 2x
Don't forget to keep stop loss.
Follow Our TradingView Account for More Technical Analysis Updates, | Like, Share and Comment Your thoughts.
Cheers
GreenCrypto


GAS is a beast, buy here againGas pumped a lot, which you can see on the chart. Now we need to think about re-buying this coin for another profit. Where to buy GAS? We have an unfilled FVGAP that I have drawn on the chart; this is strong support. Also, we have the 0.786 FIB retracement. These levels are close to each other, so place your limit orders to buy gas here. Thank me later. We also need to complete the ABC corrective pattern before another pump.
Gas is a token created on the NEO blockchain platform with primary purpose of being fees for processing transactions on the NEO network.
Let me know what you think about my analysis, and please hit boost and follow for more ideas. Thank you, and I wish you successful trades!

NEO the Chinese Ether is ready to moveNEO on BTC pair looking primed for a big run
NEO fundamentals are strong, and I think it is undervalued now in this zone to be considered for the bull run. Keep some in your bag.

NEO/USDT Bullish Reversal on the Horizon? 👀🚀NEO Analysis💎 Paradisers, brace yourselves for an exciting trading opportunity with #NEOUSDT, as it's currently lining up for a bullish turnaround from its support zone.
💎 A look back reveals NASDAQ:NEO struggling to surpass its previous high, leading to a bearish sentiment. However, the tide seems to be turning. At the support level of $10.08, where it has already stirred up some buying interest, there's a strong possibility of a bullish shift aiming for the significant supply zone at $15.12.
💎 We, the shrewd traders, are always equipped with a Plan B. Should #NEO dip below our key support at $10.08, we're prepared to capitalize on a bullish rebound from a further support at $9.03. But be cautious, as a drop below this additional support could signal a deeper fall.

Two ways of NEOI believe there is two ways that could go NEO. Either it will follow M structure to fall back down, or it will grow until 20-25.
This is my trial. Not a financial advice.

#NEO/USDT
#NEO
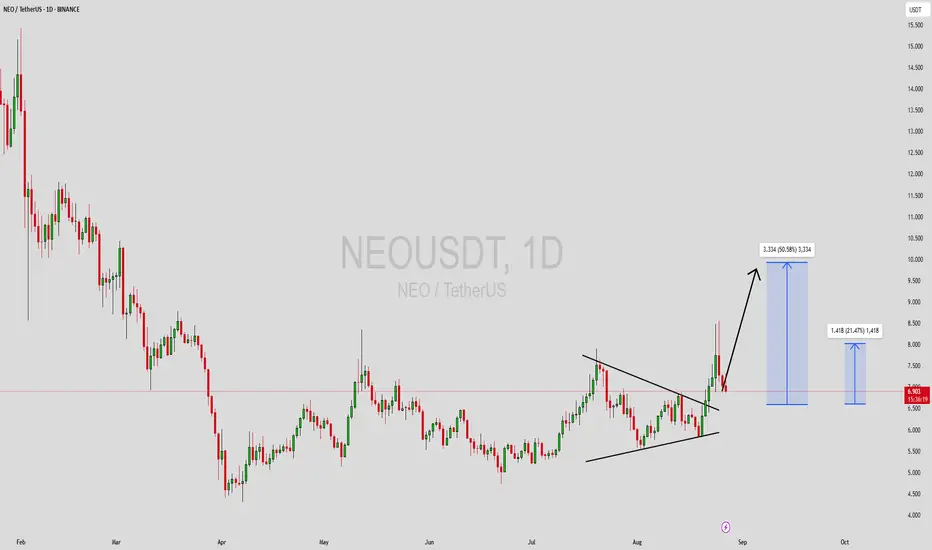
The price has been moving in a descending triangle since May 2023
price move in up waves
Finally, the price reached the upper line of the channel, which is the main resistance line
At 9.40 , which is the current price
We expect to break the resistance line with targets
First target 11.64
Second goal 14.20
Price breake the Moving Average 100 actuly
and as usual follow your trading plan and manage your risk.
Be patient and good luck!
If you like this kind of analysis don't forget to like and follow

NEO ; easy 700%Afternoon folks , some coins are a clue and neo is one of them , its chart is so clean and beautiful that you can literally predict the market with it .
We are so close to starting the bull run , phase 6 might happen but it would never be as severe as the black swan of 2020 , we are in accumulation phase in altcoins so keep accumulating for the peak , i have got the bitcoin halvings as vertical lines in the chart and the arrow is the approximate date of the top , i go for 90-100$ each coin again which is easy 700% .
Neo will be boring in the bullrun but im sure itll do fine , price is appreciated here and keep buying anywhere near supper support .
DYOR , stat safe fam and show your love with the like button.

NEO/BTC - NEO: Trend_Reversal◳◱ An intriguing development has unfolded on the NASDAQ:NEO / CRYPTOCAP:BTC chart as we've identified a compelling Trend Reversal. This shift in price dynamics indicates a noteworthy potential trend change. It's crucial for us to pay attention to the next resistance levels located at 0.0002543 | 0.000269 | 0.0002976 and the significant support levels found at 0.0002257 | 0.0002118 | 0.0001832. Taking these factors into consideration, it may be prudent to contemplate entering a buy position at the current price of 0.0002588, allowing us to take advantage of the projected trend continuation.
Let's keep a watchful eye on this exciting opportunity and stay proactive in our trading strategies.
◰◲ General info :
▣ Name: NEO
▣ Rank: 69
▣ Exchanges: Binance, Kucoin, Huobipro, Mexc, Bittrex, Hitbtc
▣ Category/Sector: Infrastructure - Smart Contract Platforms
▣ Overview: NEO aims to build a comprehensive "smart economy" by incorporating digital assets, digital identities, and smart contracts.
◰◲ Technical Metrics :
▣ Mrkt Price: 0.0002588 ₿
▣ 24HVol: 20.422 ₿
▣ 24H Chng: 13.658%
▣ 7-Days Chng: 29.66%
▣ 1-Month Chng: 22.59%
▣ 3-Months Chng: -0.30%
◲◰ Pivot Points - Levels :
◥ Resistance: 0.0002543 | 0.000269 | 0.0002976
◢ Support: 0.0002257 | 0.0002118 | 0.0001832
◱◳ Indicators recommendation :
▣ Oscillators: NEUTRAL
▣ Moving Averages: STRONG_BUY
◰◲ Technical Indicators Summary : BUY
◲◰ Sharpe Ratios :
▣ Last 30D: -21.31
▣ Last 90D: -17.98
▣ Last 1-Y: -17.67
▣ Last 3-Y: -17.14
◲◰ Volatility :
▣ Last 30D: 0.30
▣ Last 90D: 0.44
▣ Last 1-Y: 0.61
▣ Last 3-Y: 0.87
◳◰ Market Sentiment Index :
▣ News sentiment score is N/A
▣ Twitter sentiment score is 0.56 - Bullish
▣ Reddit sentiment score is 0.64 - Bullish
▣ In-depth NEOBTC technical analysis on Tradingview TA page
▣ What do you think of this analysis? Share your insights and let's discuss in the comments below. Your like, follow and support would be greatly appreciated!
◲ Disclaimer
Please note that the information and publications provided are for informational purposes only and should not be construed as financial, investment, trading, or any other type of advice or recommendation. We encourage you to conduct your own research and consult with a qualified professional before making any financial decisions. The use of the information provided is solely at your own risk.
▣ Welcome to the home of charting big: TradingView
Benefit from a ton of financial analysis features, instruments and data. Have a look around, and if you do choose to go with an upgraded plan, you'll get up to $30.
Discover it here - affiliate link -
