$NEO : Boom boom ... ciao ?Ascending triangle on USDT chart
$NEO seems ready ?
Not a financial advice ?
NEOBTC

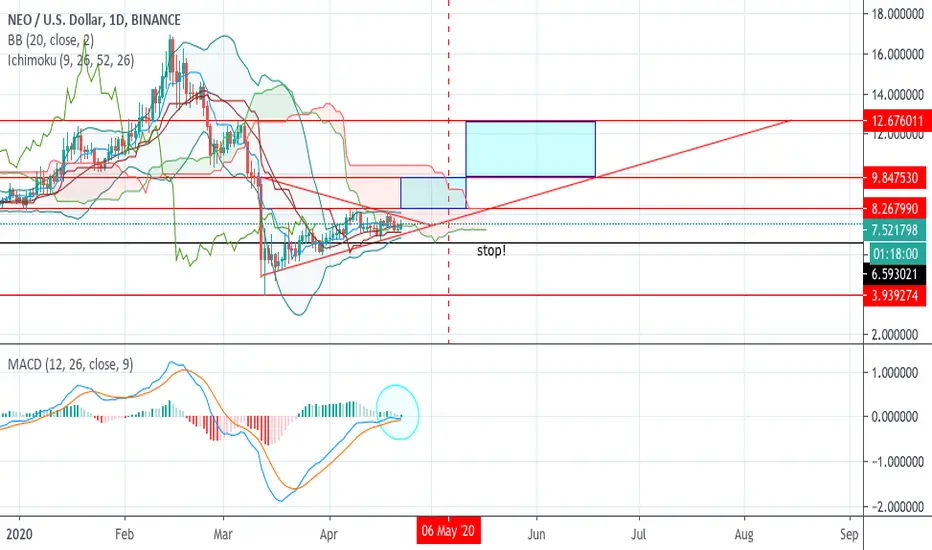
NEO W bottom -- Breakout short TP- midI’m swamped with errands today so I’m going to have to forgo the oped for this publication. Sorry folks.
W Bottom spotted which led to breakout & higher high retesting as we speak.
In the meantime enjoy the signal; I have always loved NEO — going back to when I first began really getting in the ‘blockchain honeymoon zone/phase’ as I read the whitepaper and roadmap I knew then and there that NEO = to the east what ETH = to the west...but I digress. :)
TP1-2 green horizontals
Red horizontal stop limit (imperative)
Time: I don’t expect this to be longer than a short but I’m keeping it neutral as HODLing for a bit won’t exactly be a high risk type situation and from a cost benefit analysis (most def) worth it; ASSUMING U ALWAYS HAVE YOUR STOP LOSSES ACTIVE.
that’s all.
Peace & Love
@a1mtarabichi
P.S. RVNBTC forming a wedge that’s looking ready to tee up for a parabolic run.
Disclaimer
These statements are not guarantees of future performance and undue reliance should not be placed on them. Such forward-looking statements necessarily involve known and unknown risks and uncertainties, which may cause actual performance and financial results in future periods to differ materially from any projections of future performance or result expressed or implied by such forward-looking statements.

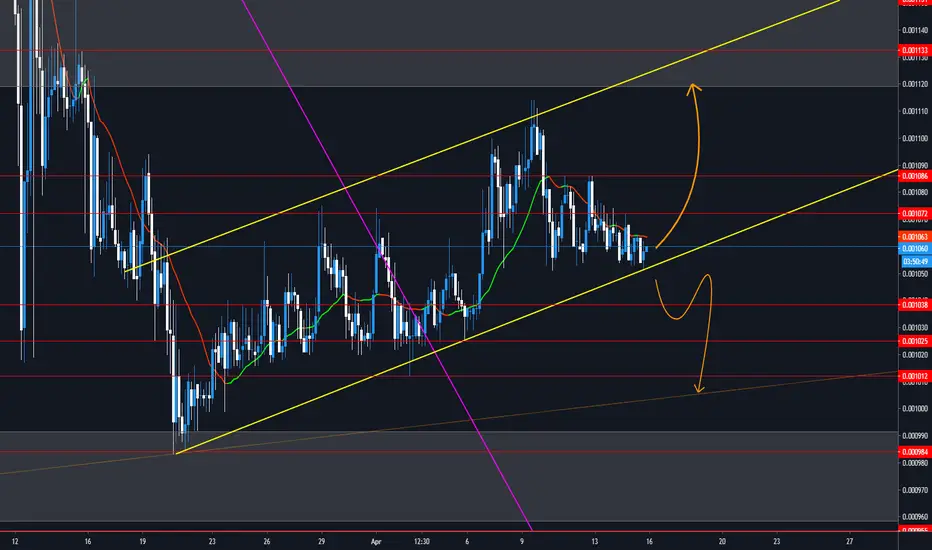
NEOBTC Rising Wedge With Scalping Opportunities [QUICK UPDATES]Hey all, here’s another entry on my tradingview series called 'Quick Updates'.
There's two ways you can trade a rising wedge. You can wait for the breakout and trade the volatility that follows with it, or you can scalp the inner part of the pattern for as long as it holds. Since the whole market is very involatile at the moment, I believe today is a better moment to scalp the inside of the wedge.
On the chart you can see an example of how the price could oscillate, put your buys near the bottom of the support line and the take profit near the top of the resistance line.
--- What is The Quick Update Series All About? ---
I have started a new tag (quickupdates) where I quickly share great opportunities based on TA for shorter timeframes, such as 4h, 1h, and 15m. It will contain a brief explanation with clear and clean charts in order to keep the velocity up and make sure you get to see the opportunities as fast as possible.
Follow me for consistent high quality updates, with clear explanations and charts.
Please like this post to support me.
- Trading Guru
--------------------------------------------------------------
Disclaimer!
This post does not provide financial advice. It is for educational purposes only!

NEO movement within WedgeMovement within wedge can be seen to respect Fibonacci spirals, will this movement continue with a third up-wave? or will this result in a breakout?
This wedge formed is a falling wedge technically however it is quite horizontal

Fibonacci wavesTesting to see if 1.618 follows a bullish trend that was previously seen within the ring of the Fibonacci circle, hence creating the wave.
Here is my original analysis for Fib Waves which is still underway
I believe we will see a repeat bullish momentum throughout the fib ring.
Not much of an analysis for NEO but here we are.

Neo the profit machineNeo once again made me profits on my last short and what looks like a confirmed bear flag now. Looking for shorts if we move higher because it could easily break down here also. Will look for better risk-reward. Cheers!

NEO more downside maybeNeo has been the easiest alt to trade lately. I was so unfortunate to close my short early because I was not confident and then bitcoin lost all its support like there wasn't any. Anyway the current formation looks like a bear flag and I think 7.30 is a good entry. As you can see there is lots of overhead resistance. My Stop loss is 7.43. Good luck.


NEO/BTC Breakout DoneBreakout in Daily Timeframe
Buy and sell on Given targets
Good luck comment below what you think and share your ideas Thanks

NEO/BTC - bring in liquidity I haven't charted in a week.
I've been watching the asset.
To the dollar, NEO is looking at the shorts.
Downward movement will be relevant to collect stop loss...
wrote earlier about the asset
Friends, thanks for your likes and comments!
Good luck with trading!

NEO ANALYSIS: LONG THE DOUBLE BOTTOM SUPPORT!NEO ANALYSIS:
NEO broke thru temporary support and flipped very bearish. The free fall is expected to be coming to an end upon one final dip into the support zone. This support is the ideal entry for a LONG position. Key entry is from 888-997 sats. RSI And Stoch daily looks bottomed, volume showing sellers exhaustion. An expected rally up to 200MA is bound. Look for a long bounce up to T1 at 1094 and T2 at 1164 sats. This will be a key spot at the 200MA. A rejection means further downside incoming and a triple bottom. A break above T2 is bullish longer term. Move stop loss up in this situation and see how the reaction comes at T2.
Possible Entries: 888-997 sats

NEOBTC - Strong Hidden Bullish RSI Divergence [QUICK UPDATES]Hey all, the Trading Guru is back with another entry on a new series called 'Quick Updates'.
We can see the price making a higher low, whereas at the same time the RSI is making a lower low. This is a bullish continuation pattern where the divergence indicates the end of a temporary retracement in an overall uptrend. This could be a great moment to buy NEO and enter a coin that just started a strong uptrend.
--- What is The Quick Update Series All About? ---
I am starting a new tag (quickupdates) where I quickly share great opportunities based on TA for shorter timeframes, such as 4h, 1h, and 15m. It will not contain just a short explanation, in order to keep the velocity up and make sure you get to see the opportunities as fast as possible.
Follow me for consistent high quality updates, with clear explanations and charts.
Please like this post to support me.
- Trading Guru
--------------------------------------------------------------
Disclaimer!
This post does not provide financial advice. It is for educational purposes only!
About the links below:
20% Discount on Binance: Did you know that Binance introduced a new system where you can get 20% discount on your fees? Find the step-by-step guide on how to add it to your account on the website of 100eyes
Forex & Crypto Scanner: Nobody can keep track of all the pairs on all timeframes. This scanner works on Telegram and sends an automated message including a chart every time something happens to a coin. E.g. it can automatically detect areas of support and resistance, RSI Divergences, Fib Retracements, and more.
Recent success stories

NEO/BTC - Divergence to the level. Returning to the level will be a signal to buy.
You can hide the stop by the mirror level.
Pluses to long:
Divergence to the level.
The vertical volume shows the player.
Bitcoin dominance drops
The purpose of the trade is to test past support levels
Friends, thanks for your likes and comments!
Good luck with trading!

NEOBTC: Keeps fallingI decided to see a couple of alts and they all look so bad.
NEOBTC , for example, fell below 0.001 BTC and shows no sign of a reversal. And with current sentiments it easily could drop another 15-20%.
Last support was near 0.000850 BTC
Information is just for educational purposes, never financial advice. Always do your own research.


NEOBTC | ABCD and triple bottom strong supportPreviously we analyzed NEO in accordance of USDT quote currency, unfortunately the position was strongly correlated with Bitcoin price action. In current market condition we received a confirmation of sustainability of NEOBTC in the mid-term
From a technical sign we have a strong buy signal because of completion of ABCD pattern and formation of triple bottom which stands now for a strong support of ascending trend
NEO is very oversold and its market value are much lower than real intrinsic price thus there is a good fundamental background for this position
We recommend to accumulate NEO and use amount you accumulated with USDT quote currency for middle term holdings
Entry price, target levels and stop loss are in the settings of automatic premium signal

NEO/BTC TA Update (more downside?)NEO/BTC
NEO is on a strong downtrend as the price broke the important support at 1200 sats area.
Since there is not enough consolidation during the uptrend last Oct 2019.
Expect the price to waterfall drop back to previous support or consolidating last Aug-Oct 2019.
The market is full of fear and catching a falling knife today is not a good trading strategy.
Be patient and wait for the whole market to cool-down and find its true value.

!!! ATTENITION: NEO DROPPING TO 7,5$/NEO/BTC PRICE FORECAST Hi guys,
Neo gained solidly so far.
We've seen how strong NEO held while being strongly opressed by Bitcoin.
Now, new has double bearish daily crossover (marked on a chart), so along with Bitcoin, will sink from this instace.
Either open shorts or simply go to USD untill Bitcoin pressure is done (expecting Bitcoin drop to 9150$), therefore Neo should drop massivly and all of a sudden (as B does).
It also peaked on weekly on Stoch RSI and its on a weekly bearish cross right on the top.
Oversold.
Techical side along with RSI, STOCH RSI, MACD and MA and EMA's confirm bearish moomentum (temporarily), but imminently.
Drop levels should be :
1. Clearing your position now.
2. Rebuy NEO at 10.40$
3.Rebuy NEO on 10.30$
4.Rebuy NEO below 8$ and ride it to HH (20$+) previous high
Good luck and feel free to upvote an analysis if you find it useful or share your thoughts on it.
Thanks for reading.
Good luck guys.

NEO/BTC is close to the Support Zone!The price can bounce off the Support Zone.
It will be better to wait for the false breakout.
The target will be near 0.001380.
Thanks for your comments and likes)

