#NEO/USDT is back at its historical demand zone!#NEO
The price is moving within a descending channel on the hourly timeframe. It has reached the lower boundary and is heading towards a breakout, with a retest of the upper boundary expected.
The Relative Strength Index (RSI) is showing a downward trend, approaching the lower boundary, and an upward bounce is anticipated.
There is a key support zone in green at 3.60. The price has bounced from this level several times and is expected to bounce again.
The indicator is showing a trend towards consolidation above the 100-period moving average, which we are approaching, supporting the upward move.
Entry Price: 3.68
First Target: 3.75
Second Target: 3.84
Third Target: 3.95
Stop Loss: Below the green support zone.
Don't forget one simple thing: Money Management.
For any questions, please leave a comment.
Thank you.
Neousd

#NEO is back at its historical demand zone!#NEO
The price is moving within a descending channel on the 1-hour frame, adhering well to it, and is on its way to breaking it strongly upwards and retesting it.
We have a bounce from the lower boundary of the descending channel, this support at 5.45.
We have a downtrend on the RSI indicator that is about to be broken and retested, supporting the upside.
There is a major support area in green at 5.30, which represents a strong basis for the upside.
Don't forget a simple thing: ease and capital.
When you reach the first target, save some money and then change your stop-loss order to an entry order.
For inquiries, please leave a comment.
We have a trend to hold above the 100 Moving Average.
Entry price: 5.55
First target: 5.63
Second target: 5.73
Third target: 5.86
Don't forget a simple thing: ease and capital.
When you reach your first target, save some money and then change your stop-loss order to an entry order.
For inquiries, please leave a comment.
Thank you.

Chinese Ethereum As much as I’m digging the belief that we actually never had 4 years cycle in altcoins getting stronger, if feels like a cool off years after 2017 cycle for old Altcoins specifically, now if you observe Neo you obviously can’t find a discipline or repetitive action. Or you see manipulation or hold off . Price playing at March 2020 level , in a huge channel on a strong historical support, I honestly can’t believe we won’t hold this support, if we start climbing we’ll sit in ATH by mid 2026 fingers crossed, DYOR .

20X opportunity NEO / USDT Long-Term Accumulation Zone (1M)📈 NEO / USDT – Long-Term Accumulation Zone (1M)
NEO is currently trading at a strong historical demand zone between 4.5 – 5.5 USD, a level that has acted as major support multiple times since 2019.
From a long-term perspective, this zone represents a key accumulation area, and if price holds above it, we could see a potential macro reversal in the coming months or years.
🎯 Major Targets:
$20 – First resistance / mid-range zone
$55 – Secondary target (2021 supply zone)
$100+ – Long-term target if the macro trend shifts bullish
🛑 Invalidation (Stop Loss): Monthly close below $4.0
I expect the price to rise from this multi-year support after studying market structure and historical cycles. The setup looks promising for investors focusing on long-term positions rather than short-term trades.
📘 This is not financial advice — only a personal analysis based on market behavior and historical data.

NEO / USDT – Bullish Breakout Setup (4H)Price has successfully broken above the descending trendline and is now holding near the 0.382 Fibonacci level at 5.84.
If momentum continues, a move toward the 0.5 and 0.618 retracement levels looks likely, confirming a potential short-term trend reversal.
🎯 Targets:
6.32
6.80
7.48
maybe to 26$ if we are lucky this year but that's
Based on market structure and the Fibonacci retracement zones, I expect further bullish continuation after this breakout and retest.
📘 This analysis is based on personal market study and structure observation – DYOR / Not financial advice.

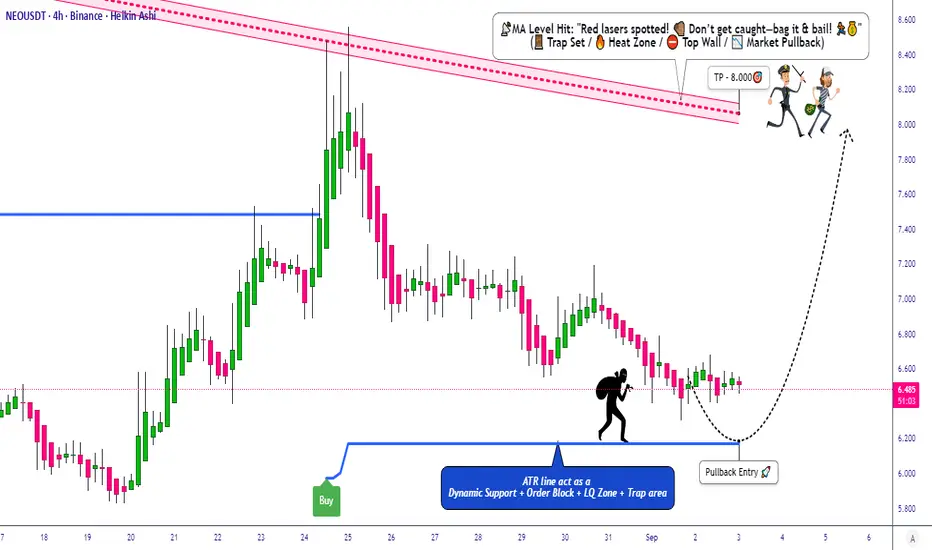
Swing Trade Blueprint ⁝ NEO/USDT Layered Entries & Risk Map🕵️♂️ NEO/USDT | Thief’s Heist Plan 🎯 + Market Snapshot
📌 Plan Overview
Asset: NEO/USDT
Bias: Bullish (Pending Order Plan)
Entry Style: Thief Layer Strategy (Layered Limit Orders + Breakout Confirmation)
💰 Entry Strategy (Thief Layers)
Pullback Entry Zone: 6.200 & above (watch closely 🔔)
Layered Buy Orders (Limit):
6.200 🟢
6.300 🟢
6.400 🟢
6.500 🟢
(You can increase layers as per your own plan. Set alarm in TradingView to catch the breakout easily! ⏰)
🛡️ Stop Loss (Thief SL)
Suggested SL: 5.800 (after breakout & pullback confirmation).
⚠️ Note to Thief OG’s: Adjust SL as per your own risk appetite & trading style. This is not financial advice — just the plan’s outline.
🎯 Target Zone (Escape Point)
Primary Heist Target: 8.000
Remember 🚨 — “Police barricades” (resistance zones) are ahead. Take profits on the run!
⚠️ Note to Thief OG’s: You don’t have to stick only to this TP — take money when the job feels right, manage risk your way.
📊 NEO/USDT Real-Time Data Snapshot
24h Change: -1.66%
24h Low: $6.41
24h High: $6.67
Trading Volume (24h): $36.5M
Market Cap: $457.84M
😰 Fear & Greed Index
Score: 55/100 (Greed)
Neutral RSI (46.59) = balanced momentum
Recent price dip (-1.66% in 24h) tempered optimism
🏛️ Fundamental & Macro Score
Adoption Utility: ⭐⭐⭐⭐☆ → Neo’s “smart economy” focus gaining traction
Network Activity: ⭐⭐⭐☆☆ → Circulating supply: 70.54M NEO
Regulatory Compliance: ⭐⭐⭐⭐☆ → Strong alignment (China-friendly)
Macro Risks: ⭐⭐☆☆☆ → Market volatility + global macro pressure
📣 Retail vs. Institutional Sentiment
Retail Traders: Neutral to Bearish 😕
53% green days in last 30 days
Short-term dip driving caution
Institutional Traders: Cautiously Optimistic 🧐
Focused on long-term upgrades (Neo N3 blockchain)
Accumulation mode in uncertainty
🎯 Overall Market Outlook
Bullish Score: 40/100 → Bearish Short-Term
Risk Warning: Break below $6.09 = deeper downside possible
💡 Key Takeaways
📉 Short-term bearish price action vs. 📈 solid long-term fundamentals
😰 Greed sentiment = room for pullback
🚀 Neo N3 upgrade is a potential growth driver
👀 Watchlist (Correlated Pairs in $)
BINANCE:BTCUSDT
BINANCE:ETHUSDT
BINANCE:SOLUSDT
BINANCE:ADAUSDT
BINANCE:DOTUSDT
✨ “If you find value in my analysis, a 👍 and 🚀 boost is much appreciated — it helps me share more setups with the community!”
#NEOUSDT #NEO #CryptoTrading #SwingTrade #DayTrade #CryptoStrategy #LayeredEntries #BreakoutTrading #RiskManagement #TradingViewCommunity
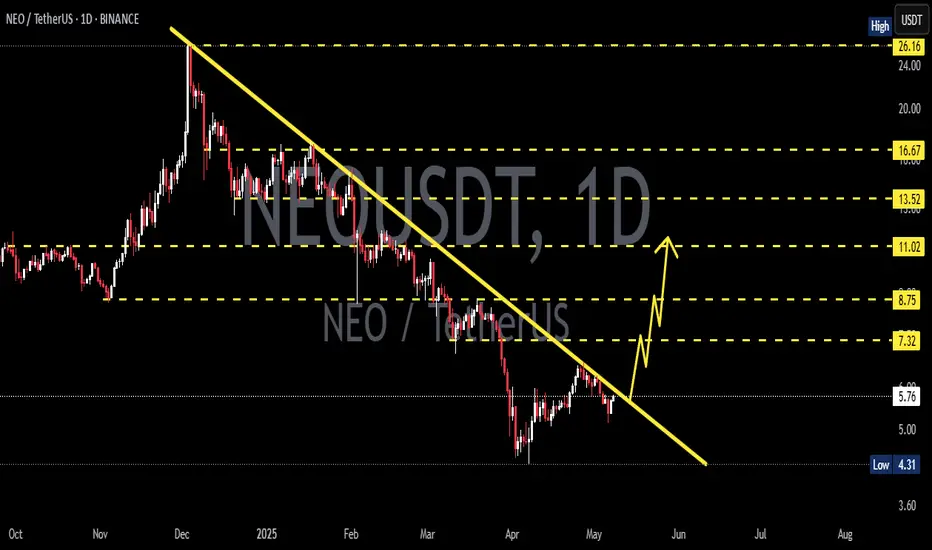
THE NEO CYCLE CAN BREAK TO $12-$26 N3 Blockchain comingThe NEO cycle is starting to confirm in this zone, but we are waiting for a second confirmation. If the cycle is confirmed, we could see a new high around $12, with the potential to reach a top target of $26.
NEO is showing an A-level setup, though it may take time to fully build. This is shaping up to be a swing trade, so it should be monitored closely, step by step.
Some exchange data show interesting views about NEW and the building of volume
TA shows possibilities for a new break.

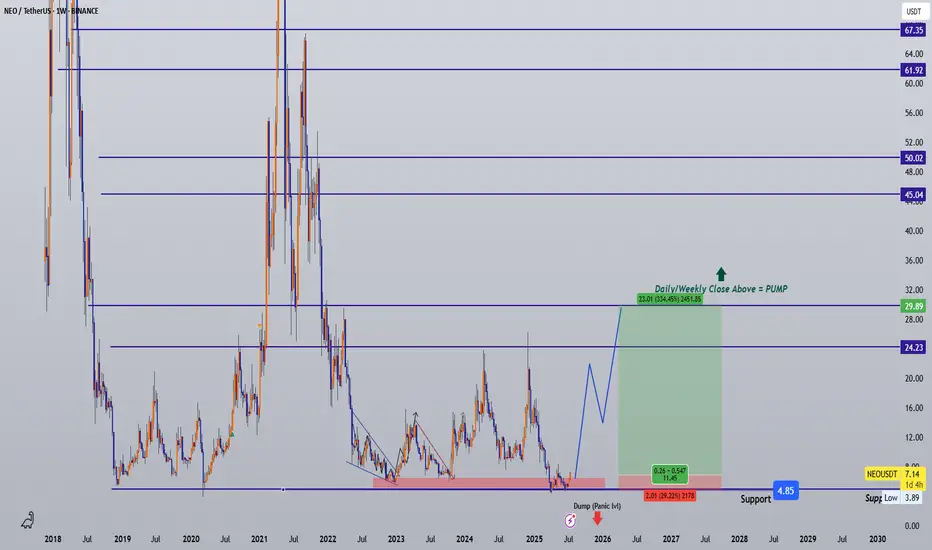
Is NEO the Most Undervalued L1 Left? Entries,Targets & FA Inside📌 Coin: NEO (Neo)
💰 Buy Levels:
✅ First Entry: $7.00
✅ Second Entry: $6.00
🛑 Panic / SL Level: $5.00
🧠 Fundamental Analysis (FA) – In Short
*️⃣ Sector: Layer 1 / Smart Contracts / Digital Identity
*️⃣ Use Case: NEO is a smart economy blockchain, designed to combine digital assets, identity, and smart contracts under one unified platform.
*️⃣ Tech: Built with delegated Byzantine Fault Tolerance (dBFT) consensus — fast finality, low energy, and supports multiple coding languages (C#, Java, Python).
*️⃣ Token System: Two-token model — NEO (governance) and GAS (fees). Holding NEO auto-generates GAS passively.
*️⃣ Narrative Fit: One of the OG Ethereum competitors, often called the "Ethereum of China" — positioning it well for East Asia Web3 narratives.
*️⃣ Unique Angle: Strong ties to Chinese developers and regulatory bodies; integrated into some government-facing blockchain pilots.
📊 Tokenomics & Market Data
(As of July 2025)
🪙 Current Price: ~$6.65
🧾 Market Cap: ~$470M
🔢 Rank: ~Top 100
🧮 Circulating Supply: ~70.5M NEO
🔒 Max Supply: 100M NEO
🔁 Token Distribution: Fixed supply, no inflation
🎁 Bonus: Generates GAS rewards passively for holders (staking-lite utility)
🎯 Bull Market Target (Realistic)
Target Range: $15 – $20
*️⃣ Based on prior cycle retrace zones, ecosystem relaunches, and renewed China Web3 engagement.
🚀 Mega Bullish Target (Speculative Top)
Target Range: $35 – $55+ $75
*️⃣ Would require full East Asia Web3 revival, new developer momentum, and speculation on legacy L1s with real governance systems.
✅ Final Take
🧠 NEO blends legacy reputation with clean tokenomics and unique East Asia exposure. While developer activity lags behind
we ask Allah reconcile and repay
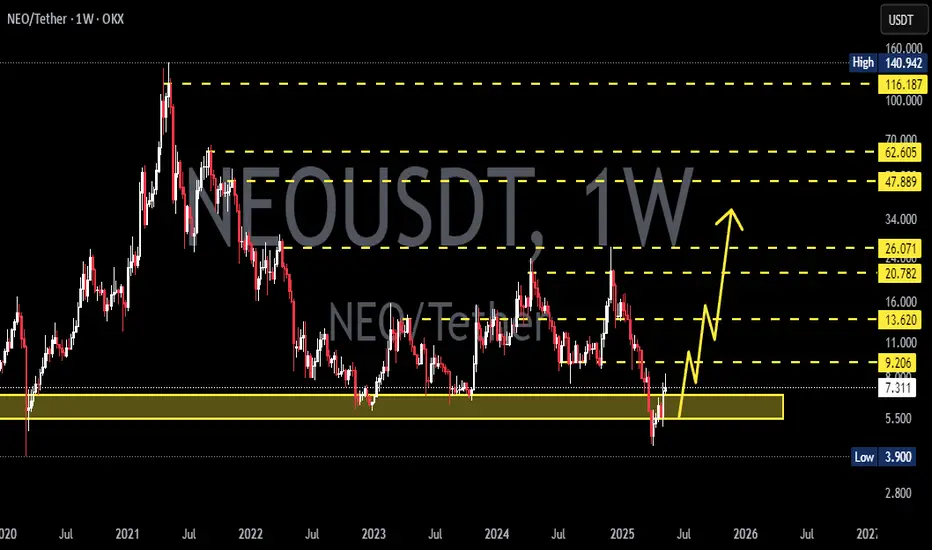
NEO/USDT – Strong Long-Term Accumulation Zone Detected!
🧾 Full Technical Breakdown (1W Timeframe):
NEO is currently revisiting a multi-year demand zone in the range of $3.90 – $4.50, a historically critical level where price has previously bounced before initiating massive rallies.
This zone has acted as a strong accumulation base during:
March 2020 crash
Mid-2019 correction
And now again in 2025 — making this the third test of the zone in a macro cycle.
The recent candlestick behavior shows price compression with long wicks, signaling demand absorption and the potential emergence of buyers.
📐 Key Pattern Formation:
Possible Double Bottom or Adam & Eve Reversal Pattern forming on the weekly chart.
Combined with horizontal support and psychological round number zone ($4–$5), this can be the foundation of a long-term trend reversal.
Price has entered a volatility contraction phase, which often precedes an impulsive breakout.
📈 Bullish Scenario:
If the support holds and we see a breakout with increasing volume:
1. Short-Term Targets:
$6.85 (local resistance)
$9.10 (previous consolidation block)
2. Mid-Term Targets:
$14.31 (last major breakdown level)
$21.54 (multi-month range resistance)
3. Long-Term Targets:
$29.38 – psychological level from previous cycle
$47.88 – historical supply zone
$62.48+ – potentially a multi-year bullish cycle if macro market turns risk-on
Watch for:
Bullish engulfing or hammer candle on the weekly
Breakout from descending structure with strong RSI divergence
Volume expansion above key resistances
📉 Bearish Scenario:
If the yellow support box fails:
Breakdown below $3.90 may signal continuation of macro downtrend.
Immediate bearish targets: $3.30 (2019 low), followed by price discovery below.
Invalidates the bullish reversal structure.
Could coincide with overall crypto market capitulation.
Risk Mitigation:
Use tight stop-loss below $3.90 if entering early
Scale into positions gradually (DCA) instead of full entries
🔥 Strategic Summary:
> “High-conviction zones are not found often — but this looks like one of them.”
With confluence of:
Historical demand zone
Psychological support
Pattern structure
Volume tapering near bottom
…this could be one of the last best accumulation zones for NEO if the market recovers over the next 6–12 months. A macro trend reversal could offer 4x–10x returns if history plays out once again.
📊 Resistance Levels to Watch:
$6.85
$9.10
$14.31
$21.54
$29.38
$47.88
$62.48
$115.28 (macro ATH level)
#NEOUSDT #NEOTechnicalAnalysis #CryptoReversal #BullishCrypto #NEOAccumulation #AltcoinBreakout #NEOPricePrediction #WeeklyCryptoAnalysis #SupportAndResistance #NEOChart #DoubleBottomPattern

NEOUSDT 1W AnalysisNEO ~ 1W Analysis
#NEO This is the lowest support block for now. Buy gradually from here with a short term target of at least 20%+

NEOUSD: Minimum target for the end of this Cycle $30.Neo turned marginally bullish on its 1D technical outlook (RSI = 56.743, MACD = 0.356, ADX = 25.407) as it has validated the start of the new bullish wave, rebounding on the same level as it did on March 9th 2020. This is the least aggressive Bull Cycle for new but the presence of a HH trendline implies that a Cycle high can be minimum made on it. With the 1W MACD about to form a Bullish Cross, we expect the HH to get hit by the end of the year (TP = 30.000).
## If you like our free content follow our profile to get more daily ideas. ##
## Comments and likes are greatly appreciated. ##

NEOUSDT 1W AnalysisNEO ~ 1W Analysis
#NEO Buy gradually from here if you still have confidence in this coin with a short term target of at least 20%+.
NEOUSDT 1D AnalysisNEO ~ 1D Analysis
#NEO Buy after successfully breaking this resistance line with a short term target of at least 10%+ from here.
Trading opportunity for NEOUSDTBased on technical factors there is a Sell position in :
📊 NEOUSDT
🔴 Sell Now or by Breakout
🪫Stop loss 5.25
🔋Target 3.70
📏 R/R 2
💸RISK : 1%
We hope it is profitable for you ❤️
Please support our activity with your likes👍 and comments📝

$NEO is back at its historical demand zone!NASDAQ:NEO is back at its historical demand zone 👇
Accumulated here for over 6 years — every bounce from this range led to massive rallies.
If it plays out again, $25–$45 isn't far-fetched.
Low risk, high reward? You decide.

NEOUSDT 1WNEO ~ 1W Analysis
#NEO Buy gradually from here with a short -term target of at least 20%+. This is the lowest support for now.

NEO is bearish (1D)The NEO structure is bearish. We have a support zone on the chart, and with this bearish structure, we expect the price to reach the demand zone.
The target is the same as the green box.
The closure of a daily candle above the invalidation level will invalidate this analysis.
Do not enter the position without capital management and stop setting
Comment if you have any questions
thank you

NEOUSDT 1WNEO ~ 1W Analysis
#NEO Buy from here if you still have a Conviction on this coin with a minimum target of 20%+
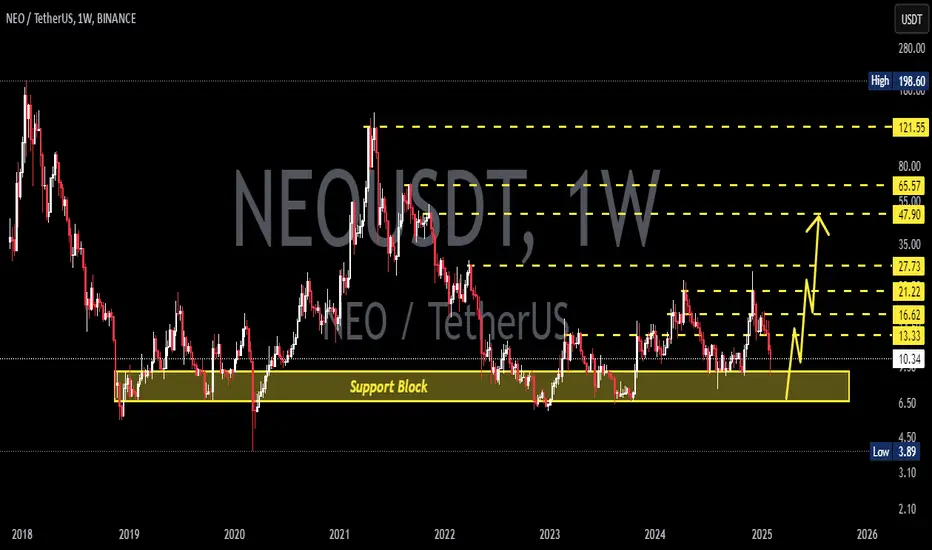
NEOUSDT Weekly Chart Analysis: A Bullish OutlookOverview:
NEOUSDT appears to be in a sustained uptrend, exhibiting a series of higher highs and higher lows on the weekly chart. This analysis will delve into the technical indicators and key levels that support this bullish outlook.
Trend Analysis:
Uptrend: The price action is clearly defined by an upward-sloping trendline, confirming the bullish trend. This trend has been in place since late 2022, demonstrating consistent buying pressure.
Higher Highs and Higher Lows: The price is consistently making higher highs and higher lows, a classic characteristic of an uptrend.
Support and Resistance:
Support: The 200-week moving average, currently around $16, is acting as a crucial support level. This long-term moving average often signifies a strong base for bullish trends.
Resistance: The previous high around $25 represents a significant resistance level. A break above this level could signal further upside potential.
Indicator Analysis:
Moving Averages: The moving averages are generally sloping upwards and are currently below the price, indicating support. This alignment of moving averages reinforces the bullish bias.
MACD: The MACD is above the zero line, suggesting positive momentum. Although it has recently pulled back from overbought levels, it remains supportive of the bullish trend.
Trading Strategy:
Buy and Hold: Given the strong bullish trend, a buy-and-hold strategy could be suitable for investors with a longer-term horizon.
Buy on Dips: Traders can look for opportunities to buy NEOUSDT during pullbacks or consolidations within the uptrend.
Breakout Trading: Consider buying on a breakout above key resistance levels, such as the previous high around $25, with strong volume confirmation.
Risk Management:
Stop-Loss: Place a stop-loss order below the recent swing low or below the 200-week moving average to protect against a potential trend reversal.
Trailing Stop: As the price moves higher, consider using a trailing stop-loss to lock in profits and manage risk.
Conclusion:
The weekly chart of NEOUSDT paints a bullish picture. The uptrend is well-defined, supported by key moving averages and a positive MACD. While short-term pullbacks are possible, the overall outlook remains positive for NEOUSDT.

NEOUSDT Long Setup Setting / Spot TradeBINANCE:NEOUSDT
CRYPTO:NEOUSD
📈Which side you pick?
Bull or Bear
SL1 ---> Low-risk status: 3x-4x Leverage
SL2 ---> Mid-risk status: 5x-8x Leverage
(If there is just one SL on the chart, I suggest, low risk status)
👾Note: The setup is active but expect the uncertain phase as well. also movement lines drawn to predict future price reactions are relative and approximate.
➡️Entry Area:
Yellow zone
⚡️TP:
18
20
23.5
25 (Optimistic)
🔴SL:
12.88
🧐The Alternate scenario:
If the price stabilizes against the direction of the position, below or above the trigger zone, the setup will be canceled.

Neo , 120$We are already in more than 100% profit ( check the latest TA down ) with some adjustments I put the tp in 120$ but i expect it to break out and head for more , but for now we stay moderate , stay safe fam

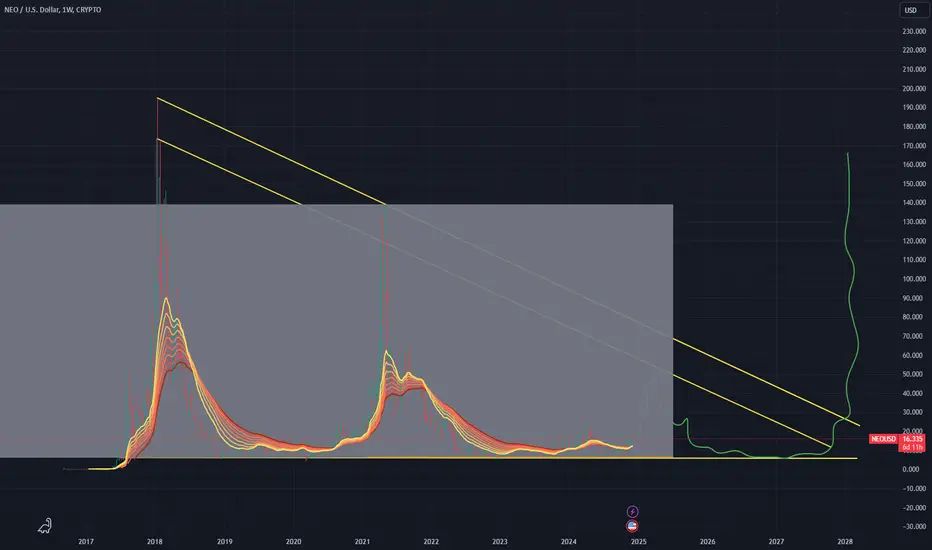
You're not ready, NEO! Large Triangle breakout not likelyIt still can reach approx 55-58 USD per NEO to reach a massive resistance line from 2017, but to completely break out of the triangle ripple style it needs at least another year