Swing Trade Blueprint ⁝ NEO/USDT Layered Entries & Risk Map🕵️♂️ NEO/USDT | Thief’s Heist Plan 🎯 + Market Snapshot
📌 Plan Overview
Asset: NEO/USDT
Bias: Bullish (Pending Order Plan)
Entry Style: Thief Layer Strategy (Layered Limit Orders + Breakout Confirmation)
💰 Entry Strategy (Thief Layers)
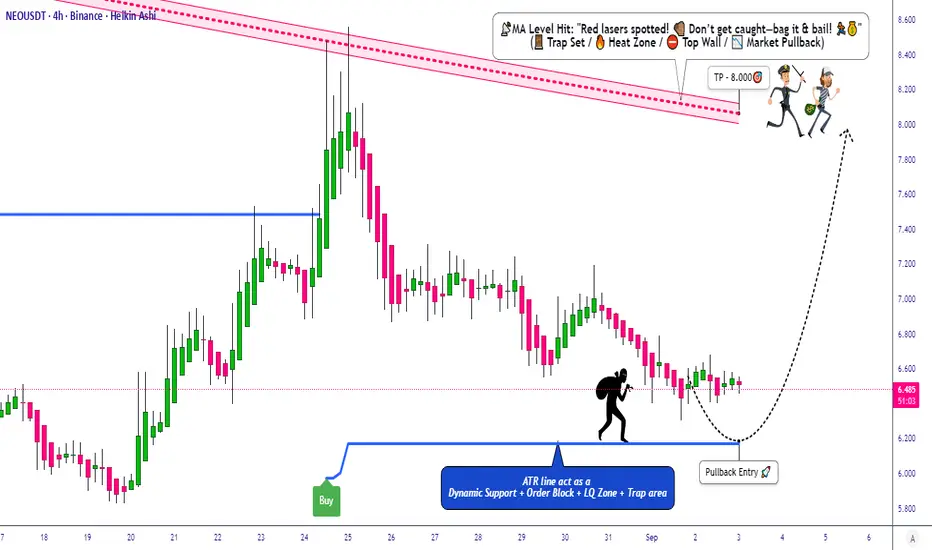
Pullback Entry Zone: 6.200 & above (watch closely 🔔)
Layered Buy Orders (Limit):
6.200 🟢
6.300 🟢
6.400 🟢
6.500 🟢
(You can increase layers as per your own plan. Set alarm in TradingView to catch the breakout easily! ⏰)
🛡️ Stop Loss (Thief SL)
Suggested SL: 5.800 (after breakout & pullback confirmation).
⚠️ Note to Thief OG’s: Adjust SL as per your own risk appetite & trading style. This is not financial advice — just the plan’s outline.
🎯 Target Zone (Escape Point)
Primary Heist Target: 8.000
Remember 🚨 — “Police barricades” (resistance zones) are ahead. Take profits on the run!
⚠️ Note to Thief OG’s: You don’t have to stick only to this TP — take money when the job feels right, manage risk your way.
📊 NEO/USDT Real-Time Data Snapshot
24h Change: -1.66%
24h Low: $6.41
24h High: $6.67
Trading Volume (24h): $36.5M
Market Cap: $457.84M
😰 Fear & Greed Index
Score: 55/100 (Greed)
Neutral RSI (46.59) = balanced momentum
Recent price dip (-1.66% in 24h) tempered optimism
🏛️ Fundamental & Macro Score
Adoption Utility: ⭐⭐⭐⭐☆ → Neo’s “smart economy” focus gaining traction
Network Activity: ⭐⭐⭐☆☆ → Circulating supply: 70.54M NEO
Regulatory Compliance: ⭐⭐⭐⭐☆ → Strong alignment (China-friendly)
Macro Risks: ⭐⭐☆☆☆ → Market volatility + global macro pressure
📣 Retail vs. Institutional Sentiment
Retail Traders: Neutral to Bearish 😕
53% green days in last 30 days
Short-term dip driving caution
Institutional Traders: Cautiously Optimistic 🧐
Focused on long-term upgrades (Neo N3 blockchain)
Accumulation mode in uncertainty
🎯 Overall Market Outlook
Bullish Score: 40/100 → Bearish Short-Term
Risk Warning: Break below $6.09 = deeper downside possible
💡 Key Takeaways
📉 Short-term bearish price action vs. 📈 solid long-term fundamentals
😰 Greed sentiment = room for pullback
🚀 Neo N3 upgrade is a potential growth driver
👀 Watchlist (Correlated Pairs in $)
BINANCE:BTCUSDT
BINANCE:ETHUSDT
BINANCE:SOLUSDT
BINANCE:ADAUSDT
BINANCE:DOTUSDT
✨ “If you find value in my analysis, a 👍 and 🚀 boost is much appreciated — it helps me share more setups with the community!”
#NEOUSDT #NEO #CryptoTrading #SwingTrade #DayTrade #CryptoStrategy #LayeredEntries #BreakoutTrading #RiskManagement #TradingViewCommunity
Neousdtidea
NEO/USDT — Multi-Year Decision Zone: Reversal or Breakdown?📊 Overview
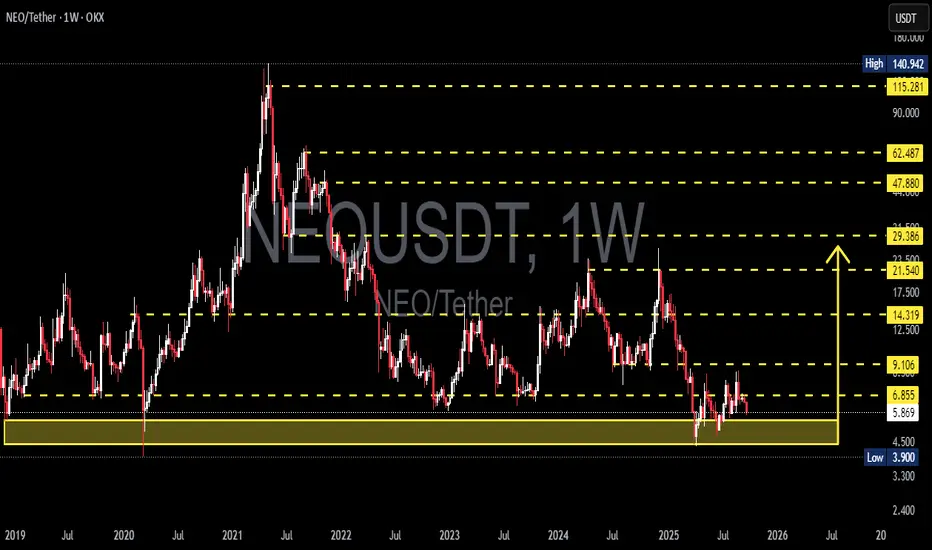
The NEO/USDT (Weekly, OKX) pair is currently sitting at a critical junction that could define its long-term direction. Since the 2021 peak, NEO has been in a macro downtrend, but once again it is testing the historical demand zone at 3.90 – 5.85 USDT (yellow box).
This zone isn’t just a minor support — it’s a multi-year structural level that has repeatedly acted as a floor since 2019.
---
🔍 Structure & Price Pattern
1. Macro Trend:
From the ATH ≈140 USDT (2021), price has consistently formed lower highs and lower lows.
Trend remains bearish, but extended consolidation at the lows suggests possible accumulation.
2. Key Levels:
Strong Support: 3.90 – 5.85 (multi-year demand).
Immediate Resistance: 6.855 USDT.
Next Resistance Levels: 9.106 → 14.319 → 21.540 → 29.386.
Psychological Long-Term Levels: 47.880, 62.487, 115.281, and ATH at 140.942.
3. Potential Patterns:
Holding above the yellow box + breakout over 6.855 could trigger a base breakout / double bottom reversal.
A breakdown below 3.90, however, would confirm a bearish continuation with significant downside risk.
---
🟢 Bullish Scenario
1. Early Confirmation:
Weekly close above 6.855 USDT.
2. Upside Targets:
Target 1: 9.106 USDT.
Target 2: 14.319 USDT.
Target 3: 21.540 USDT (macro structure begins shifting bullish if broken).
3. Supporting Signals:
Strong breakout volume.
RSI reclaiming > 50.
Bullish weekly candlestick closes near the highs.
---
🔴 Bearish Scenario
1. Early Confirmation:
Weekly close below 3.90 USDT.
2. Implications:
Loss of multi-year demand zone.
Opens the door for deeper downside with no clear structural support below.
3. Supporting Signals:
Lower highs failing near 6.855.
RSI staying below 50.
Weak volume on rallies, strong volume on sell-offs.
---
🎯 Conclusion & Sentiment
The 3.90 – 5.85 USDT zone = “Last Defense Zone” for NEO.
Holding this level could spark a long-term reversal toward 9 – 14 USDT.
Breaking below would signal a continuation of the multi-year downtrend with significant downside risk.
At this moment, NEO stands at a crossroad:
➡️ Will it be the start of a new bullish cycle after years of consolidation?
⬅️ Or will it break down its last major support and extend the bearish cycle further?
---
🔑 Notes for Traders
Always wait for weekly close confirmation to avoid bull/bear traps.
Watch the reaction at 3.90 – 5.85 USDT, as it’s critical for both swing traders and long-term investors.
Apply strict risk management (SL/TP), as volatility in this zone can be very high.
---
#NEO #NEOUSDT #NEOAnalysis #Altcoins #CryptoTrading #SwingTrade #SupportResistance #TechnicalAnalysis #CryptoMarket
NEO/USDT – Strong Long-Term Accumulation Zone Detected!
🧾 Full Technical Breakdown (1W Timeframe):
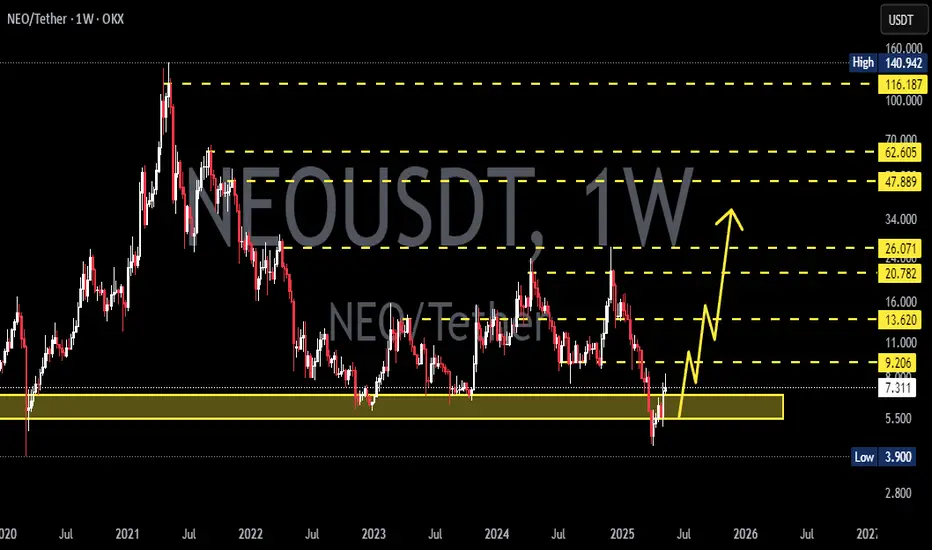
NEO is currently revisiting a multi-year demand zone in the range of $3.90 – $4.50, a historically critical level where price has previously bounced before initiating massive rallies.
This zone has acted as a strong accumulation base during:
March 2020 crash
Mid-2019 correction
And now again in 2025 — making this the third test of the zone in a macro cycle.
The recent candlestick behavior shows price compression with long wicks, signaling demand absorption and the potential emergence of buyers.
📐 Key Pattern Formation:
Possible Double Bottom or Adam & Eve Reversal Pattern forming on the weekly chart.
Combined with horizontal support and psychological round number zone ($4–$5), this can be the foundation of a long-term trend reversal.
Price has entered a volatility contraction phase, which often precedes an impulsive breakout.
📈 Bullish Scenario:
If the support holds and we see a breakout with increasing volume:
1. Short-Term Targets:
$6.85 (local resistance)
$9.10 (previous consolidation block)
2. Mid-Term Targets:
$14.31 (last major breakdown level)
$21.54 (multi-month range resistance)
3. Long-Term Targets:
$29.38 – psychological level from previous cycle
$47.88 – historical supply zone
$62.48+ – potentially a multi-year bullish cycle if macro market turns risk-on
Watch for:
Bullish engulfing or hammer candle on the weekly
Breakout from descending structure with strong RSI divergence
Volume expansion above key resistances
📉 Bearish Scenario:
If the yellow support box fails:
Breakdown below $3.90 may signal continuation of macro downtrend.
Immediate bearish targets: $3.30 (2019 low), followed by price discovery below.
Invalidates the bullish reversal structure.
Could coincide with overall crypto market capitulation.
Risk Mitigation:
Use tight stop-loss below $3.90 if entering early
Scale into positions gradually (DCA) instead of full entries
🔥 Strategic Summary:
> “High-conviction zones are not found often — but this looks like one of them.”
With confluence of:
Historical demand zone
Psychological support
Pattern structure
Volume tapering near bottom
…this could be one of the last best accumulation zones for NEO if the market recovers over the next 6–12 months. A macro trend reversal could offer 4x–10x returns if history plays out once again.
📊 Resistance Levels to Watch:
$6.85
$9.10
$14.31
$21.54
$29.38
$47.88
$62.48
$115.28 (macro ATH level)
#NEOUSDT #NEOTechnicalAnalysis #CryptoReversal #BullishCrypto #NEOAccumulation #AltcoinBreakout #NEOPricePrediction #WeeklyCryptoAnalysis #SupportAndResistance #NEOChart #DoubleBottomPattern

NEOUSDT 1W AnalysisNEO ~ 1W Analysis
#NEO This is the lowest support block for now. Buy gradually from here with a short term target of at least 20%+

NEOUSDT 1W AnalysisNEO ~ 1W Analysis
#NEO Buy gradually from here if you still have confidence in this coin with a short term target of at least 20%+.
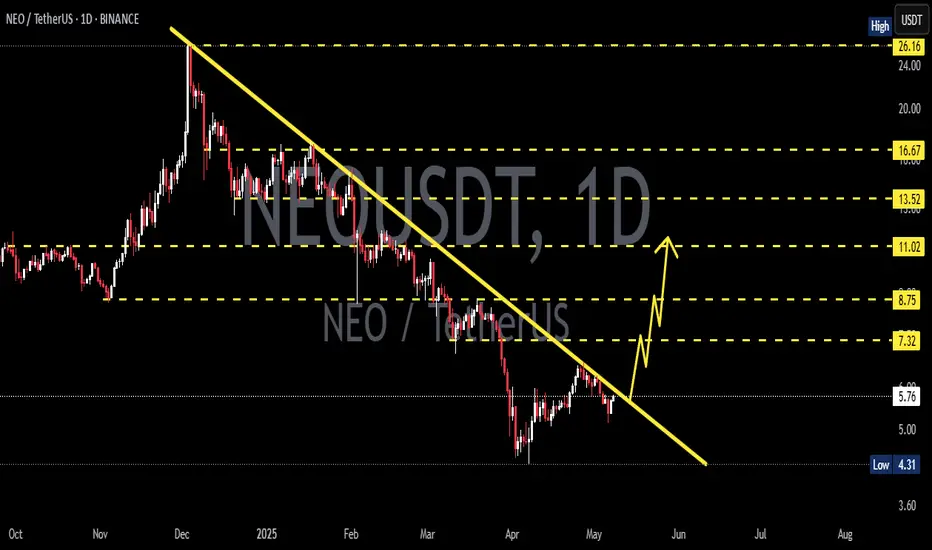
NEOUSDT 1D AnalysisNEO ~ 1D Analysis
#NEO Buy after successfully breaking this resistance line with a short term target of at least 10%+ from here.
NEOUSDT 1WNEO ~ 1W Analysis
#NEO Buy gradually from here with a short -term target of at least 20%+. This is the lowest support for now.

NEOUSDT 1WNEO ~ 1W Analysis
#NEO Buy from here if you still have a Conviction on this coin with a minimum target of 20%+
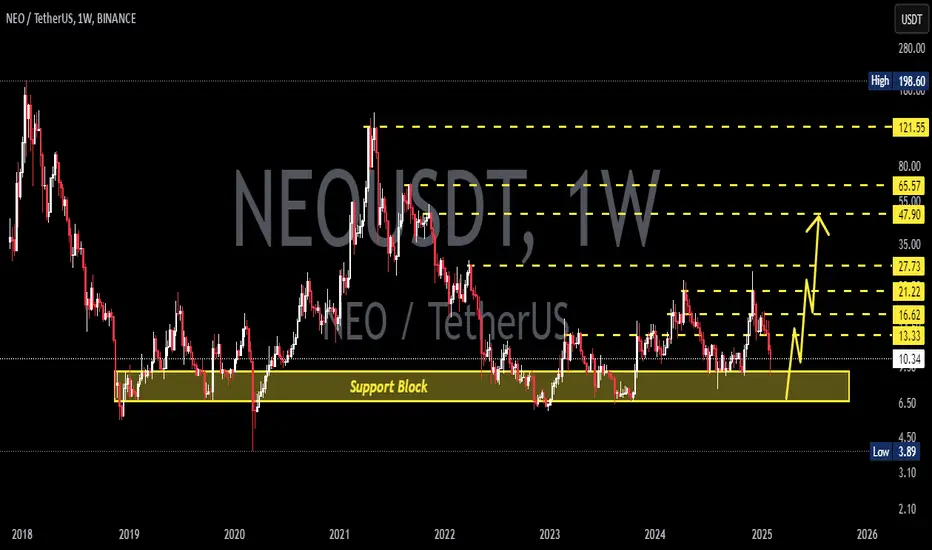
NEOUSDT 1WNEO ~ 1W
#NEO If you still have Conviction on this coin,. Buy gradually after breaking through the resistance line of this pattern. with a minimum target of 20%+

NEOUSDTNEO ~ 1W
#NEO If you still have Conviction on this coin,. This support block will be a very good buying place so far,. with a minimum target of 20%++

NEO Holders! FOLLOW ME~!Hello, guys
This is ESS team.
Let's check the BCHUSDT chart.
If it is supported by the PINK uptrend line and go up, It'll break through the RED long-term downtrend line and reach the green uptrend line.
If it breaks through the GREEN uptrend line, It'll even reach the PURPLE uptrend line.
If it fails to be supported by the pink uptrend line and drops down, It will challenge again after accumulation at the ORANGE uptrend line.

You're LUCKY to see this, NEOUSDT analysis!Hello, guys.
This is ESS team.
Let's see the NEOUSDT chart.
If candle is supported by the bottom PURPLE uptrend line, it is expected to break through the RED long-term downtrend line.
After the break through, It will reach the top green uptrend line.
After that, If it breaks through the top green uptrend line and is supported by green, It will reach the top orange upward trend line.
If it isn't supported by the lower purple uptrend line, It will
try again after accumulation with near the lower pink uptrend line.

NEO/USD Wedge Pattern Breakout OpportunityOverview:
NEO/USD is currently forming a wedge pattern, indicating a potential breakout opportunity. This pattern suggests a period of consolidation and uncertainty in the market.
Breakout Potential:
A breakout from the wedge pattern could signal significant price movements. Traders should watch for confirmation through increased volume and decisive price action before entering positions.
Entry Strategy:
Traders may consider entering:
- Long Position: Above the upper trend line with confirmation of bullish momentum.
- Short Position: Below the lower trend line with confirmation of bearish momentum.
Risk Management:
Implement strict risk management measures, including stop-loss orders and proper position sizing, to mitigate potential losses.
Conclusion:
The wedge pattern in NEO/USD presents a trading opportunity for vigilant traders. By monitoring price action and volume dynamics, traders can identify entry points while managing risk effectively. Caution and adherence to risk management principles are essential in navigating the forex market's volatility.


NEOUSDT Elliott Waves AnalysisHello friends.
Please support my work by clicking the LIKE button👍(If you liked). Also i will appreciate for ur activity. Thank you!
Everything on the chart.
Entry: market and lower
Target: 8 - 10 - 12
after first target reached move ur stop to breakeven
Stop: (depending of ur risk). ALWAYS follow ur RM .
risk is justified
Good luck everyone!
Follow me on TRADINGView, if you don't want to miss my next analysis or signals.
It's not financial advice.
Dont Forget, always make your own research before to trade my ideas!
Open to any questions and suggestions.

NEO usdt forecast and ideaPlease write any advice or suggestions.
Dear friends, request any cryptocurrency pair, currencies pair for forex, and any index that you want to be analyzed and ask any questions.
Thanks for your attention

NEOUSDT Analysis (LOCAL VISION)Hello friends.
Please support my work by clicking the LIKE button👍(If you liked). Also i will appreciate for ur activity. Thank you!
Everything on the chart.
Entry: market and lower
Target: 25 - 29 - 34
Stop: ~17 (depending of ur risk). ALWAYS follow ur RM .
Risk/Reward: 1 to 3
risk is justified
Good luck everyone!
Follow me on TRADINGView, if you don't want to miss my next analysis or signals.
It's not financial advice.
Dont Forget, always make your own research before to trade my ideas!
Open to any questions and suggestions.

NEOUSDT Analysis (LOCAL VISION)Hello friends.
Please support my work by clicking the LIKE button👍(If you liked).Thank you!
Everything on the chart.
Entry: market and lower
Target: 32 and 36
after first target reached move ur stop to breakeven
Stop: ~24(depending of ur risk). ALWAYS follow ur RM .
Risk/Reward: 1 to 3.5
risk is justified
Good luck everyone!
Follow me on TRADINGView, if you don't want to miss my next analysis or signals.
It's not financial advice.
Dont Forget, always make your own research before to trade my ideas!
Open to any questions and suggestions.

NEOUSDTHello. The price is incapable of forming higher ceilings and is based on $24 support and after breaking this level, the next goal $14 are conceivable for it

NEOUSDT AnalysisHello friends.
Please support my work by clicking the LIKE button(If you liked).Thank you!
Everything on the chart.
open pos: market
target: 52 - 56 - 60
after first target reached move ur stop to breakeven
stop: ~40(depending of ur risk). ALWAYS follow ur RM .
risk/reward 1 to 2
Good luck everyone!
Follow me on TRADINGView, if you don't want to miss my next analysis or signals.
It's not financial advice.
Dont Forget, always make your own research before to trade my ideas!
Will be very appreciate for ur donat/coins :)
Open to your questions or suggestions(Looking for investors!).

NEO 12h Where is it better to buy in long?We lost sight of NEOUSDT, it turns out that the last time we published the idea was 2.5 months ago.
But the previous idea worked very well , exceeding our goals. A maximum of $141
And then there was a fall, clearly on levels, look at the preliminary idea, and you will see everything for yourself.
On the recent fall, the $28 level received the status of a strong mirror level, since it previously served as a strong resistance, and now coped with the role of support.
For the next few days, it is necessary that the level of $28 once again adequately withstands the blow from above and an aggressive buyout of buyers begins. In this case, we can safely expect the NEO price to rise to $60 , to begin with.
If the level of $28 does not withstand the pressure of sellers, then the price NEOUSD will drop below, and then long positions will take from $20 and above.
_______________________________
Since 2016, we have been analyzing and trading the cryptocurrency market.
We transform our knowledge, trading moods and experience into ideas. Each "like under the idea" boosts the level of our happiness by 0.05%. If we help you to be calmer and richer - help us to be happier :)

NEOUSDT Descending Triangle Bullish Breakout & RetestNEOUSDT Descending Triangle Bullish Breakout & Retest Completed.
The market also filled order block and pumping RN.
NOTE: DO YOUR OWN ANALYSIS. DO PROPER RISK AND MONEY MANAGEMENT. SPOT TRADING ONLY.
Buying Zone Above:
Above BZ1: 95.266
BZ2: 96
BZ3: 97
Targets:
TP1: 105.139
TP2: 118.027
TP3: 133.691
TP4: 170.374
Stop Loss: 75.302

NEO 12h Are we going to continue to grow to $100?Almost 2 months, since the publication of the previous idea, have not looked towards NEO
However, over the weekend, there was a notification that the NEOUSDT price reached the target from the previous idea, which means that we need to update our thoughts.
As can be seen from the previous idea, after an uncertain growth, the NEOUSDT price was expected to fall sharply, but t he $35.5 level fulfilled its role of support. The level was broken three times by false breakouts, most likely on liquidation of margin positions, however, interested players closed the bodies of Japanese candlesticks above the critical level to preserve the long sentiment.
And although we do not consider ourselves in the cohort of long-term holders of various projects, patient investors could fix the first good profit on NEOUSD
Now the most probable are 2 scenarios:
1. Slight correction above $60 and continued rapid growth to $95
2. A deeper correction can give a tasty price for buying long, but the target from above will be a little more modest $85
Share in the comments the fundamental news that can help the coin's growth
_______________________________
Since 2016, we have been analyzing and trading the cryptocurrency market.
We transform our knowledge, trading moods and experience into ideas. Each "like under the idea" boosts the level of our happiness by 0.05%. If we help you to be calmer and richer - help us to be happier :)
