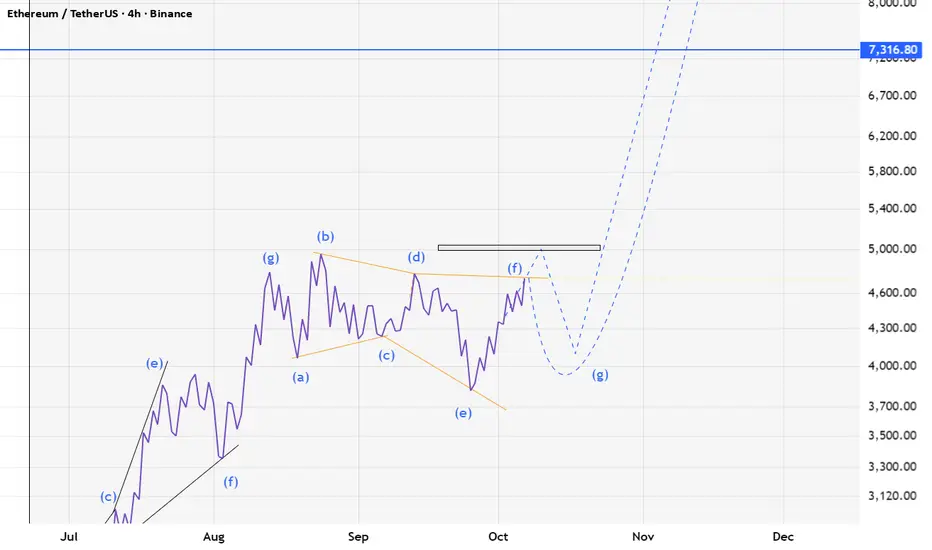
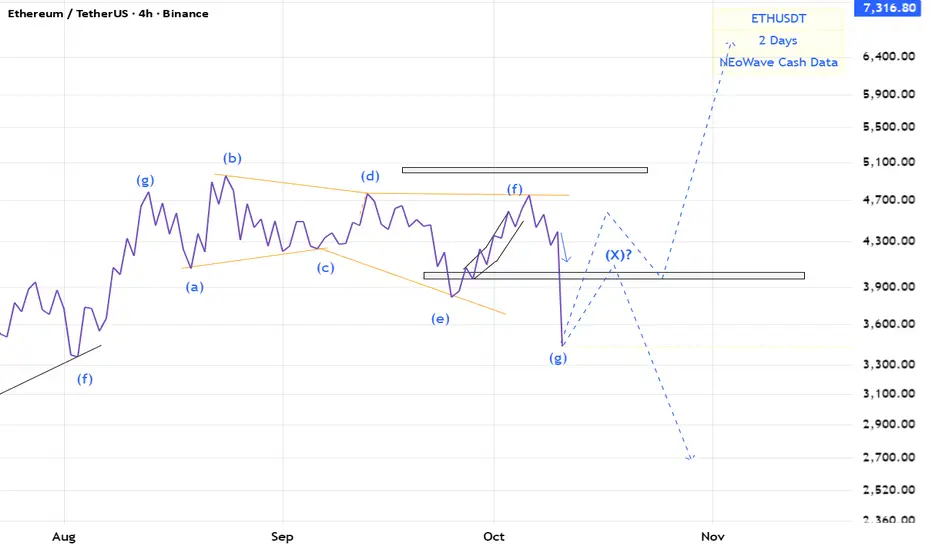
ETH(based on NEo wave)still I think a heavy bullish wave is coming.you just need to wait for it.
wave G has different scenarios.
you should see the post pattern confirmation on smaller degree.
Neowaveanalysis

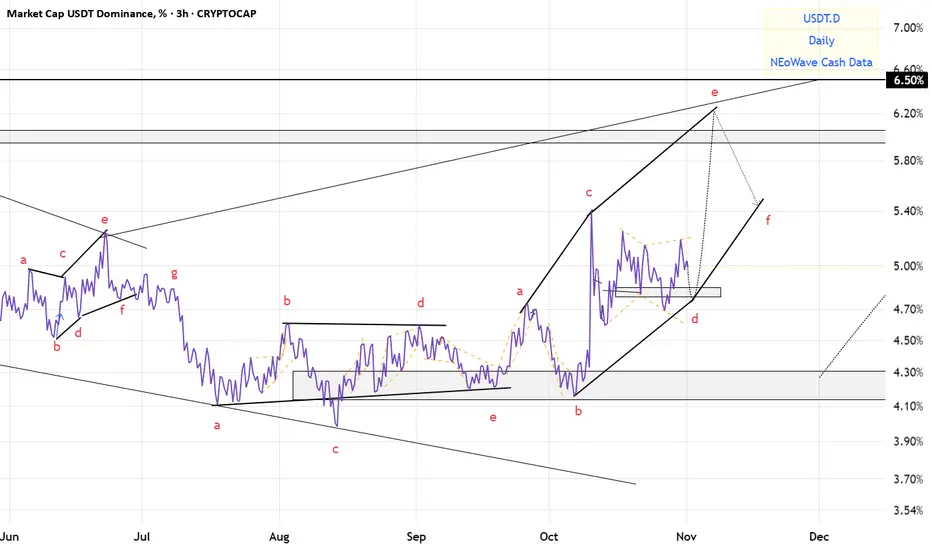
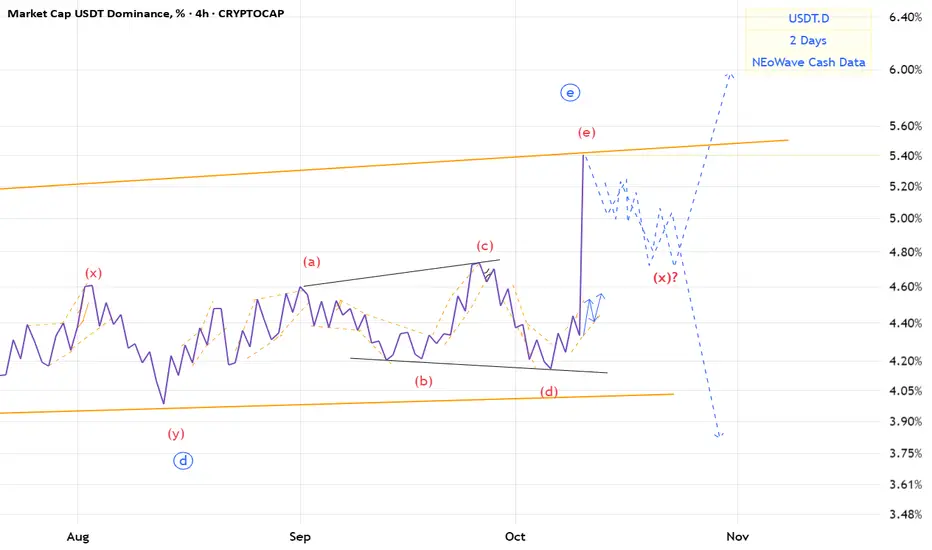
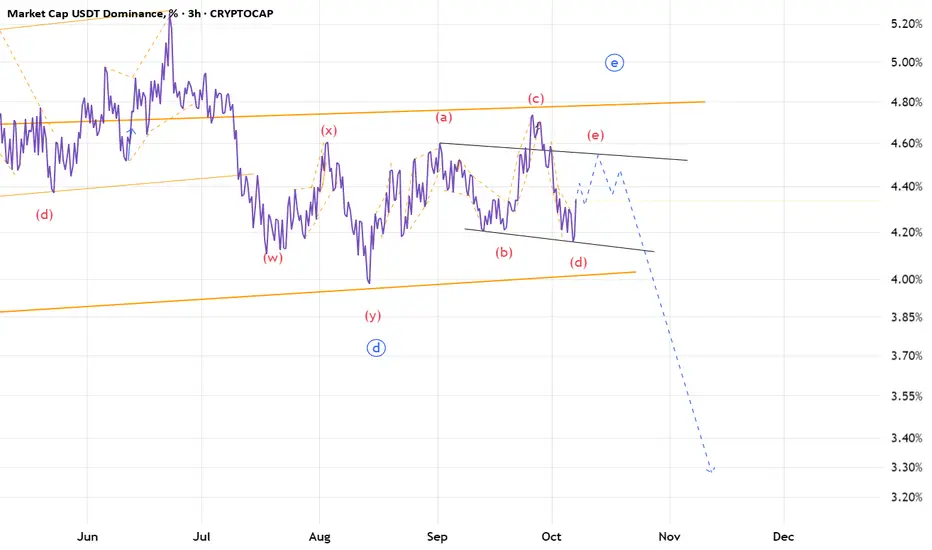
USDT.D(based on NEowave)patterns of eth and btc is changed.
crypto market will start a bullish wave soon.

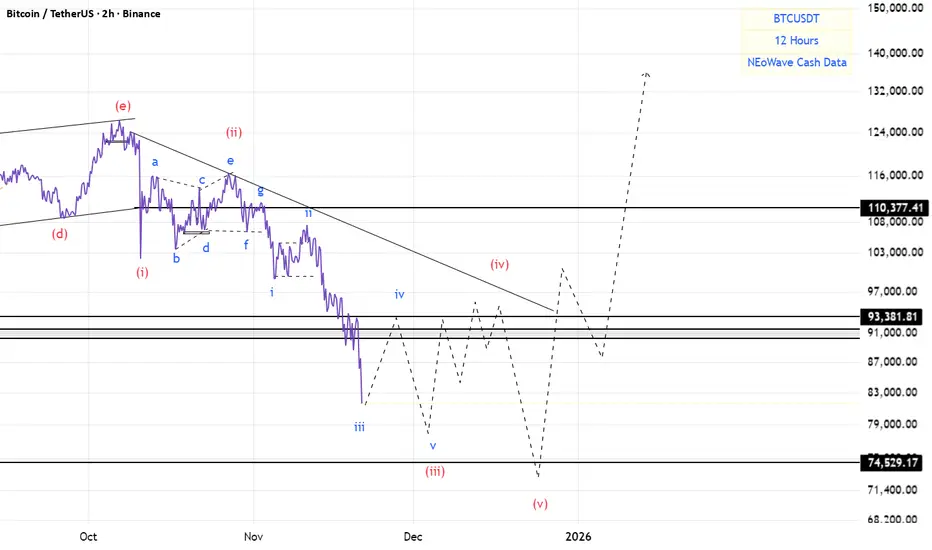
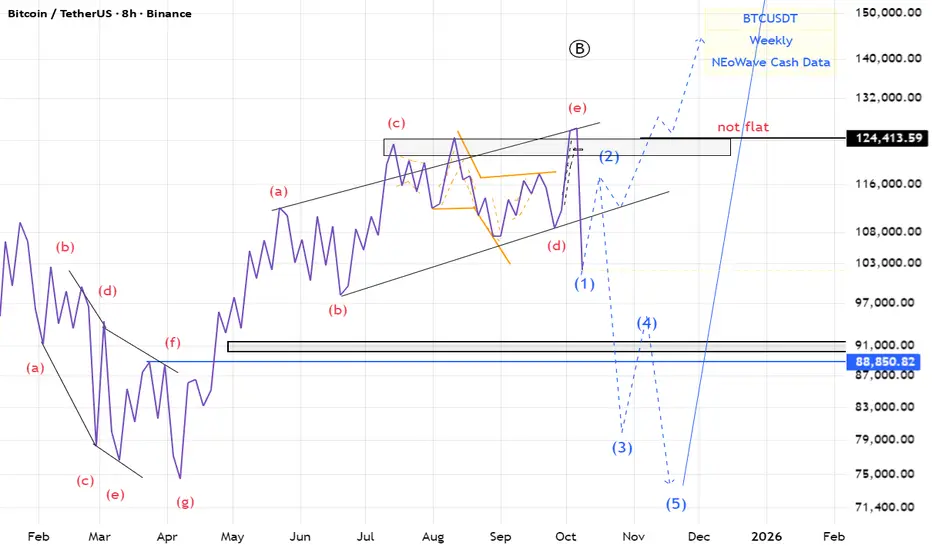
BTC(based on NEo wave)this is not a trend-impulse...it is terminal and if it hit the limitation of wave 4 its a natural triangle and its not wave C of a flat.

BTC(based on NEo wave)everything is ok with flat.
time of wave B is more than wave A and wave C is making a beautiful impulse wave.
bitcoin price under 74500$ is a bear trap!

BTC(based on NEo wave)This branch has impulsive structure.
so why now there is an impulse wave here?
because this 5 waves are wave (c) of a flat.
when this 5 wave finished strong bullish wave will start.
Usdt.d(based on NEo wave)Now 95% of wave G is recognizable and its a bow tie.
Waiting for post pattern confirmation.
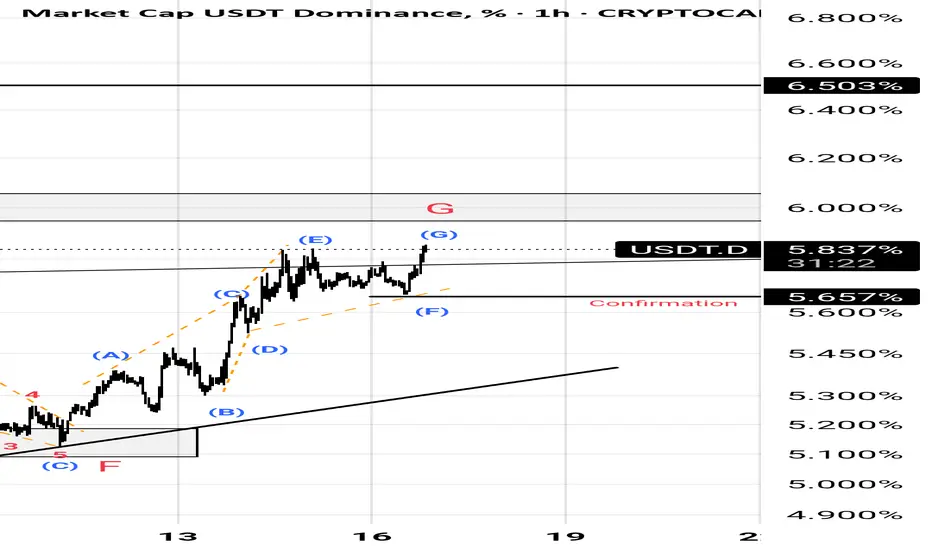
USDT.D(based on NEo wave)I think wave G is showing the pattern.
wave G might be a triangle or a diametric.
Im ready for both scenarios.

20X opportunity NEO / USDT Long-Term Accumulation Zone (1M)📈 NEO / USDT – Long-Term Accumulation Zone (1M)
NEO is currently trading at a strong historical demand zone between 4.5 – 5.5 USD, a level that has acted as major support multiple times since 2019.
From a long-term perspective, this zone represents a key accumulation area, and if price holds above it, we could see a potential macro reversal in the coming months or years.
🎯 Major Targets:
$20 – First resistance / mid-range zone
$55 – Secondary target (2021 supply zone)
$100+ – Long-term target if the macro trend shifts bullish
🛑 Invalidation (Stop Loss): Monthly close below $4.0
I expect the price to rise from this multi-year support after studying market structure and historical cycles. The setup looks promising for investors focusing on long-term positions rather than short-term trades.
📘 This is not financial advice — only a personal analysis based on market behavior and historical data.

NEO / USDT – Bullish Breakout Setup (4H)Price has successfully broken above the descending trendline and is now holding near the 0.382 Fibonacci level at 5.84.
If momentum continues, a move toward the 0.5 and 0.618 retracement levels looks likely, confirming a potential short-term trend reversal.
🎯 Targets:
6.32
6.80
7.48
maybe to 26$ if we are lucky this year but that's
Based on market structure and the Fibonacci retracement zones, I expect further bullish continuation after this breakout and retest.
📘 This analysis is based on personal market study and structure observation – DYOR / Not financial advice.

Shib(based on NEo wave)this fox make everybody angry or disappointed.
but the story of this cute fox is in long term it can make up to 1000% profit.
for 1000% profit you need to buy it in the deepest price but I prefer to buy it step by step with demand zones and with post pattern confrimation.

USDT.D(based on NEo wave)after this long trading range I think its time to change my counting and its not a triangle.
crypto market will see lower prices and it will continue for 1 month.
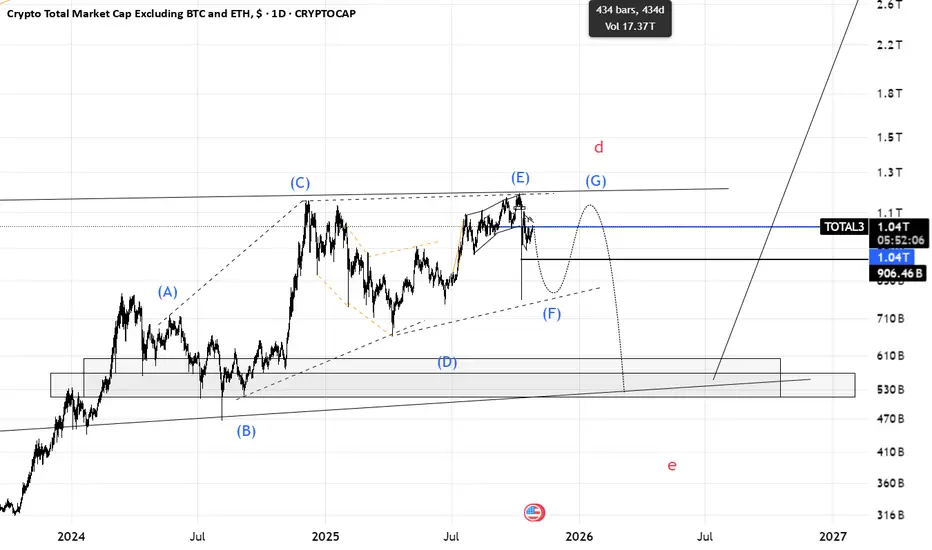
Total3(based on NEo wave)I think this branch is diametric. in last chart I thought its a triangle but its a diametric.
we should for wave F to finish and wave G to start then there is a heavy bearish wave for total3 and altcoins.
Bitcoin - BTCUSDT – Daily NeoWave AnalysisStructure: Contracting Triangle (ABCDE)
Current Price: $108,985 (+1.3%)
🧠 Wave Structure Overview
Bitcoin’s daily chart is forming a Contracting Triangle pattern under NeoWave principles (Glen Neely).
This triangle appears to be part of a wave (4) correction within a larger impulsive cycle, consisting of subwaves A–B–C–D–E with well-balanced price and time proportions.
🔹 Wave Details
Wave A: Decline from 126K → 104K
Type: Impulsive start, setting the corrective tone.
Wave B: Sharp recovery to 123K (≈78.6% retrace of A)
Type: Zigzag – strong bullish response typical for triangles.
Wave C: Pullback to 106K, forming a 3-wave Flat correction.
Wave D: Rally to 118–119K, reaching 70% of wave B — perfectly proportional for a contracting structure.
Wave E: Final leg down toward 106K–107K, with diminishing momentum and volume — a textbook NeoWave E-wave behavior signaling triangle completion.
🔍 Technical Observations
Strong bullish divergence between price and RSI/OBV at the E-wave low.
Decreasing volume during wave E → confirms a terminal corrective phase.
Price remains above the long-term rising trendline and key demand zone near 106K.
🟢 Primary Scenario (≈70% Probability)
Triangle completed at E-wave (106K) → beginning of wave (5) to the upside.
Targets:
1️⃣ 115K–118K – short-term breakout zone
2️⃣ 123K–126K – retest of triangle resistance
3️⃣ 138K–145K – extended target if wave (5) unfolds impulsively
🔴 Alternative Scenario (≈30% Probability)
If BTC breaks below 106K, wave E may extend deeper toward 102K–100K, forming a Running Triangle E before a strong bullish reversal.
⚙️ Summary
✅ Current pattern: Contracting Triangle (ABCDE)
✅ Position: End of wave E of (4)
📈 Expectation: Start of wave (5) impulsive advance
⚠️ Invalidation: Daily close below 102K
Conclusion:
BTC is likely completing a major corrective phase. Holding above 106K keeps the bullish breakout scenario valid — watch for a decisive move above 111K–112K to confirm the next impulsive leg.

Gold WEEKLY Neowave Analysis (Potential Top Forming)The top in Gold may be forming; however, confirmation requires a larger and faster decline than the strongest counter-trend wave observed within this entire structure. This phase represents one leg of a multi-decade diametric formation. The pattern itself is a newly identified structure within the realm of NeoWave theory, and much of this analysis is based on the Gold chart of Mr. Glenn Neely.
The price is should break below $3,850 before the end of March 2026, and this move could occur much sooner. However, this timeframe represents the maximum limit before the outlook becomes invalid.
I will post an update regarding the future of Gold , once we get a confirmation

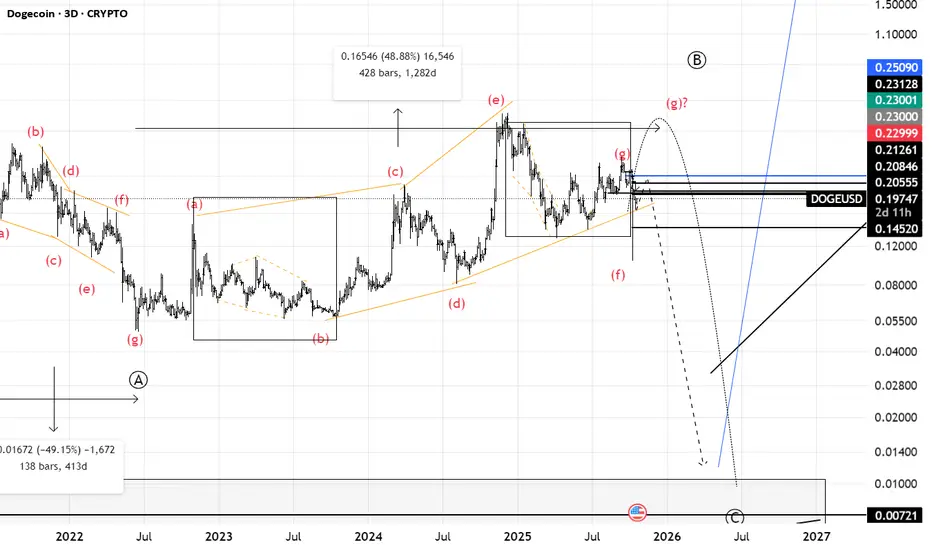
Doge(based on NEo wave)I think Its gonna be a flat and some how we will see a very strong bearish wave to 0.01$!
I dont see any bullish waves for long terms.
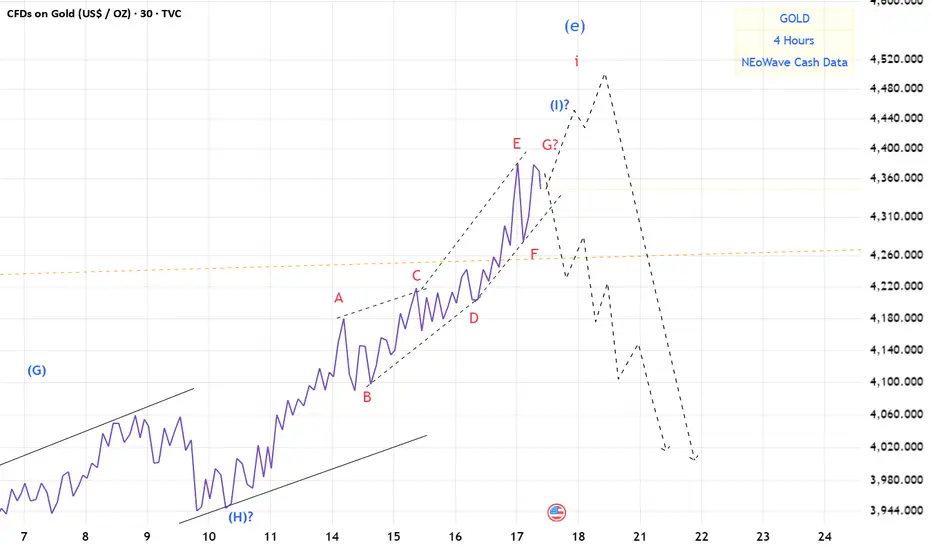
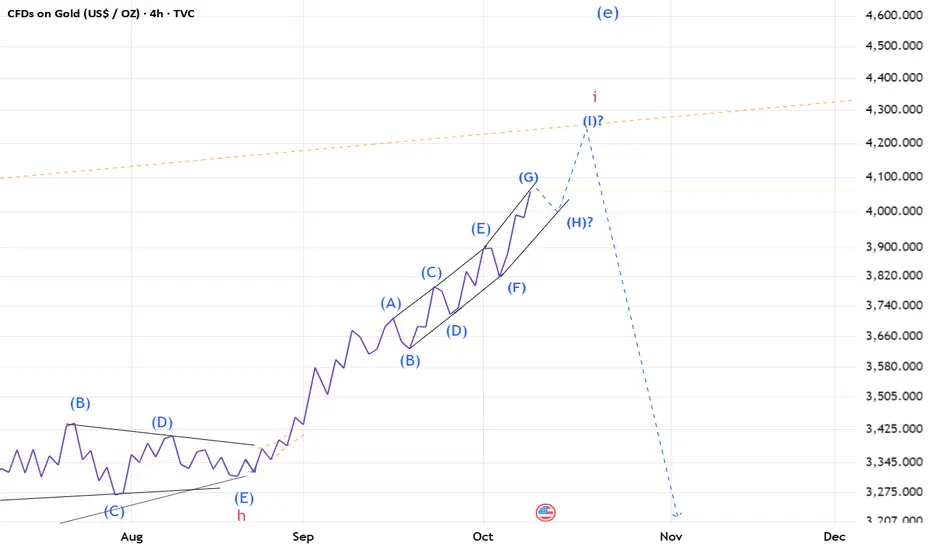
Gold(based on NEo wave)maybe here is the end of wave i.
based on Dow theory good news on top.
crazy people are buying gold.
I think soon we will see crash of gold.
market will not be bullish forever.
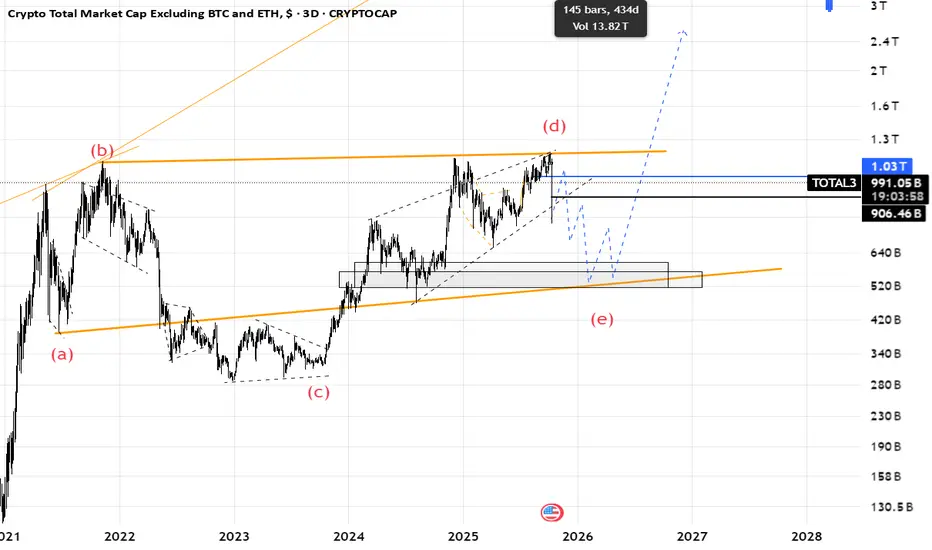
Total3(based on NEo wave)I thought wave (e) is finised but I was wrong.
now I think its the start of wave (e) and we should afraid of altcoins.
when wave (e) is finished altcoins will start to pump.
every upward is a chance to sell.
there is another scenario that I will share it on next post.
BTC(based on NEo wave)there is a good possibility for the irregular flat.
I think 2-3 month we will see the red market
ETH(based on NEo wave)stop loss touched and now there are 2 ways for eth.
we need a post pattern confirmation for bullish wave.
or there is an x wave an correction stills go on.
USDT.D(based on NEo wave)The e wave that I wanted made a descending triangle.
we should wait for it becouse it may make an x wave or a post pattern.
Gold(based on NEo wave)gold is at the end of bull run and its time to sell it on high prices.
after this waves finished I think 2700$ will touch in 2 years later.
USDT.D(based on NEo wave)the bigger degree is a huge triangle and also wave E is a triangle with abcd waves which all are diametrics.
I hope wave e break the curse and change the pattern.
ETH(based on NEo wave)soon eth will start a temporary correction and goes for higher bullish waves.
it is the last chance to buy it.
Stop loss is 3800.