What does GOLD know?
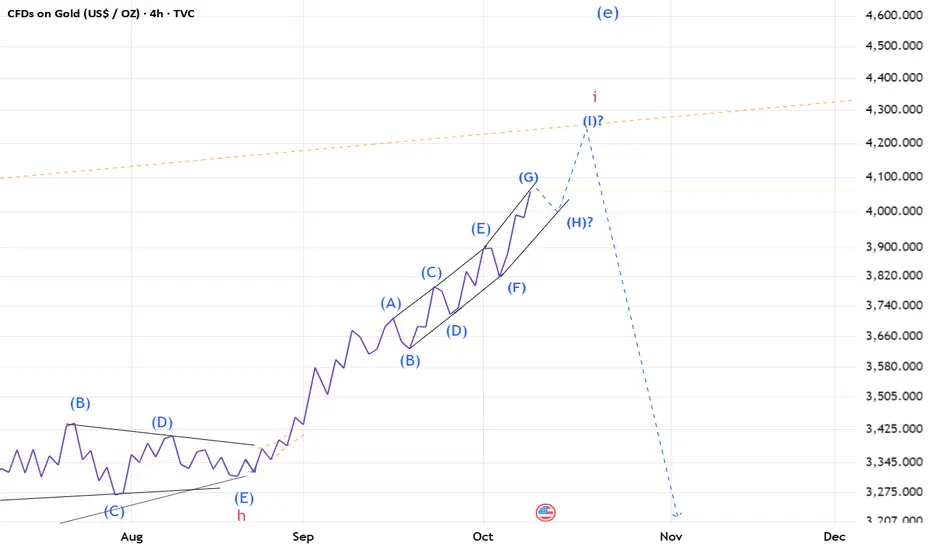
The last analysis on gold was correct in that the rise did happen and I had talked about it, but this rise went far beyond my expectations. As a result, in my view, the last analysis is now invalid.
When I zoom out on the chart, I really see that the rise has been extraordinarily strong. However, in the most recent correction that started from 4381 (the red box), there is clear price similarity with the b-d-f-h waves.
From my perspective, there are three possible scenarios:
1- Either a new pattern is unfolding that is quite rare and we can’t always expect to see such a pattern.
2- The recent correction starting from 4381 (red box) should be considered an X wave, in which case gold’s rise could still continue.
3- We might still be inside wave-(i) of (E), which is extending — one of those exceptions I mentioned earlier regarding Diametrics and Symmetricals that you’re aware of. In this case, the maximum price gold could reach would be around $6900.
One interesting point that comes to mind:
From experience, whenever we have more than 2 scenarios on the table, it usually means we are in the middle of a strong rise and the move is likely to continue!!!! These are extremely confusing conditions, and if you’re feeling the same way, know that you’re not alone. What does gold know that it’s rising at such speed?? The most probable trigger these days, with all the news around, could be the potential conflict/war between Iran and the US!!
Honestly, at these price levels, I have no recommendation to buy or even sell because the rise has been huge, fast, and violent. In my opinion, if you want to enter, do it with small capital only, and never forget to set a stop-loss.
Good luck
NEoWave Chart
Neowaveforecast

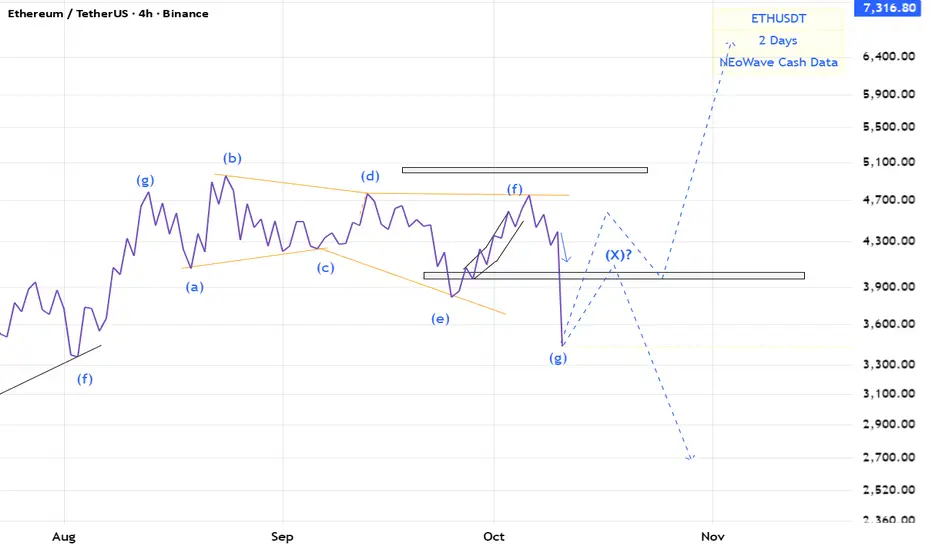
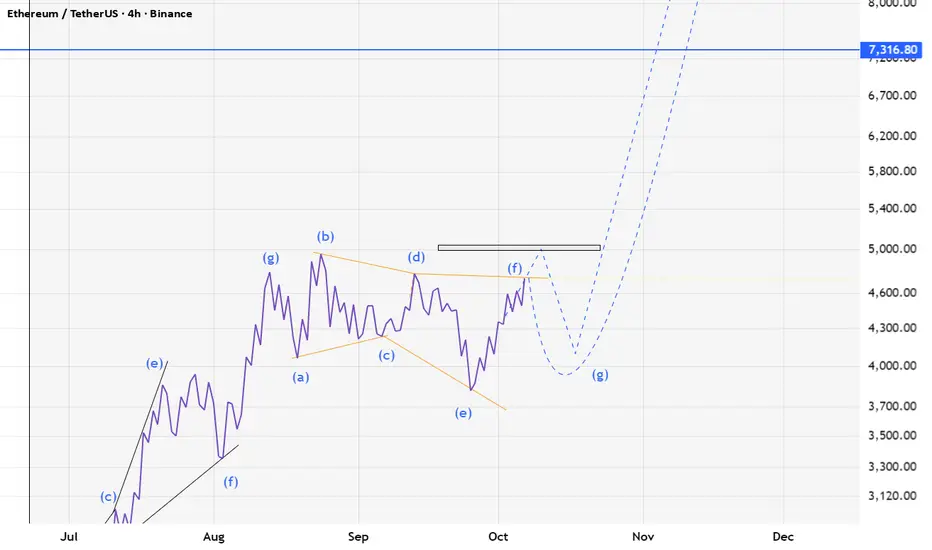
ETH(based on NEo wave)still I think a heavy bullish wave is coming.you just need to wait for it.
wave G has different scenarios.
you should see the post pattern confirmation on smaller degree.

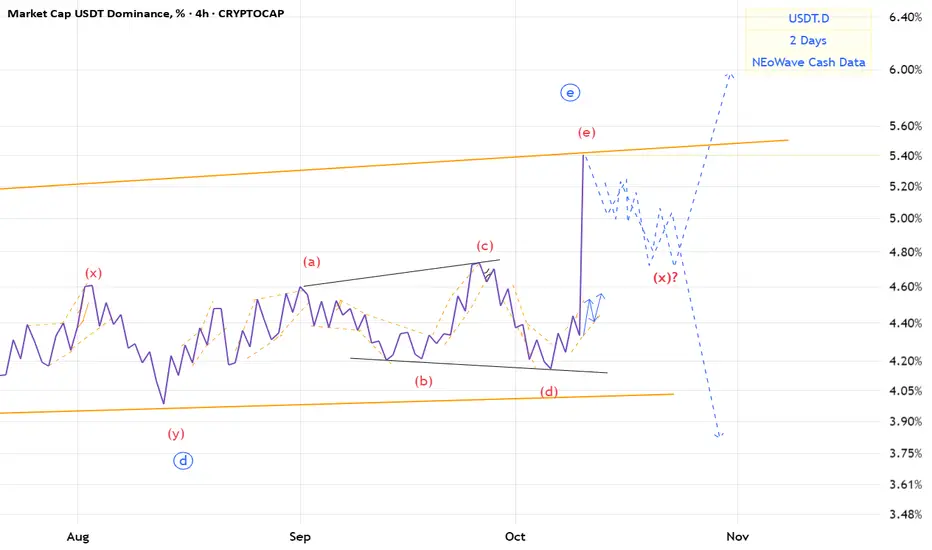
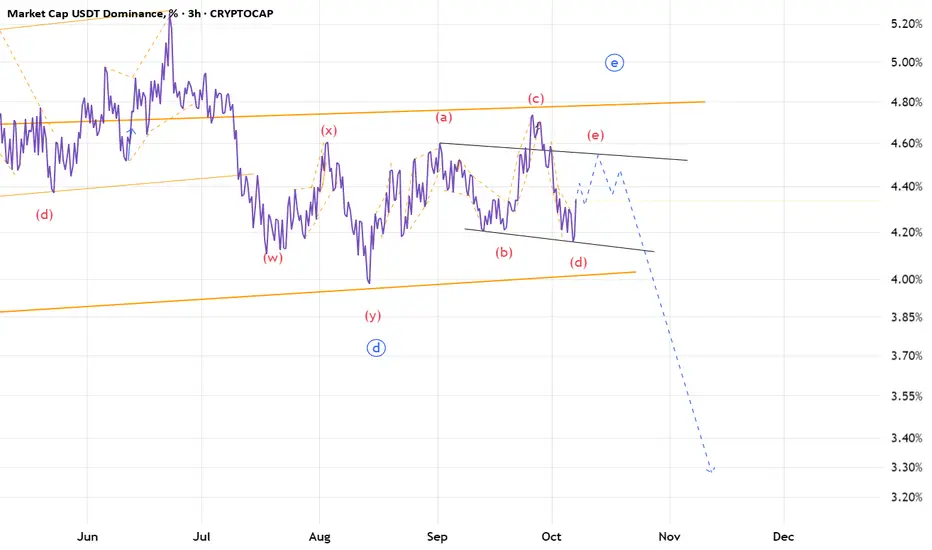
USDT.D(based on NEowave)patterns of eth and btc is changed.
crypto market will start a bullish wave soon.

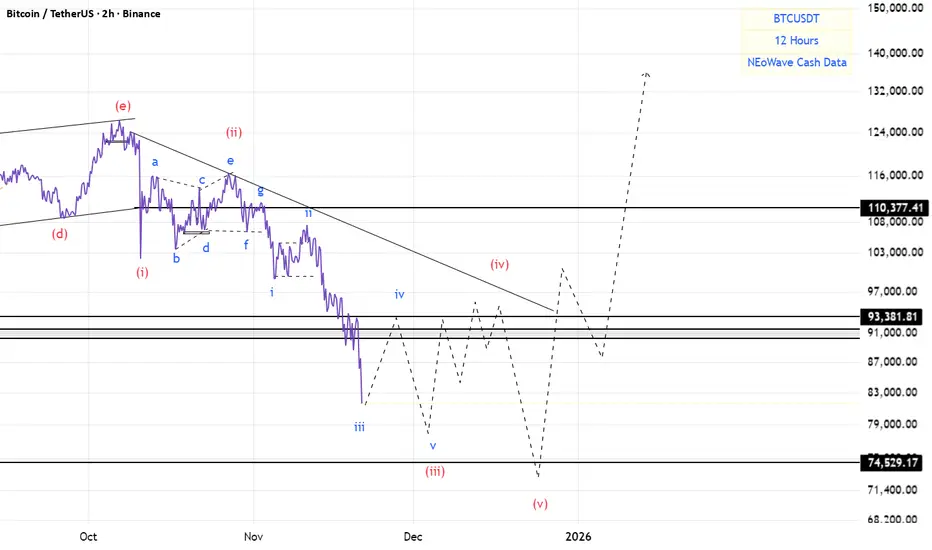
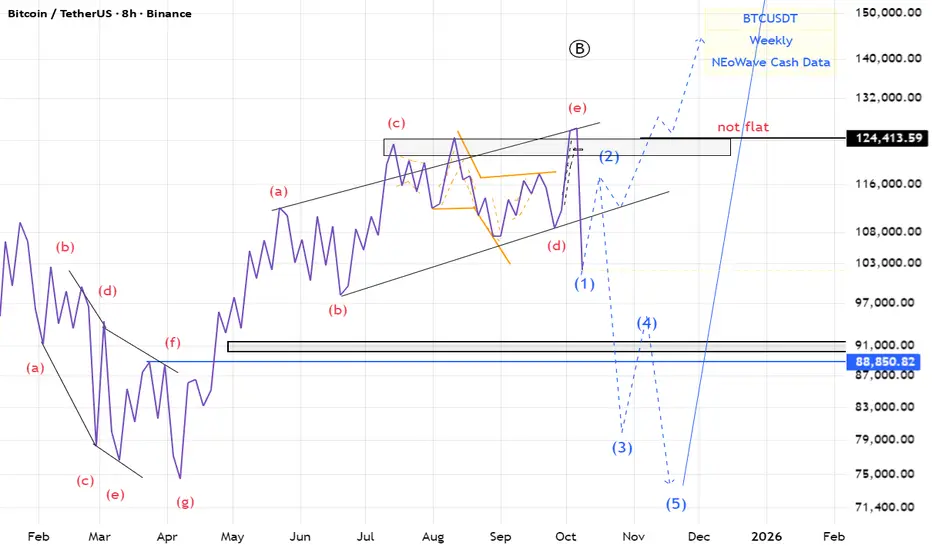
BTC(based on NEo wave)this is not a trend-impulse...it is terminal and if it hit the limitation of wave 4 its a natural triangle and its not wave C of a flat.

BTC(based on NEo wave)everything is ok with flat.
time of wave B is more than wave A and wave C is making a beautiful impulse wave.
bitcoin price under 74500$ is a bear trap!

BTC(based on NEo wave)This branch has impulsive structure.
so why now there is an impulse wave here?
because this 5 waves are wave (c) of a flat.
when this 5 wave finished strong bullish wave will start.
Usdt.d(based on NEo wave)Now 95% of wave G is recognizable and its a bow tie.
Waiting for post pattern confirmation.
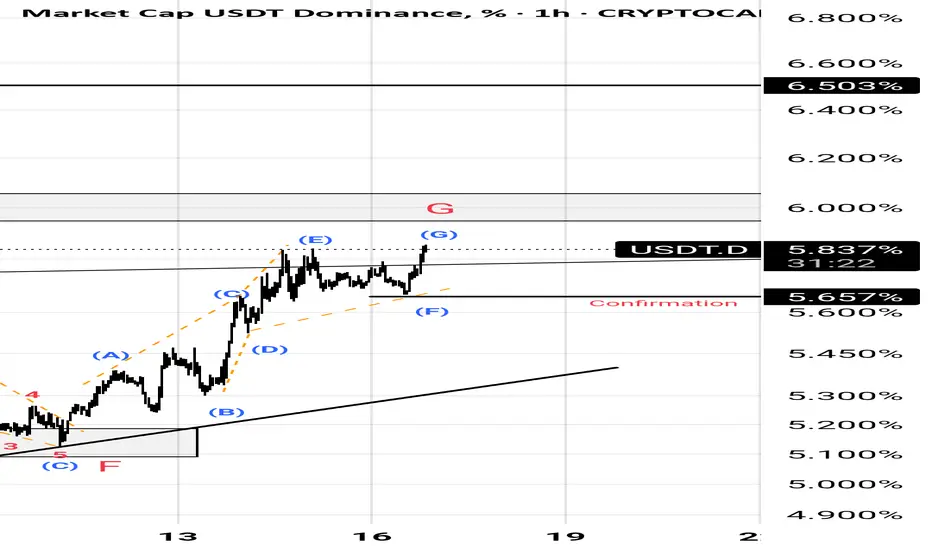
USDT.D(based on NEo wave)I think wave G is showing the pattern.
wave G might be a triangle or a diametric.
Im ready for both scenarios.

Shib(based on NEo wave)this fox make everybody angry or disappointed.
but the story of this cute fox is in long term it can make up to 1000% profit.
for 1000% profit you need to buy it in the deepest price but I prefer to buy it step by step with demand zones and with post pattern confrimation.

USDT.D(based on NEo wave)after this long trading range I think its time to change my counting and its not a triangle.
crypto market will see lower prices and it will continue for 1 month.
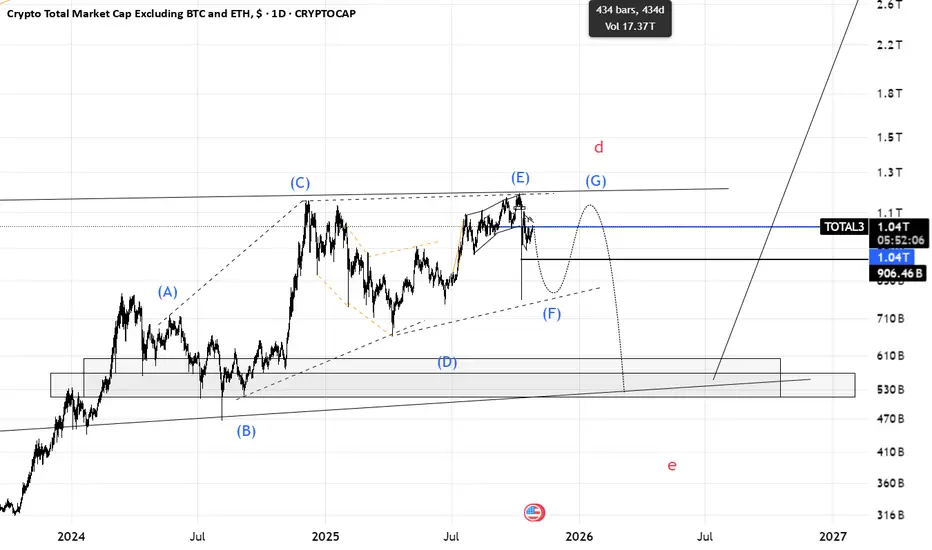
Total3(based on NEo wave)I think this branch is diametric. in last chart I thought its a triangle but its a diametric.
we should for wave F to finish and wave G to start then there is a heavy bearish wave for total3 and altcoins.
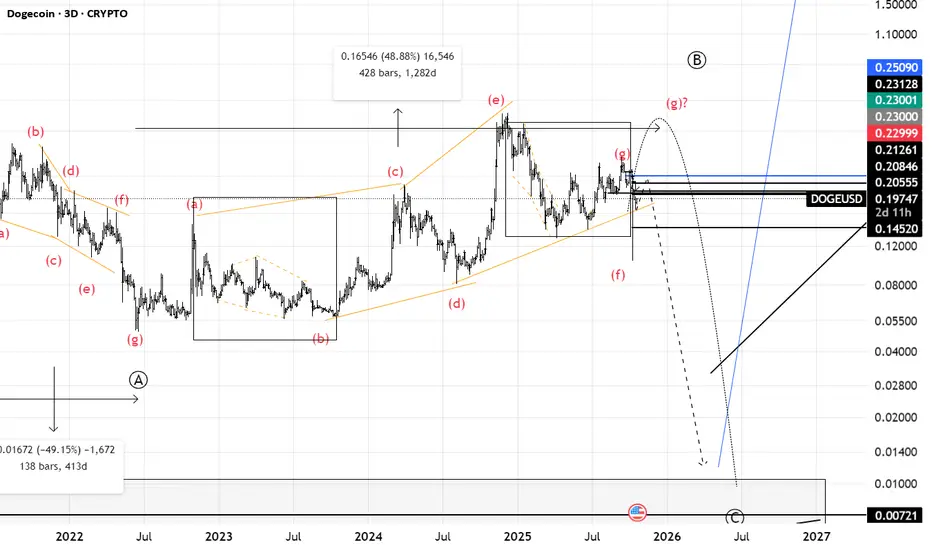
Doge(based on NEo wave)I think Its gonna be a flat and some how we will see a very strong bearish wave to 0.01$!
I dont see any bullish waves for long terms.
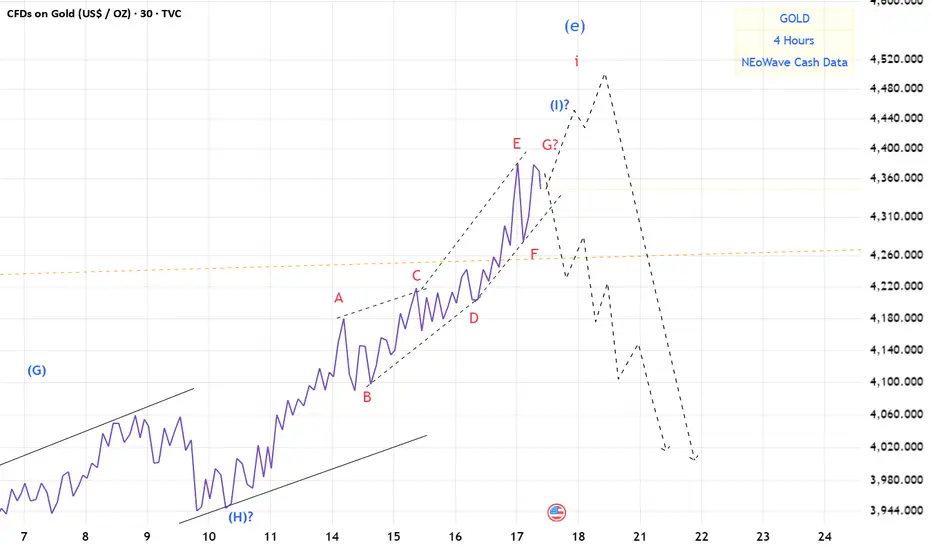
Gold(based on NEo wave)maybe here is the end of wave i.
based on Dow theory good news on top.
crazy people are buying gold.
I think soon we will see crash of gold.
market will not be bullish forever.
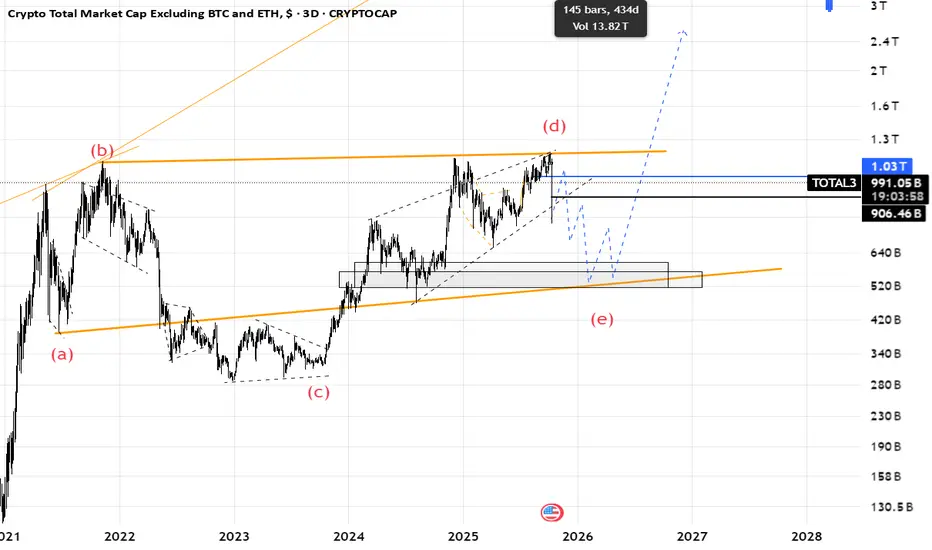
Total3(based on NEo wave)I thought wave (e) is finised but I was wrong.
now I think its the start of wave (e) and we should afraid of altcoins.
when wave (e) is finished altcoins will start to pump.
every upward is a chance to sell.
there is another scenario that I will share it on next post.
BTC(based on NEo wave)there is a good possibility for the irregular flat.
I think 2-3 month we will see the red market
ETH(based on NEo wave)stop loss touched and now there are 2 ways for eth.
we need a post pattern confirmation for bullish wave.
or there is an x wave an correction stills go on.
USDT.D(based on NEo wave)The e wave that I wanted made a descending triangle.
we should wait for it becouse it may make an x wave or a post pattern.
Gold(based on NEo wave)gold is at the end of bull run and its time to sell it on high prices.
after this waves finished I think 2700$ will touch in 2 years later.
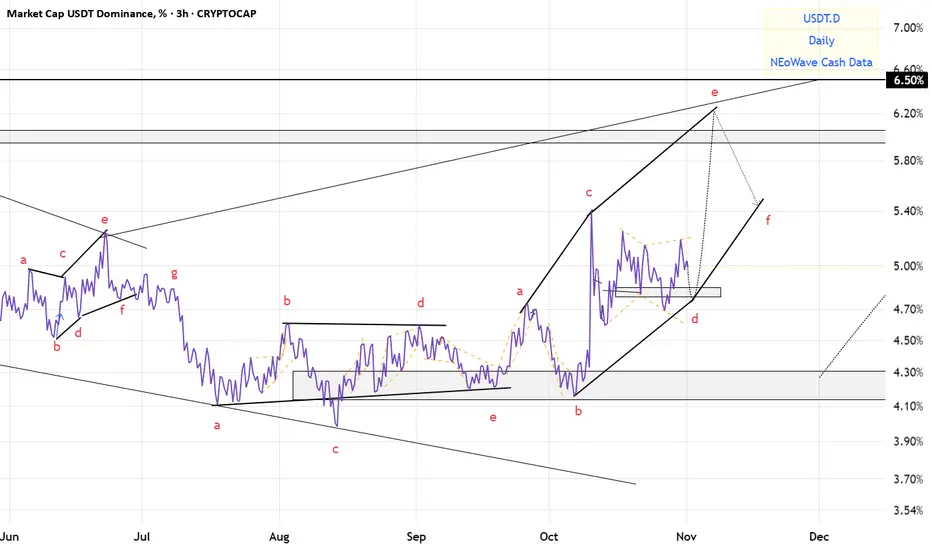
USDT.D(based on NEo wave)the bigger degree is a huge triangle and also wave E is a triangle with abcd waves which all are diametrics.
I hope wave e break the curse and change the pattern.
ETH(based on NEo wave)soon eth will start a temporary correction and goes for higher bullish waves.
it is the last chance to buy it.
Stop loss is 3800.
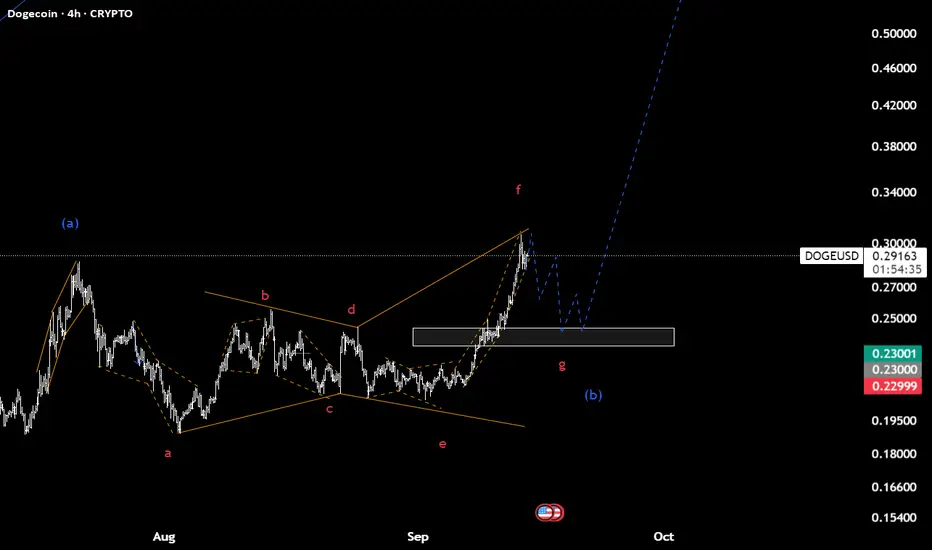
Doge(based on NEo wave)according to last counting of doge, under 0.23$ it means its a bow-tie diametric and it takes about 1 more week for correction.

Doge(based on NEowave)wave g of diametric shown as a flat and wave 5 of c is finishing the downtrend.
soon we should see a heavy bullish wave.
I think 0.23 is good for stop loss.
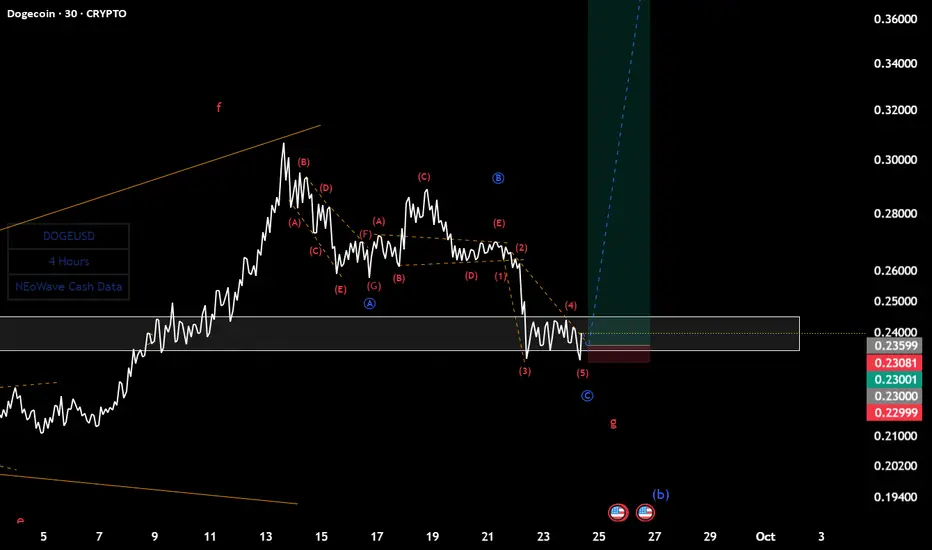
Doge(based on NEo wave)wave (b) is at the end and last chance to buy in low price.
I think a heavy bullish wave is coming and you can see targets on cycle analysis which I reply on that.