$NLFX Netflix buy?Found many times support on the 0.618 fib
Could go and test the 0.786 around $380
Little chance for a dip to around $360 to retest trend line and 50ma
Would only buy more then :)
Netflixlong

NFLX HAS NO MORE VOLUME TO CONTINUE UP - 310 TARGET NEXTVolume is getting lower and lower. 5 waves within the C is finished and we have a 1:1 extension of A-B. That means we are nearing us a end of the little long run we had.
My target for this mini short is 310
Keeping a SL at 358,5 would be the best, as there is a slight chance of a 1.272 extension.
After that we should see a drop to the above target.

A LOOK AT WHY NETFLIX IS GOING TO HIT 162 USD Since we already had a ABC downtrending. We got our corrective wave up hitting near the 0.618-0.65 extension. (350-355)
I expected that we would encounter some sort of resistance there as corrective waves usually end there.
By doing a simple RSI 4H analysis, we can see that we have a bearish resistance at the top of the RSI, which suggest we should expect a downward movement. We should see the RSI hitting the bullish divergence, marked as a blue line.
We can also see that MACD has been losing volume over time, and that the first candle started appearing for a bearish outcome.
I expect that we should see a 162 USD Netflix price very soon.

Netflix Stock Analysis:Bulls Cannot be Stopped...Netflix’s stock analysis for today is examined using a 6 hour timeframe. Attention is paid in particular ~6 months of market action from a high of $419.75 July 18, 2018 to current date.
Retracement in the bullish trend from $419.75 up to ~$232.19 saw the price of Netflix break below not only its long term bullish trendline, but also below the bearish channel as indicated on the chart...both of which indicate further downside potential.
Price between $249.18 and $227.87 where a rising window does exist however did provide a floor for the price of Netflix which was followed by the current bullish swing.
Termination of bearish momentum and also recovery of price above its major trendline and also breaking above the upper boundary of the bearish channel currently both imply higher prices with the minimum price expectation for Netflix being the high made on July 18, 2018 of ~$419.75.
A pull back in price to either the upper boundary of the Bearish channel or a retest of the bullish trendline is plausible after which prices should continue higher.


Netflix BUY BUY BUY In this chart we are looking at Netflix on the daily timeframe, you can see that although price is in a downtrend it is also coming down and testing some very strong support, the price has tested and bounced off this support before ( purple circles )
Price is also nearly at the tip of a wedge formation, a breakout of this wedge in a bullish way will see price take off.
Netflix are also due to release Q4 earnings on 17.01.19 after reading positive reports on Netflix IR we are expecting bullish movement.
All trade entry, SL and TP are reserved for our clients.
If you are interested in joining our team then just message us as we give a 2 week FREE trail.

NETFLIX IS FINALLY DONENetflix just completed the whole ABC correction
The 5th just hit the low at 249 USD, and now we will be looking for our target at:
386 USD, where the B is.

NFLX - Weekly and dailyThe weekly shows a potential P5, which indicates a possible turn of the mid-term trend.
And here's a closer look on the daily I stalk for a bigger move to the upside, based on the weekly:
Also, watch that there's a Sine-Wave.
The center of this Sine-Wave (P2) is often a good target besides the Centerline of the Pitchfork.
P!

NFLX - Netflix stretchedBesides many indications I have not drawn in, I see that price is stretched like CL (see link).
Here at the WL (Warning Line) the air is very thin to dive deeper. I think the crew first needs a breather and grab some air.
Therefore I see a high potential for a turn. Even a spurt up to the L-MLH would not surprise me.
P!

Netflix: bottom reachedNetflix shares remain in place after testing the fibonacci EMA support levels!

Netflix Time Anomaly is working hardAs you can see the MACd is brutal up paralel with two lines. it is uptrend. Yesterday I made a videoconferency with hungarian guests. If you like it I found out Time anomaly. So it is working. 5% . support and resistance also work in this chart.

NETFLIX... Support found!Using 4H candles, I observe a support found. If it is crossed, I have shown where is the next support.
If this is an inflection point, next resistance is indicated too.
I will be updating this chart.


NFLX Looking for a dip to go LongAscending triangle, support buying up the dips, and the overall strength of NFLX lead us to believe there's more room for price appreciation, back up towards the ATH.
The last 2 buy signals were given over a month ago, but we are still in that same range. In a case like this where you know current range is a decent time to enter, but perhaps there's no signal on the Daily chart. We suggest going down to a 4H or 2H chart to get the best localized entry. I will post below a chart of this past few months range on the 4HR timeframe to show you.
As you can see on the 4HR the indicator picked the dip that happened mid-August for entry.
With a weak top signal formed on the daily, we can expect to see a nice area to go long soon (within the next 7-10 days).
Trials are available, and membership doesnt come with only indicators. You get one on one trading advice, web based tools, telegram alerts and much more! Trials are available, like,follow and direct message for a trial!

Netflix Elliott Wave View: Dips Expected To Remain SupportedGood Afternoon Traders,
NFLX short-term Elliott wave analysis suggests that the pullback to $335.67 low ended blue wave (2) pullback. The internals of that pullback unfolded as a Flat correction. Where red wave B bounce ended in 3 swings at $374.09 high.
Down from there, red wave C unfolded in 5 waves impulse structure. And the initial decline to $360.01 low ended black wave ((i)). Up from there, black wave ((ii)) ended at $364.50, black wave ((iii)) ended at 341.60. A bounce to $350.54 high ended black wave ((iv)). Then finally a move lower to $335.67 low ended black wave ((v)) and completed red wave C of (2).
Up from there, the stock is showing higher high sequence favoring more upside within blue wave (3). Where the initial rally to $374.09 high ended black wave ((i)). The internals of that rally higher unfolded as 5 waves structure with lesser degree cycles showing sub-division of 5 waves structure in its leg higher i.e blue wave (i), (iii) & (v).
Down from $374.09 high, the stock did a 3 wave pullback as zigzag correction & completed the black wave ((ii)) at $350 low. After reaching the blue box at $356.01-348.90 100%-161.8% Fibonacci extension area of blue wave (a)-(b).
Above from there, the stock has made a new high above $374.09 high suggesting that next leg higher can have started. Near-term, while dips remain above black wave ((ii)) low ($350) and more importantly above $335.67 low the stock is expected to resume the upside.
Alternatively, if it breaks below black wave ((ii)) low ($350) then it can be doing a Flat correction from $374.08 high still within black wave ((ii)) before resuming higher again provided the pivot at $335.67 low stays intact.
We don’t like selling it and prefer more upside against $335.67 low.

Netflix Elliott Wave View: Further Upside Expected.Hello Traders,
NFLX short-term Elliott wave view suggests that the decline to $310.84 low ended red wave “IV” pullback. Up from there, red wave “V” can have started but a break above $423.21 6/21/2018 high remains to be seen for final confirmation. Above from $310.84 low, the rally higher $374.57 high ended blue wave (1). The internals of that rally unfolded in 5 waves structure.
Up from $310.84 low, the initial rally to $346.27 high red 1 in lesser degree 5 waves. The pullback to $337.65 low ended red wave 2. Then the rally higher towards $366.40 high ended red wave 3.
Down from there, the pullback to $359.69 low ended red wave 4. Finally, a rally higher to $374.57 high ended red wave 5 & also completed blue wave (1).
Below from there, it finished an Elliott wave Flat correction at 09/05 low (335.86) which also completed blue wave (2) pullback. Above from there it ideally should extend higher in blue wave (3). As long as the pivot at 310.84 stays intact it should extend higher. We don’t like selling it and prefer more upside against $310.84 low.

Netflix Elliott Wave View: Pullbacks Should Remain SupportedHello Traders,
NFLX short-term Elliott wave view suggests that the decline to $310.84 low ended red wave “IV” pullback. Up from there, red wave “V” can have started but a break above $423.21 6/21/2018 high remains to be seen for final confirmation. Above from $310.84 low, the rally higher $376.81 high ended blue wave (1). The internals of that rally unfolded in 5 waves impulse structure with the sub-division of 5 waves structure in lesser degree cycles in red wave 1, 3 & 5.
Up from $310.84 low, the initial rally to $341.50 high red Minor 1 in lesser degree 5 waves. The pullback to $334.30 low ended red wave 2. Then the rally higher towards $374.49 high ended red wave 3 in lesser degree 5 waves structure.
Down from there, the pullback to $363.54 low ended red wave 4. Finally, a rally higher to $376.81 high ended red wave 5 & also completed blue wave (1). Currently, the stock is doing a pullback in blue wave (2) & expected to unfold in lesser degree Zigzag correction before the rally resumes again provided the pivot at $310.84 low stays intact. We don’t like selling it and prefer more upside against $310.84 low.

NETFLIX BULLISH TRENDNetflix have stated some very interesting news and forecasts for the rest of this year, based on the fundamentals and technical analysis we can only see this stock going 1 way in the future.

Scalping Netflix from a tech dip With internet video consumption increasing Netflix is in a pretty strong position with only potential positive news that can prop it up. Therefore a market wide tech dip is an opportunity for a short term trade to go long and sell at the previous high


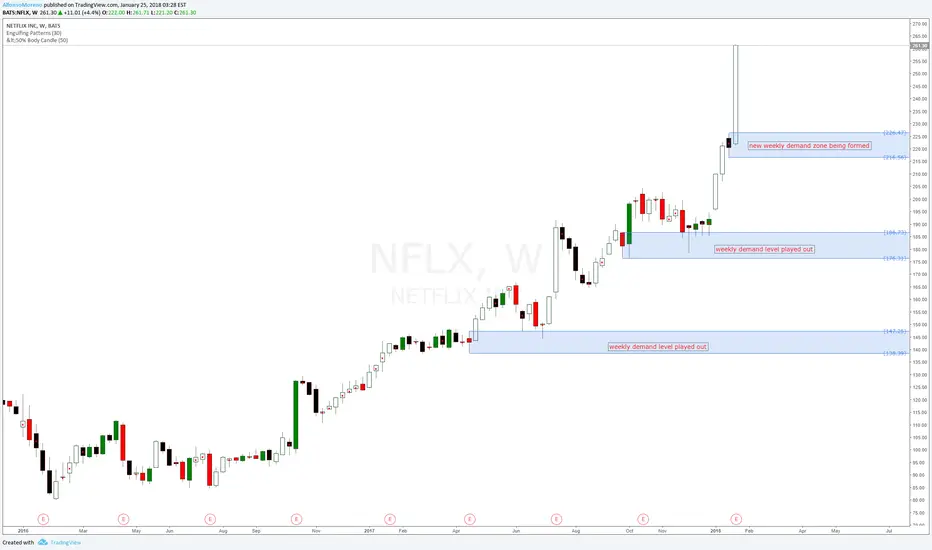
Netflix #NFLX new weekly demand levelsNetFlix #NFLX american stock is creating a brand new weekly demand level around 226.50. Previous weekly demand imbalances around 186 and 147 have played out nicely. Waiting for a retracement to this potential new imbalance to go long again.
Long bias with brand new demand levels being created at all time highs scenarios.
NFLX @ 1h @ prices between 130 & 140 buyback price areaTake care
& analyzed it again
- it`s always your decision ...
(for a bigger picture zoom the chart)
Best regards :)
Aaron

