GME Market Strategy: Risk-Managed Swing to Resistance🚨 GME: GameStop's Great Heist! 🎮💰 Bullish Swing/Day Trade Plan
Asset: GameStop Corporation (GME)Market: NYSE (Stock)Strategy: Swing/Day Trade with a "Thief's Layered Limit Order" Approach 😎
Get ready, traders! We're about to pull off a bullish heist on GameStop (GME) with a slick, calculated plan to outsmart the market! 📈 This setup is packed with technical firepower and a cheeky vibe to keep it fun yet professional. Let’s dive into the Thief’s Wealth Strategy Map and steal some profits! 🕵️♂️
📊 Technical Breakdown: Why GME is Ripe for the Taking
Our bullish setup is backed by a rock-solid technical foundation. Here’s the intel:
🔥 382 EMA Breakout: GME has smashed through the 382-period Exponential Moving Average, signaling strong bullish momentum. This breakout is our green light for action! 🚦
💥 Accumulation Zone Pressure: Buyers are stacking up in the accumulation zone, pushing prices upward like a crew of bullish bandits ready to raid the market.
🕯️ Heikin Ashi Reversal Candle: A gorgeous bullish Heikin Ashi candle has emerged, screaming BUYING POWER and confirming the trend reversal. The bulls are in control! 🐂
🗝️ Thief’s Edge: We’re using a layered limit order strategy to sneak into the market at multiple price points, maximizing our entry precision.
🕵️♂️ The Thief’s Entry Plan: Layered Limit Orders
This isn’t your average “buy and pray” strategy. We’re using a layered limit order approach to enter like sneaky market thieves. Set your buy orders at these levels:
🪙 $24.00
🪙 $24.50
🪙 $25.00
🪙 $25.50
🪙 $26.00
Pro Tip: Feel free to add more layers based on your risk appetite and account size. The more layers, the merrier the heist! 😜 You can also enter at any price level within this range if you prefer a single strike. Just keep it sharp and calculated!
🛑 Stop Loss: Protect Your Loot
🛡️ Set your stop loss at $23.00 to guard against unexpected market traps. ⚠️
Note: Dear Ladies & Gentlemen (Thief OGs), this is my suggested stop loss, but it’s your heist! Adjust it to suit your risk tolerance. Trade smart, and don’t get caught by the market cops! 👮♂️
🎯 Target: Cash Out Before the Barricade!
🎰 Our profit target is $31.00, where a police barricade zone (aka strong resistance) awaits. This level is flagged as overbought with a potential trap for greedy thieves. 🪤 Escape with your profits before the market clamps down!
Note: Thief OGs, this is my target, but you’re the boss of your trades. Take profits at your own discretion and secure the bag! 💸
🔗 Related Pairs to Watch (Correlated Assets)
To maximize your market intel, keep an eye on these correlated assets (all in USD):
🎥 NYSE:AMC Entertainment (AMC): Another meme stock darling, often moving in tandem with GME. Watch for similar bullish setups or divergences.
📊 AMEX:SPY (S&P 500 ETF): GME’s wild swings can be influenced by broader market sentiment. If SPY is bullish, GME’s momentum could get an extra boost!
📱 NYSE:BB (BlackBerry): Another retail-favorite stock with potential for correlated volatility. Check for breakout patterns here too.
Key Correlation Points:
🚀 NYSE:GME and NYSE:AMC : Often ride the same retail-driven waves, especially during short squeezes or social media hype.
⚖️ AMEX:SPY Influence: If SPY shows weakness, GME’s bullish momentum might face resistance. Stay alert!
🔍 NYSE:BB as a Signal: If BlackBerry is pumping, GME might follow suit.
📝 Final Notes for the Heist
This is a high-octane, bullish setup designed for swing or day traders with a taste for calculated risk. The Thief’s Layered Limit Order Strategy gives you flexibility to enter the market like a pro, while the technicals (382 EMA breakout, Heikin Ashi, and accumulation pressure) provide a solid foundation. 🏦
Stay sharp, manage your risk, and don’t get greedy—escape with your profits before the market throws up a barricade! 🚓
✨ “If you find value in my analysis, a 👍 and 🚀 boost is much appreciated — it helps me share more setups with the community!”
#Hashtags: #GME #StockMarket #SwingTrading #DayTrading #Bullish #TechnicalAnalysis #TradingStrategy #MemeStocks
Newyorkstocexchange

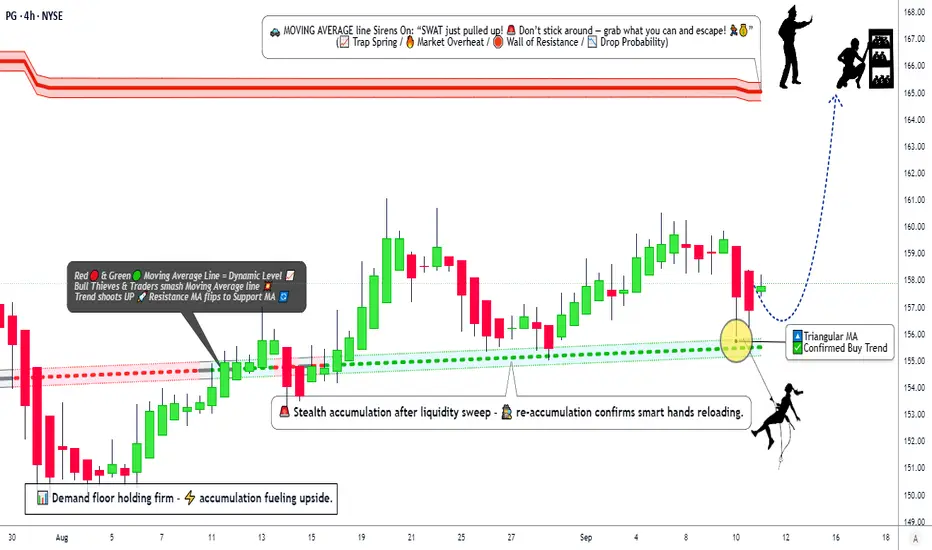
Is Procter & Gamble Setting Up for a Strong Bullish Reversal?🚨 P&G Bullish Master Plan: Steal Profits with the Thief Strategy! 🤑
📊 Asset: Procter & Gamble (PG) – Swing/Day Trade Setup📈 Date: September 11, 2025🎯 Plan: Bullish Triangular Moving Average Pullback – Confirm the Buy Trend!
🕵️♂️ Why the Thief Strategy for PG?
The Thief Strategy is a clever, layered limit-order approach designed to capitalize on PG’s bullish momentum while navigating market traps. Backed by technical signals, solid fundamentals, and a cautious market sentiment, this plan aims to sneak in profits before the “police barricade” (resistance) stops the rally.
Here’s why PG is ripe for a steal:
Technical Edge 🧠: PG’s price action shows a bullish pullback within a triangular moving average setup, signaling a continuation of the buy trend.
Fundamental Strength 💪: PG’s robust balance sheet and consistent dividends make it a defensive powerhouse, even in uncertain markets.
Market Sentiment 😊: Retail traders are bullish, while institutions remain cautious, creating a contrarian opportunity for savvy thieves.
Fear & Greed Index 😨: At 39 (Fear), the market’s caution suggests undervaluation, a prime setup for a bullish swing.
📈 PG Stock Snapshot – September 11, 2025
💰 Price Overview
Daily Range: $157.05 - $158.18
Previous Close: $157.35
Market Cap: $372.16B
Yearly Range: $149.91 - $180.43
😊 Investor Sentiment
Retail Traders: 51.6% Bullish 🟢 (Positive buying momentum)
Institutional Traders: 49.3% Bearish 🔴 (Cautious, mixed outflows)
Overall Mood: Neutral, leaning slightly bearish due to institutional caution
😨 Fear & Greed Index
Current Level: 39 (Fear) 😟
Insight: Indicates cautious market sentiment, with fear slightly dominating greed, suggesting potential undervaluation for contrarian traders.
📈 Fundamental Score: 7.6/10 ✅
Strengths: Strong liquidity, operational efficiency, and reliable dividends.
Concerns: Inventory turnover (60.62 days), negative cash flow growth (-8.77% YoY).
🌍 Macro Score: 6.8/10 ⚖️
Tailwinds: Stable consumer goods demand supports growth.
Headwinds: Tariff policies and geopolitical tensions may pressure global sales. Fed’s steady rates (4.25%-4.50%) could squeeze margins.
🐂🐻 Market Outlook: Neutral (Hold) ⚖️
Bull Case: Strong fundamentals, retail buying, and dividend reliability support long-term stability 🟢.
Bear Case: Institutional outflows and macro uncertainties suggest short-term caution 🔴.
🎯 Key Takeaway: PG is a solid long-term investment with strong fundamentals, but short-term caution is advised due to mixed sentiment and macro risks. Monitor upcoming earnings and tariff developments. 🚨
🕵️♂️ Thief Strategy: Bullish Plan for PG
Plan Overview: Use a layered limit-order strategy to “steal” profits on PG’s bullish pullback within a triangular moving average setup. This approach maximizes entries while managing risk in a volatile market.
📥 Entry:
Layered Limit Orders: Place multiple buy limit orders at $156.00, $157.00, $158.00, and $159.00 to capitalize on pullbacks.
Flexibility: Adjust layers based on your risk tolerance and market conditions. Choose any price level within the $156–$159 accumulation zone for entry.
Why? The triangular moving average pullback confirms bullish momentum, with support at $156–$159 aligning with Fibonacci clusters and institutional buying zones.
🛑 Stop Loss:
Thief SL: Set at $154.00 to protect against a breakdown below key support.
Note: Adjust your stop loss based on your risk tolerance and strategy. The $154 level is a suggestion, not a mandate—manage your risk wisely, Thief OGs!
🎯 Target:
Primary Target: $165.00 (strong resistance zone).
Why? $165 aligns with the first resistance level and overbought conditions, where a “trap police barricade” may halt the rally. Take profits early to escape with your stolen gains!
Note: Set your own take-profit levels based on your strategy. Don’t blindly follow the $165 target—secure profits at your discretion.
⚠️ Risk Management:
Use tight risk management with layered entries to average into positions.
Consider partial profit-taking at $160 and $165, holding runners for $172 if momentum sustains.
Monitor macro developments (e.g., tariffs, Fed policy) for potential volatility.
🔍 Technical Breakdown: Why Bullish?
Triangular Moving Average: PG’s price is respecting a bullish TMA structure, with a recent pullback confirming support at $156–$159.
Fibonacci Alignment: The $156–$159 zone aligns with a key Fibonacci cluster, reinforcing the buy zone.
Momentum Indicators: Stochastic RSI is in the bullish zone, and Rate of Change (ROC) shows increasing buying interest.
Institutional Confluence: Institutional models signal a buy with a $159.98 target, supported by technical exhaustion of the recent correction.
🧠 Why This Plan Works?
Technical Precision 🎯: The TMA pullback and Fibonacci confluence provide a high-probability setup for a bullish swing.
Sentiment Edge 😊: Retail bullishness (51.6%) contrasts with institutional caution (49.3% bearish), creating a contrarian opportunity for short-term gains.
Fundamental Backbone 💪: PG’s 7.6/10 fundamental score highlights its resilience as a consumer staple, ideal for defensive plays.
Macro Awareness 🌍: Despite tariff risks, stable consumer demand supports PG’s long-term stability, making it a safe bet for swing/day trades.
Fear & Greed Advantage 😨: A Fear reading of 39 suggests undervaluation, aligning with Warren Buffett’s “be greedy when others are fearful” philosophy.
💸 Related Pairs to Watch ( AMEX:USD )
Monitor these pairs for correlated market moves:
AMEX:XLP (Consumer Staples Select Sector SPDR Fund): Tracks consumer staples like PG. Bullish XLP supports PG’s upside.
NYSE:KO (Coca-Cola): Another defensive staple with similar market dynamics.
NYSE:WMT (Walmart): Retail giant tied to consumer goods demand.
AMEX:GLD (Gold): Safe-haven asset for macro risk hedging.
✨ “If you find value in my analysis, a 👍 and 🚀 boost is much appreciated — it helps me share more setups with the community!”
#TradingView #PG #Bullish #ThiefStrategy #SwingTrading #DayTrading #TechnicalAnalysis #FearAndGreed #ConsumerStaples #StockMarket
⚠️ Disclaimer
This analysis is for educational purposes only and does not constitute financial advice. Trading involves risk, and past performance does not guarantee future results. Always conduct your own research and manage risk according to your financial circumstances.
Dell Stock Idea – Bullish Outlook With Layered Entries💰 Dell Technologies INC: The Great Stock Market Heist Plan (Swing/Day Trade) 💰
🎯 Asset: Dell Technologies INC (DELL)🎭 Vibe: Bullish Bandits on the Move! The Simple Moving Average (SMA) is flashing green, confirming a buy trend, and the big institutional players are piling in. Time to join the heist with the market's heavy hitters! 🚀
📜 The Heist Plan: Bullish Breakout with a Thief’s Flair
🔍 Why DELL?The SMA is screaming "BUY," and institutional buyers are sneaking in like pros. We’re tailing the big players with a slick Thief Layering Strategy to maximize our loot. Here’s how we execute this caper:
Entry: 🕵️♂️ Thief Layering StrategyDeploy multiple buy limit orders to stack the deck in your favor:
🎯 $120.00
🎯 $122.00
🎯 $124.00
🎯 $126.00
Pro Tip: Add more layers based on your risk appetite and market conditions. Be the sneakiest thief in the game! 😎
Stop Loss (SL): 🚨 $118.00Set this SL after the breakout at the mentioned price levels to protect your stash. Dear Ladies & Gentlemen (Thief OGs), adjust your SL based on your strategy and risk tolerance. This isn’t a one-size-fits-all heist—own your escape plan! 🏃♂️
Targets: 🤑 Police Barricade Ahead!Watch out for strong resistance and overbought zones where traps lurk. Escape with your profits at:
Primary Target: $134.00
Secondary Target: $142.00Note: Dear Thief OGs, these are suggested targets. Grab your loot when it feels right—your heist, your rules! 💸
⚠️ Thief’s Code of Honor
Dear Ladies & Gentlemen (Thief OGs), I’m not here to dictate your SL or TP. This is your heist—make your moves and take your profits at your own risk. Stay sharp, stay safe, and don’t get caught! 😜
🔗 Related Pairs to Watch
To make this heist even smoother, keep an eye on these correlated assets (all in USD):
HP Inc. ( NYSE:HPQ ): Moves in tandem with DELL as a tech hardware peer. If HPQ is pumping, it’s a good sign for DELL’s bullish run.
NVIDIA ( NASDAQ:NVDA ): Tech giant with strong correlation to DELL due to AI and data center trends.
NVDA’s strength could fuel DELL’s breakout.
S&P 500 Index ( AMEX:SPY ): DELL often rides the broader market wave. If SPY is bullish, it’s a tailwind for our heist.
Key Correlation Insight: DELL’s performance is tied to tech sector momentum and institutional buying in AI/data center stocks. Watch NVDA and HPQ for confirmation of DELL’s bullish trend, and keep SPY on your radar for market sentiment.
🛠️ Why This Setup Works
✅ Technical Confirmation: The SMA signals a clear bullish trend, giving us the green light.
✅ Institutional Backup: Big players are entering, so we’re riding their coattails.
✅ Layered Entries: Multiple limit orders reduce risk and increase flexibility.
✅ Defined Escape Plan: Clear SL and TP levels keep us ahead of the market’s “police.”
📝 Disclaimer
This is just a fun vibe and not financial advice! Trading is risky, and you should always do your own research and consult with a professional before making any moves. Stay sharp, Thief OGs! 😎
✨ If you find value in my analysis, a 👍 and 🚀 boost is much appreciated — it helps me share more setups with the community!
#TradingView #DELL #StockMarket #SwingTrading #DayTrading #Bullish #ThiefStrategy #TechnicalAnalysis
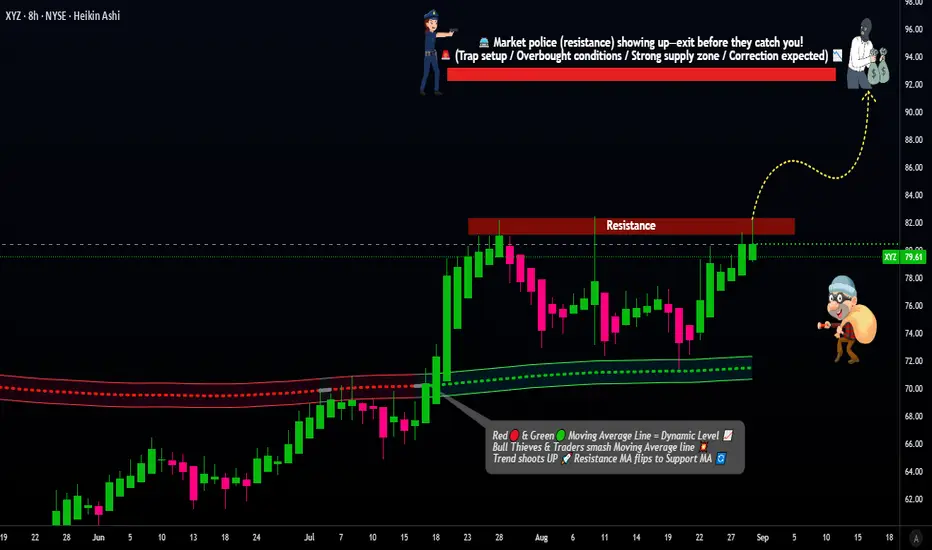
XYZ Bullish Setup: Pending Entry & Target Strategy!📌 Asset & Plan
XYZ (Block, Inc.) NYSE | Swing/Day Trade
Plan: Bullish 💹 (Pending Order Setup)
Breakout Entry: Near $83.00 ⚡ (Set alerts to catch the breakout!)
🧩 Thief-Style Layer Strategy
Multiple limit layer entries after breakout: $82.00 / $80.00 / $78.00
Scale your positions according to your risk appetite and strategy 📈
Stop Loss: $74.00 (adjust as per your risk) ⚠️
Target: $92.00 🏁
📊 Real-Time Market Snapshot (Sep 1, 2025)
Current Price: $79.64
52-Week Range: $46.53 - $98.92
🧠 Investor Sentiment
Retail: Moderately Bullish (60% Greed) 🟢
Institutional: Cautiously Optimistic (55% Greed) 🟡
Fear & Greed Index: Neutral → Greed (58/100) 📊
💹 Fundamental & Macro Highlights
Fundamentals (6.5/10) ✅
Undervalued by ~29% (Intrinsic Value: $111.64)
EPS Growth (2026 Est.): +39.49% YoY
Revenue Growth (2025 Est.): +2.92% YoY
Strong solvency & healthy gross margins
Macro Environment (6/10) 🌍
Market Volatility: Low
Safe Haven Demand: Moderate
Interest Rates: Stable (Fed rate cuts expected late 2025)
🐂 Overall Market Outlook
Bullish Score: 65% 🟢 (S&P 500 inclusion & strong analyst targets)
Bearish Risks: 35% 🔴 (slowing revenue growth & competition pressures)
💡 Bottom Line
XYZ is undervalued with moderate bullish sentiment. Use layered entries to optimize risk/reward, set alerts for breakout, and monitor macro factors. 🚀
#NYSE #StockTrading #SwingTrade #DayTrade #BullishSetup #BreakoutAlert #LayerStrategy #XYZStock #TechnicalAnalysis #MarketInsights #TradingIdeas
ALNY, LTH & ZETA - The momentum may drive prices to new heights!Alnylam Pharmaceuticals
The stock price has encountered several rejections around the 212 level, leading to subsequent corrections.
After establishing a Double Bottom pattern, the price attempted to reverse the downward trend but was unable to do so, facing rejection at the 200 level.
Consequently, the stock underwent another correction.
Following this, the price entered a consolidation phase, forming a Box pattern for a while.
In a surprising turn, the price gapped up significantly and broke through its former strong resistance area, remaining above it.
Following a brief pullback, the price resumed its upward trajectory, supported by solid trading volume.
Life Time Group Holdings
Following a rejection around the 22.5 level in November 2021, the stock experienced a significant decline, dropping to just 8.75.
Subsequently, the price began to rise again, eventually returning to its previous strong resistance level after a lengthy climb. However, it struggled to break through that barrier and faced another substantial drop.
During this downturn, the stock hit a low around 11.3 and then navigated through numerous fluctuations, leading to the formation of a Symmetrical Triangle pattern on the chart.
After successfully breaking out of this pattern to the upside, the price surged and managed to overcome the resistance level.
If the stock can hold onto this level, we might see even more upward momentum in the days ahead.
Zeta Global Holdings
The stock price had been consolidating within a Box Pattern before breaking free.
Since that breakout, the stock has experienced a steady uptrend, marked by higher highs and higher lows.
Amid this upward movement, a Cup & Handle pattern formed, signaling that the trend is likely to persist.
Following the breakout, the price is now climbing higher, supported by a significant increase in trading volume.

Moody's Corporation WCA - Inverted H&S
Company: Moody's Corporation
Ticker: MCO
Exchange: NYSE
Sector: Financial Services
Introduction:
Hello and welcome to our technical analysis! Today we're examining the weekly chart of Moody's Corporation on the NYSE. A fascinating pattern within a pattern is currently unfolding, with an inverted head and shoulders formation potentially serving as a bottom reversal.
Inverted Head and Shoulders Pattern:
An inverted head and shoulders pattern typically serves as a bullish reversal pattern, signifying the transition from a downtrend to an uptrend. It's characterized by three successive lows with the middle low (the head) being the deepest and the two other lows (the shoulders) being shallower.
Analysis:
Moody's previous trend was clearly bearish, interrupted by a consolidation phase taking the form of an inverted head and shoulders. This pattern has been developing over 392 days.
Although the usual symmetry between the shoulders is absent, the right shoulder sitting higher than the left is typically a positive sign. Intriguingly, the right shoulder itself seems to be forming as a smaller head and shoulders pattern, all occurring above the 200 EMA.
The horizontal neckline of this pattern is at $325. A breakout above this level could provide an opportunity for a long position entry. Upon a successful breakout, our projected price target would be at $418.30, translating into a potential price rise of approximately 28.83%.
Conclusion:
The weekly chart of Moody's Corporation presents an interesting pattern within a pattern, where a short-term head and shoulders pattern forms within a longer-term inverted head and shoulders pattern. A confirmed breakout above the neckline could offer a promising long position entry.
As always, it's important to conduct your own due diligence and employ appropriate risk management strategies before making any investment decisions. Not financial advice
Thank you for joining this analysis. If you found it insightful, please like, share, and follow for more market updates. Happy trading!
Best regards,
Karim Subhieh

NASDAQ in Bearish Trend for the dayNasdaq on fib retracement levels showing downwards movements to at least 50%

US30Dow jones todays Outlook , Price did break the psychological level 35750 , and confirms the bullish momentum by forming double bottoms confluenced by the engulfing above the 0 intraday fib , waited for price to break that previous supply to be sure of my buyers did that formed the same bullish reversal , next stop @ 36000 , i anticipate a 150 pip move

Is SalesForce making a highHello Traders, SalesForce is a nice sell because it's hitting a large volume of sell orders right now. A good candle information at the big order zone will be the trigger for the sell. I will be posting updates if necessary. Thank you.

NYSE COMPOSITE INDEX (NYA) WeeklyDates in the future with the greatest probability for a price high or price low
