NIL Looks Bearish (12H)Based on the signals we see on the chart, it seems that NIL has entered another bearish wave.
According to the chart, this symbol appears to be within a diametric pattern and has just entered wave E, which itself is a bearish wave.
If the price makes a pullback to the red zone, it would present a good opportunity for sell/short positions.
This outlook would only be invalidated if a daily candle closes above the invalidation level.
For risk management, please don't forget stop loss and capital management
When we reach the first target, save some profit and then change the stop to entry
Comment if you have any questions
Thank You
NILUSD

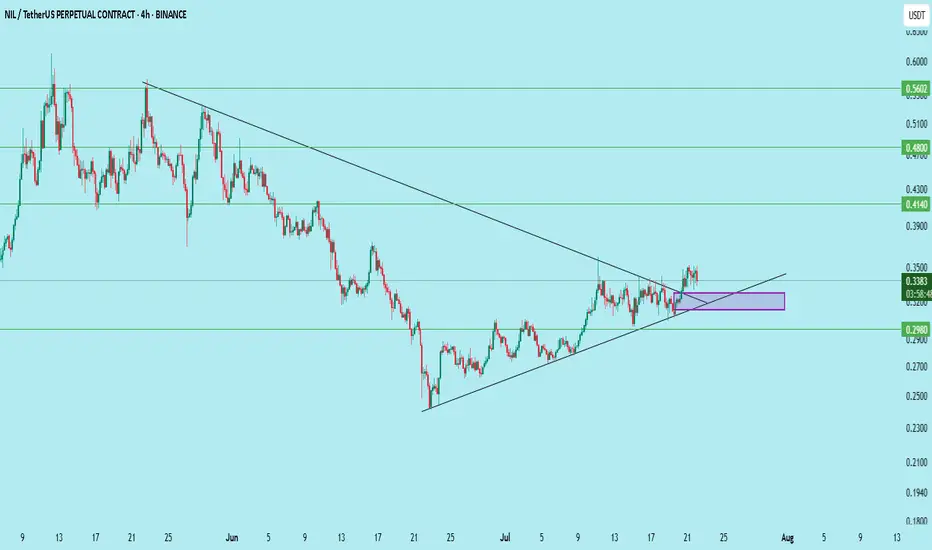
$NIL/USDT – Bullish Breakout Retest Setup (4H Timeframe)NIL has successfully broken its descending trendline and is now retesting the confluence zone of:
– Breakout support
– Ascending wedge
– Demand zone (rectangle)
Entry: 0.312–0.325
Stop Loss: Below 0.2971
Targets:
• 0.414 (+25%)
• 0.480 (+44%)
• 0.560 (+68%)
This is a textbook breakout–retest–continue pattern.
Spot buyers can scale in around the purple box.
Close below 0.2971 invalidates the setup.
DYOR. Not financial advice.
NIL ANALYSIS (4H)The NIL correction started from the point we marked as Start on the chart.
This correction appears to be a Diametric, and it seems we are currently in wave E of this pattern. The price is expected to follow the path indicated by the arrow.
A daily candle close above the invalidation level will invalidate this analysis.
invalidation level: 0.521$
For risk management, please don't forget stop loss and capital management
When we reach the first target, save some profit and then change the stop to entry
Comment if you have any questions
Thank You
