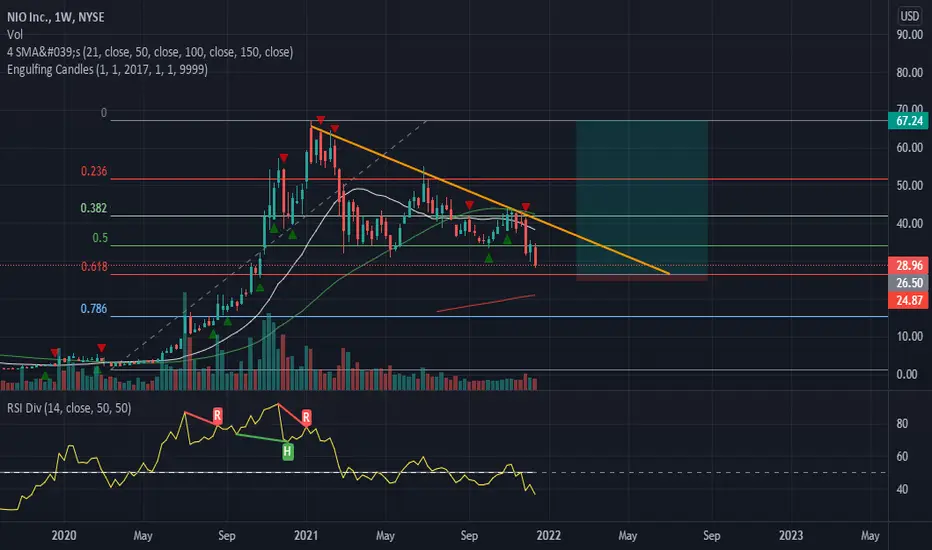
NIO LONG (DCA)Re-entry here for me on NIO after T.P at 37 and 45.
Looks a good area risk vs reward imo with some bullish/bottom indicators flashing. Money flow, MACD, RSI and trading around key long term fib (potential downside to $25 but plenty of potential upside).
** NOT TRADING ADVICE **
Niolong

My NIO weekly chartJust looking at the chart NIO looks weak AF right now.
Im a beginner soo please dont take this too serious.
have a great 2022!

NIO - mid term overviewNIO is in consolidation for long time after big upwards price action in form of falling wedge/channel.
Currently sitting on weekly support with oversold condition on RSI.
Notice that NIO stock price rise after every visit to/near oversold area, which offers good bounce trade setup here.

NIO falling wedgeFor NIO I’m seeing a potential long term falling wedge. I’m going to play this with a tight stop as we are at the potential bottom of the wedge. This is a longer swing play

NIO - POSSIBLE TRADEHello there,
As you can see in the chart NIO is approaching the 0.618 Fib level, and a previous support around 26$
We will enter this trade once NIO touched the 0.618 Fib level and bounce and we will ride all the way up.
Our SL will be breaking this level.
Our Target: Sky is the limit.
Cheers.
NIO Triple Top Then RetestA triple top is evident on NIO
The first top caused a test on 4.618, this will likely act as a support with the current top that has formed and contributing to the breakdown
Entry at 4.618

Chinese 'Tesla' is going to explode!NIO inc. a Chinese electromotive company is about to grow immensely. It almost finished its correction since january 2021.
Best opportuniny to long term invest after squeezing this trendline and breaking it.
The price should go to at least all time high price.
NIO capitalization at the moment (November 10, 2021) is 67 bil, there's plenty of room to make x10 at least!

NIO Upside!NIO is completing the 4th wave in 7 a swing sequence. Price might end up at about $23.20 area as long as we don't got below $16.48 we should see a bounce to the upside to new Highs! So we will look for Buys once we have reached the blue box area.

NIO LONGS 📈📈📈Expect LONG on NIO on long-term perspective, from a HTF point of view price is squeezing right now into a bullish triangle that should be broken to the upside way above 40.00 level. For a better long opportunity wait for the price to consolidate above psychological area 40.000 bullish confirmations and go LONG.
What do you think ? Comment below..

$NIO - Bullish Inverted H&S Looks like NIO is currently forming right shoulder. Target $46.5 on breakout.

NIO LONGHi guys! Sharing my thoughts on NIO .
Long term investment based on technical analysis ( SUPPORT, RESISTANCE, FIBONACCI TOOLS and RETRACEMENTS, ELLIOTT WAVES THEORY)
I target the prices with a purple line .
Have a nice day everyone !!! Good luck !!!

NIO Elliot wave detail analysis Nio is currently showing a pendant flag with a break out possibility. The correction impulse had ended on October before the Q3 2021 report and are currently building momentum for a 5 step impulse wave.
Drawing a visible range from the drawback from ATH , the price is currently extremely close to the strongest support for the year.
The ema 20,50,200 further confirm the price is currently at a very right range, showing a promising buying point , they are ready to pull away from each other.
The potential upside gain is more than 50%

NIO: $55 is in Play by Year End Liking NIO going into the santa rally. $55 isn't out of the cards, but it has a lot of supply between 42.29 and 55.15. Pit stops along the way in 6-7 different places. Best case is to slice through 44 and get the momo/fomo crowd into it.

NIO Wycoff Accumulated and Elliot wave theory anaysisNYSE:NIO
This shit is so close to exploding I can't wait. Let me know what you guys think!

$NIO HUGE BREAKOUT COMING??$NIO trading in huge triangle forming on the weekly timeframe. Be patient, wait for the break, and reap the rewards. EVs have been heating up so I wouldn't be surprised if we see a rip to the upside

NIO wave 3 formingNIO LONG
wave 3 seems to be one the way in alliance with equilateral triangles
also NIO wants to test the 100 dollar threshold
not financial advice

$NIO below 30s is a gift posting the 3LNI (3x long nio) chart next
strongest conviction play
how much lower could we go with fundamentals only up

NIO: TSLA SYMPATHY PLAY NIO looking like a good move to $41 is in order this week. Could be a nice 6-8 week swing as well. Lotto idea on chart.

$Nio - investment idea 💡 #NIO has been trading for a while in the demand zone, giving great opportunity for low risk entry. And great target potential. Regardless the fundamental analysis, this is just technical analysis.
From this price I will start buy small positions and buy more with bullish price actions.
❌ - Moving Averages still bearish, price distance to fast ma 0.50% and to slow -17.53%
✅ - The scenario is duble bottom, and bearish butterfly 🦋 pattern.
✅ - MACD
✅ - STOCHASTIC
✅ - Momentum
✅ - RSI Neutral
❌ - Ichimoku very bearish
⏰ - Breakout around: $37
🚦 - Next entries in case if dropped:
- $30
- $23.30
- 18.70
⚠️ - This idea is based on my technical analysis only. Do your research and trade on your own risk!

NIO longNIO is a Chinese car manufacturer, specialising in the design and development of electric vehicles.
Position: long
Entry price: 32.10
Target price: 54.71
Stop loss: 28.5
The RSI indicator is very close to the oversold level. The William Indicator suggests that the market is in the downtrend, but it's a weak signal.
(In the event that the price of NIO doesn't break the support line (red line), the market may go into a phase of uptrend.
No financial advice

NIO INC Daily TimeframeSNIPER STRATEGY
This magical strategy works like a clock on almost any charts
Although I have to say it can’t predict pullbacks, so I do not suggest this strategy for leverage trading.
It will not give you the whole wave like any other strategy out there but it will give you huge part of the wave.
The best timeframe for this strategy is Daily, Weekly and Monthly however it can work any timeframe above three minutes.
Start believing in this strategy because it will reward believers with huge profit.
There is a lot more about this strategy.
It can predict and also it can give you almost exact buy or sell time on the spot.
I am developing it even more so stay tuned and start to follow me for more signals and forecasts.

NIONio Inc (NYSE:NIO) is on the verge of a possible technical breakout. The stock closed slightly below the 50-day EMA on the daily chart. A breakout above this key EMA is a signal that there is a potential long-term trend change taking place. The strongest sign of a bullish momentum is the daily MACD indicator which has just started to increase. The RSI is also showing positive signs on the stock. On watch.

NIO Bullish 📈NIO should see a bounce of off the Fibonacci support level.
Lets first wait for a confirmation of the bounce and then get our longs in!
