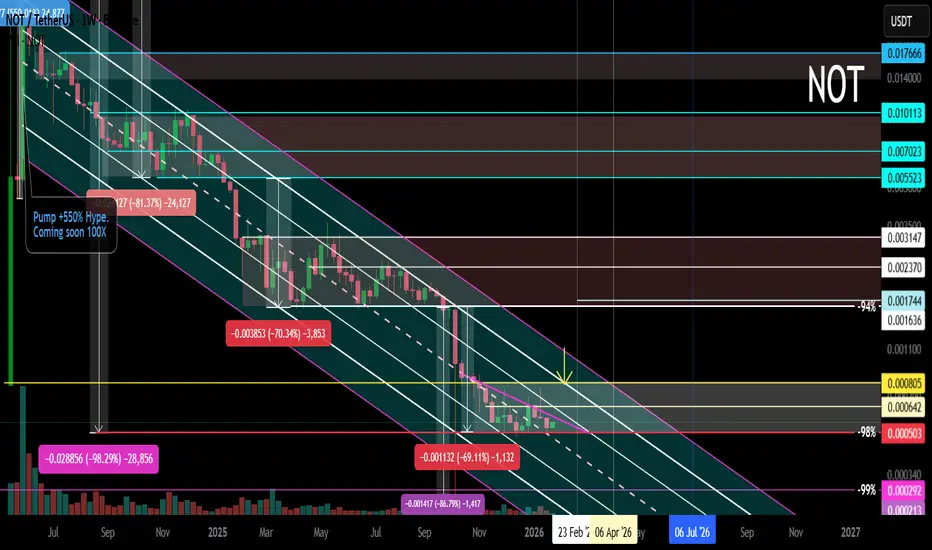
NOT Main Trend. Descending Channel -98% 01/27/2026Logarithm. Time frame: 1 week.
The price is in the main trend and remains in a downward channel with a given volatility range.
It's important to understand that the creators of this cryptocurrency always sell at any price (they're created for profit, fueled by hype). However, at low prices (-94-99%), a dilemma arises:
1️⃣ invent a reason for a scam and abandon the project;
2️⃣ or reverse the trend and temporarily restore faith in this scam cryptocurrency. In order to continue sales.
You can use this and profit from it. But, in the long term, you should be cautious with such assets. This applies to absolutely all cryptocurrencies created for hype and without any real future use. When trading such a dying former super-hype, manage your risks. This is the basic principle. If you can't do this, avoid it.
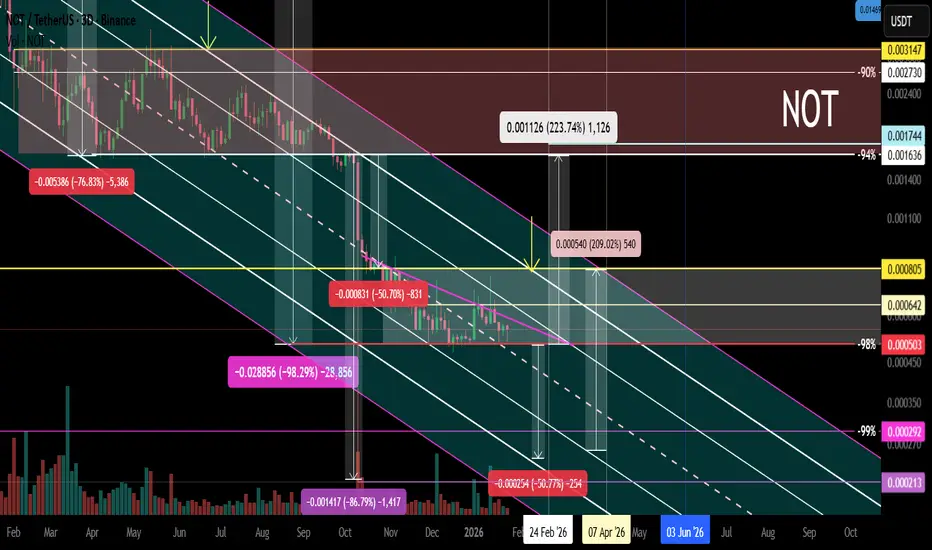
NOT Local trend. Sideways. -98%. Reversal zones 27 01 26
NOT
NOT Local trend. Sideways -98%. Reversal zones 27 01 26Logarithm. 3-day time frame.
The price in the main trend is still in a downward channel with a given volatility range.
Medium-term - locally , another sideways trend has formed (the third in a downward channel), but the decline is already -98% (not counting the futures long, which was previously down by -99%). Typically, such low-liquidity hype scams decline by -94-98% (with rare exceptions of -99% or a complete scam project, based on some fiction).
It's important to understand that the creators of such cryptocurrencies always sell at any price (they're created for profit, under the hype). But at low price levels (-94-99%), a dilemma arises:
1️⃣ invent a reason for a scam and abandon the project;
2️⃣ or reverse the trend and temporarily restore faith in the scam cryptocurrency. This will, in turn, continue selling.
You can exploit this and profit from it. But, in the long term, it's best to be cautious with such assets. This applies to absolutely all cryptocurrencies created for hype and with no real future use. When trading such dying former super-hypes, manage your risks. This is the foundation. If you can't manage it, avoid it.
NOT/USDT at Key Resistance — Break or Reject?📌 Overview
NOT/USDT is still trading within a clear medium-term downtrend, defined by a well-respected descending trendline (yellow line) that has been acting as dynamic resistance since the September peak. The market structure remains lower highs and lower lows, although recent price action shows a strong reaction from the demand zone, suggesting a potential early recovery attempt.
The previous sharp sell-off reflects a distribution and capitulation phase, followed by low-level consolidation.
---
📐 Pattern Explanation
🔻 Descending Trendline (Bearish Structure)
The descending trendline remains intact and unbroken
Each upward move continues to face selling pressure at the trendline, confirming dominant bearish control
🔹 Base Formation / Minor Accumulation
Price has started forming small higher lows near the bottom
Indicates early accumulation, but no confirmed trend reversal yet
🔄 Dead Cat Bounce vs Early Trend Reversal
The recent bounce could be:
A dead cat bounce if price fails to break resistance
Or an early trend reversal attempt if a confirmed breakout occurs
---
🟡 Key Support & Resistance Levels
Major Support (Demand Zones):
0.00050 – 0.00057 → strong reaction area
Breakdown below this zone would signal bearish continuation
Key Resistance Levels:
0.00072 – 0.00074 → near-term resistance
0.00085 – 0.00098 → strong supply zone
0.00151 – 0.00165 → major resistance and previous distribution area
---
🟢 Bullish Scenario
✔ Conditions:
Daily close above the descending trendline
Confirmation with higher high structure and increased volume
🎯 Upside Targets:
0.00085
0.00098
0.00151 – 0.00165 (optimistic target if momentum accelerates)
📈 Implication:
Market structure shifts from bearish → neutral → bullish
Signals a medium-term trend reversal
---
🔴 Bearish Scenario
❌ If:
Price fails to break the descending trendline
Strong rejection occurs near 0.00072 – 0.00074
🎯 Downside Targets:
0.00057
0.00050
Breakdown below support opens the door for new lower lows
📉 Implication:
Current bounce remains a relief rally
Bearish trend continues
---
🧠 Conclusion
NOT/USDT is currently at a critical decision point. As long as price remains below the descending trendline, the primary bias stays bearish–neutral. However, the emerging demand reaction suggests that the market is preparing for a decisive move.
> ⚠️ The descending trendline is the key level — breakout or rejection will define the next major trend.
#NOTUSDT #NOTCoin #CryptoTechnicalAnalysis #AltcoinAnalysis #DescendingTrendline #TrendReversal #SupportResistance #BearishMarket #BullishScenario #PriceAction #CryptoTrading

Notcoin (NOT) - Repeating Bearish Structure | Lower Lows → Dump 📊 Market Structure Analysis
Notcoin continues to respect a repeating bearish fractal structure on the daily timeframe.
Each cycle follows the same pattern:
short consolidation,
formation of a lower low,
followed by an impulsive sell-off / dump.
This structure has already played out multiple times, and every breakdown of support resulted in accelerated downside momentum.
🔁 Current Market Context
Right now, price is once again showing the exact same behavior:
the descending trendline remains intact,
each bounce is weak and gets sold into,
price continues to print lower highs and lower lows.
This indicates that sellers remain in full control, while demand is still absent.
🎯 Downside Targets
$0.00040 — first structural target
$0.00031 — next major downside zone
⚠️ Invalidation
This bearish scenario would be invalidated only by a clear break and close above the descending structure and the formation of a higher low.
📌 Summary
As long as Notcoin continues to form lower lows , the path of least resistance remains to the downside.
The market structure is unchanged — therefore, continuation of the dump remains the primary scenario.

FireHoseReel | TON’s Last Support of Defense🔥 Welcome to FireHoseReel !
Let’s dive into the analysis of Telegram Coin (TON).
👀 TONUSDT 4H Overview
TON has reached a very critical support zone. A clean break below this level could activate our next short trigger and lead to a deeper drop than many expect.
📊 Volume Analysis
Selling pressure during the formation of this support has been significant. With heavy market FOMO, many traders have already exited their TON positions. If this downside momentum continues, TON could enter a deeper corrective phase.
🔁 TONBTC Prespective
Meanwhile, the TON/BTC pair is also in a bearish structure, indicating that TON’s relative strength against Bitcoin is weakening.
📌 Trading Scenario
At the moment, TON presents one primary scenario, focused on the short side, which you can use alongside your own trading setup.
🔴 Short Scenario
A breakdown below the current support at $1.465, confirmed by a strong increase in sell volume, could trigger a sharp decline in TON.
❤️ Risk Management & Emotional Discipline
Crypto trading is highly risky. Without proper risk management and emotional control, trading is no different from gambling.
Logic must always come before emotions. Learn to manage your trades—and enjoy the process of trading with control and discipline.

FireHoseReel | NOT: 64% Down — Capitulation or Massive Reversal?🔥 Welcome to FireHoseReel !
Let’s explore the latest Notcoin price structure.
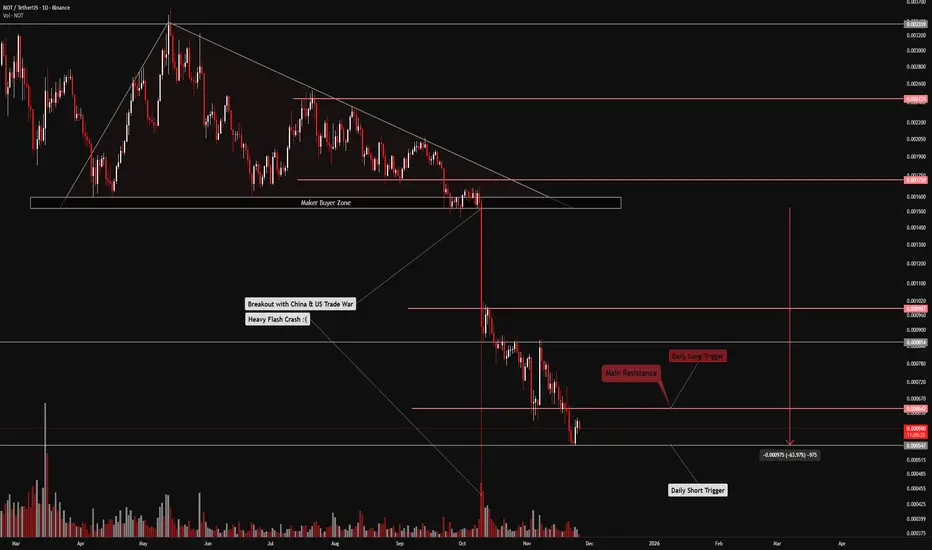
🪐 NOTCOIN – Market Structure & Key Levels Update
Notcoin has suffered a 64% crash following the flash crash triggered by the US–China trade war, marking one of the most severe declines in its history. Since its launch via a Telegram airdrop, Notcoin has consistently shown fragile price behavior, with repeated sharp corrections. Persistent selling pressure has made each pullback deeper, and the recent price action has even added an extra zero — clearly reflecting the gravity of this drawdown.
✨ Market Structure & Liquidity Outlook
At this stage, Notcoin’s structure has become extremely sensitive. Any additional downside could easily trigger a new corrective wave.
On the bullish side, if capital rotation returns to the TON ecosystem, Notcoin may experience a liquidity-driven upside squeeze. However, this scenario is heavily dependent on TON network performance and Telegram execution.
• Key Price Levels
• Daily resistance: 642
• Major support: 547
A daily close above 642 could activate a high-risk long trigger, best approached through futures trading for better flexibility.
On the other hand, a break below 547 may unleash aggressive selling pressure across Notcoin.
📊 Volume Analysis – The Decisive Factor
Volume remains the most critical metric at this stage.
After the flash crash, overall volume declined, but during multi-timeframe corrections, selling pressure clearly resurfaced, as confirmed by recent volume candles.
So far, strong buy-side volume has been rare, while sell pressure has stayed persistent and dominant.
✅ Trading Scenarios :
🔼 Long Scenario
• Confirmed break above 642
• Accompanied by a strong surge in volume
• This could trigger an upside expansion and support holding airdropped NOT or opening futures long positions.
🔽 Short Scenario
• Breakdown below 547
• Followed by a clear increase in sell pressure
• This would signal distribution risk, possibly forcing whale exits. Losing this support could justify reducing exposure and re-entering at lower levels to control risk.
🛞 Risk Management & Disclaimer
Please remember to always use proper risk management and position sizing. Nothing in this analysis is financial advice. The market can change quickly, so always trade based on your own strategy, research, and risk tolerance. You are fully responsible for your own trades.
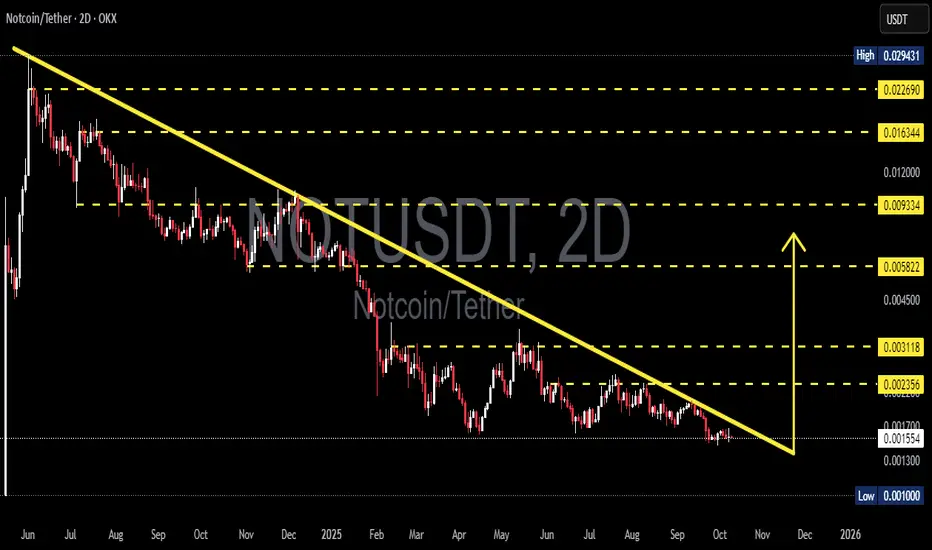
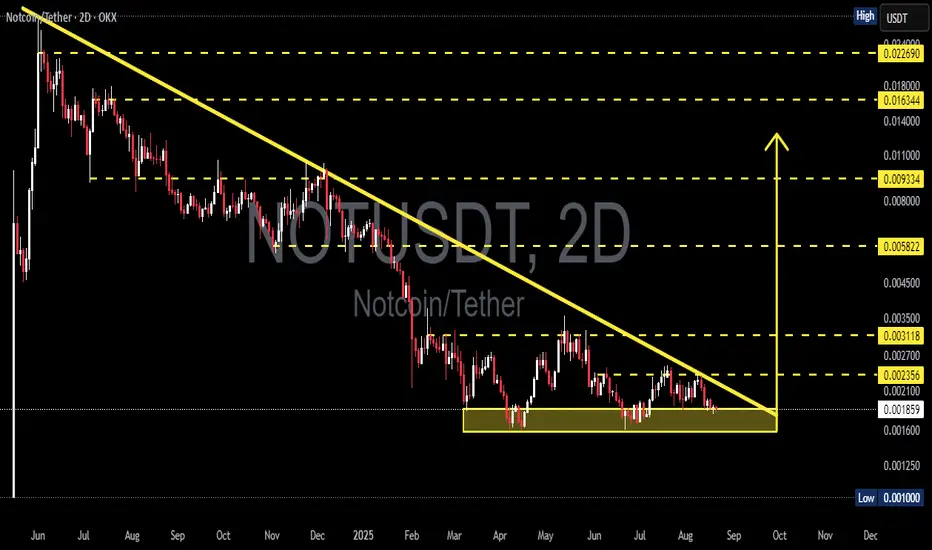
NOT/USDT — Descending Triangle: One Move Away from Expansion?The 2D chart of NOT/USDT reveals a descending triangle formation — a classic compression pattern signaling that the market is reaching a major decision point. For months, price action has been trapped under a falling trendline (yellow), forming a series of lower highs, while buyers continue to defend the 0.0013–0.0010 support zone with persistence.
This setup now represents a make-or-break moment:
Will NOT finally break out of its long-term downtrend, or will it face one last capitulation before finding a true bottom?
---
🔹 Pattern Structure
Pattern: Descending Triangle — a compression setup often seen near the end of a prolonged downtrend.
Interpretation: Still technically bearish, but every failed breakdown strengthens the potential for a bullish reversal.
Volume: Gradually declining — showing quiet accumulation and energy buildup before a potential expansion.
---
🔹 Key Technical Levels
Support Zone: 0.0013 – 0.0010 (major buyer defense)
Current Price: ≈ 0.001558
Resistance Targets:
R1 → 0.002356 (initial breakout target)
R2 → 0.003118 (trend flip zone)
R3 → 0.005822 (momentum expansion)
R4 → 0.009334 – 0.016344 (mid-term resistance cluster)
---
🟢 Bullish Scenario
A confirmed 2D candle close above the yellow trendline with strong volume could trigger a reversal breakout, signaling the end of the prolonged compression phase.
In that case, the next impulsive targets lie near 0.002356 and 0.003118.
Typically, a clean breakout is followed by a retest — the best opportunity for confirmation-based entries.
📈 “Breakout + Retest = Momentum Reversal.”
---
🔴 Bearish Scenario
If the 0.0013–0.0010 support breaks down with expanding sell volume, the descending triangle confirms its bearish continuation role.
This could lead to a quick retest of the 0.0010 zone, potentially marking a final capitulation phase before long-term accumulation begins.
📉 “Losing the floor means retesting history.”
---
⚙️ Overall Perspective
The market is entering the final stage of compression — volatility and volume are tightening, signaling that a major directional move is approaching.
Whether up or down, this next move could define NOT/USDT’s mid-term trend into Q4 2025.
> “The longer the silence, the bigger the explosion that follows.”
---
#NOTUSDT #Notcoin #CryptoAnalysis #DescendingTriangle #BreakoutSetup #PriceCompression #TrendReversal #AltcoinAnalysis #CryptoTrading #TechnicalAnalysis #SupportResistance #MarketStructure
NOTUSDTI waiting for breakout of trendline for buy. So is 0.001650 key-levels and 0.001800$ next level for breakout and buy.
Please control risk management because BINANCE:NOTUSDT
IN is meme_coin in crypto.

NOTCOIN; BUY SIGNALHello friends
Given that the price has reached the specified support and the price is supported by buyers and the specified resistance has been broken, we can buy in steps with risk and capital management and move to the specified targets.
*Trade safely with us*

NOTcoin and a profitable signalAfter a great start from a low risk buy range and a dedicated signal, Natcoin still has a valuable buying opportunity and can be considered for a great profit.
At least triple your capital on the next crypto market move with my signals.
All Eyes on 90–94K — The Next Big #BTC MoveCRYPTOCAP:BTC touched 116.6K, right where we expected. I’m still holding my position and waiting for lower targets. If price pushes into 120–125K, I’ll add more there. My main downside targets stay the same: 105K → 100K → 95K → 90K.
Don’t let price swings control your emotions. The real move is still ahead. Market makers are pushing altcoins higher just to trap liquidity before a big dump.

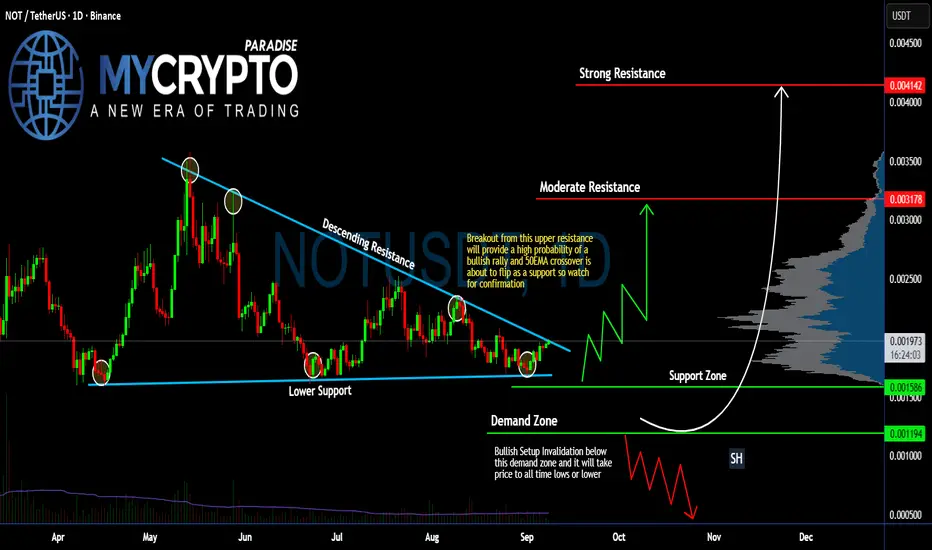
#NOT Ready to Make Massive Bullish Move | Must Watch for Bulls Yello, Paradisers! Is #NOTcoin about to explode into a bullish breakout, or is this just the calm before a brutal shakeout? Let’s break it down on #NOTUSDT:
💎After months of consolidation, #NOT has been trading inside a descending triangle, with clear descending resistance pressing price down and lower support holding the structure since April. Right now, the price is sitting at $0.00197, testing the upper boundary of this pattern.
💎A confirmed breakout above the descending resistance would open the door for a strong bullish rally. The 50 EMA is about to flip into support, which could act as extra confirmation if buyers step in.
💎In this scenario, the first target sits at moderate resistance around $0.0031, while a sustained push could bring us toward strong resistance at $0.0041. That zone aligns with the volume profile high and would likely trigger sharp profit-taking and volatility.
💎On the flip side, if bulls fail and GETTEX:NOT breaks below the support zone near $0.00158–$0.00119, the bullish structure becomes invalid. A drop into the demand zone would expose #NOT to fresh lows, potentially retesting all-time low levels. That’s where late longs risk getting wiped out, so this is the area where risk management becomes absolutely critical.
Stay patient, Paradisers. Let the breakout confirm, and only then do we strike with conviction.
MyCryptoParadise
iFeel the success🌴
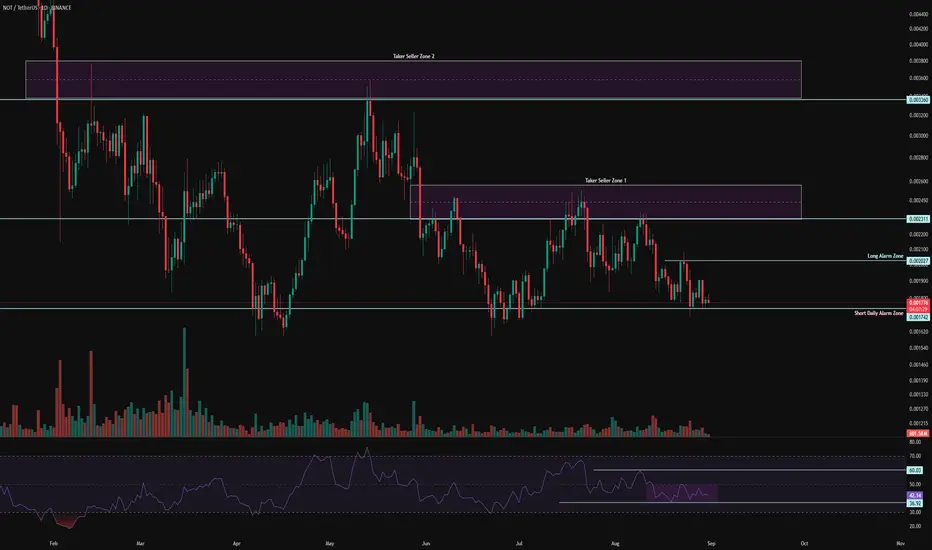
NOT 1D Analysis – Key Triggers Ahead💀 Hey , how's it going ? Come over here — Satoshi got something for you !
⏰ We’re analyzing NOTCOIN on the 1-DAY timeframe timeframe .
👀 On the daily timeframe of Notcoin, we can see that Notcoin is one of Telegram’s well-known airdrops, and many Telegram users got familiar with Notcoin through it. On the daily chart, after its recent drop, the volume has decreased sharply, and we can consider the possibility of reduced selling pressure at this bottom since the price has taken on a compressed and accumulation phase. Regarding the zones, a quick note: because Notcoin was distributed as an airdrop, many of its users are considered as seller tickers.
⚙️ The key RSI zones for Notcoin are at 60 and 36. If the oscillator crosses these levels, Notcoin can experience a solid move. A box-like compression has formed inside the RSI, and breaking out of this compression could bring about a parabolic swing.
🕯 The volume of Notcoin, along with its reduced volatility, has decreased sharply and reached an accumulation stage. Once this accumulation phase ends, Notcoin can experience a good move. Note that the size and volume of red candles are increasing, so price action behavior can provide the best decision-making opportunity for taking trades.
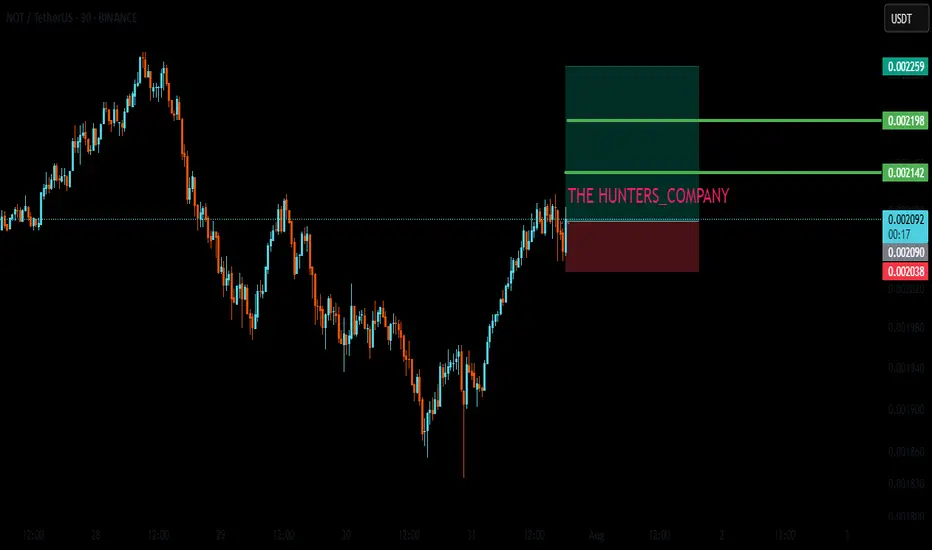
🔔 The alert zone considered is the 0.002 area, which is set as the long trade alert zone. (A short clarification: price behavior in this zone doesn’t necessarily only mean a long position—it could also be a reversal. We trade based on probabilities.)
❤️ Disclaimer : This analysis is purely based on my personal opinion and I only trade if the stated triggers are activated .
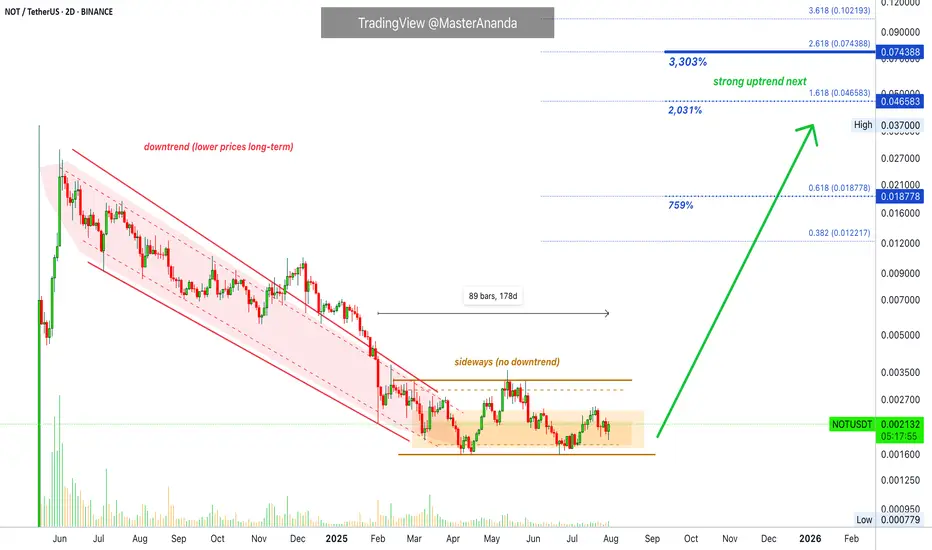
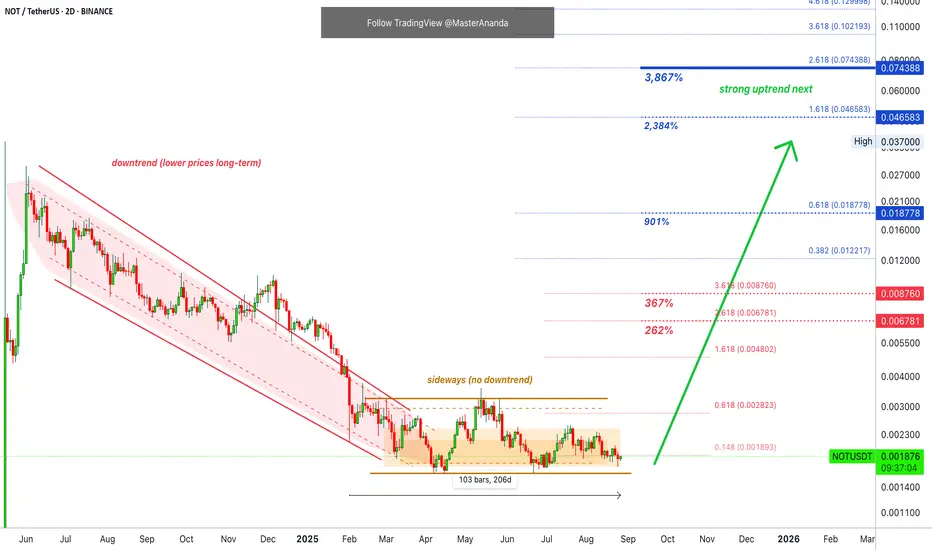
Notcoin · Futures Trading Trade-NumbersNotcoin is doing great right now, truly, trading at bottom prices/the opportunity buy zone. It has now been 205 days with NOTUSDT moving sideways.
The current price range has been active only twice, ever in the life of this project, and briefly. Between late June and early July, and also in April. That's it.
The third time Notcoin trades within the opportunity buy zone is now, late August 2025. August tends to be a bottom month.
We had a bottom for Crypto in August 2024. Many altcoins ended up producing a bottom in August 2023 and there were bottoms also in August 2022. There is something about this month.
Something ends in August/September, something starts in March. The fiscal year? The seasons? Yes! All of it. Each and every aspect plays its role.
Forget about that, Notcoin is the name of the game.
I've been telling you about this project for a long-time now. Do you still believe what I say? Do you believe NOTUSDT will produce massive growth? It will, mark my words.
Just at bottom prices it's been seven months. If you are new, I understand if you feel like the market is not going anywhere. But this is normal, it takes time between each bullish wave.
If you are experienced, old, you know we are looking at the best possible entry prices ever, with timing being awesome.
Another friendly reminder. It doesn't get any better. You can buy LONG or you can go spot.
________
LONG NOTUSDT
ENTRY: 0.001700 - 0.001890 (STOP: 0.001690)
TARGETS: 0.002067, 0.002356, 0.002823, 0.003579, 0.004802, 0.005555, 0.006781
________
Very low risk is 3-5X. This chart setup can take up to 10X and sometimes even more. More than 5X, experts only. But the opportunity is right in your face.
It is going to happen. We are getting very close...
The consolidation period is almost over.
Watch the market grow next.
Namaste.
NOTUSDT — Descending Triangle Support! Breakout or Breakdown?Currently, NOT/USDT is trading at a decisive point after a long downtrend. The chart clearly forms a Descending Triangle, a classic pattern that often signals bearish continuation, but under certain conditions can turn into a bullish reversal if a strong breakout occurs.
---
🔎 Pattern & Context
Main Pattern: Descending Triangle (consistent lower highs + strong horizontal support).
Support Zone: 0.0016 – 0.0019 (yellow box). This zone has been tested multiple times, showing buyers are still defending it.
Previous Trend: Strong bearish trend → favors breakdown, but reversal potential remains if bulls manage to break above the descending trendline.
Momentum: Price is being squeezed at the apex of the triangle → a major move is likely imminent.
---
🟢 Bullish Scenario (Upside Breakout)
If price successfully breaks above the descending trendline with a 2D close + strong volume, a reversal setup will be triggered.
🎯 Bullish Targets:
First target: 0.002356 (nearest resistance).
Next targets: 0.003118 → 0.005822.
If strong momentum continues → potential extension toward 0.0093 – 0.0163 (resistance levels shown on chart).
📌 Validation: Breakout + successful retest of the trendline (turning into new support) increases bullish probability.
---
🔴 Bearish Scenario (Downside Breakdown)
If price fails to hold the 0.0016 – 0.0019 support zone, the descending triangle plays out as a bearish continuation pattern.
🎯 Bearish Targets:
Initial target: 0.0010 (previous major low).
If selling pressure accelerates → potential formation of new lows below 0.0010.
📌 Validation: 2D candle close below 0.0016 with strong volume + failed retest = confirmed breakdown.
---
📌 Conclusion & Key Notes
0.0016 – 0.0019 is the key decision zone. Holding it opens the door for a bullish reversal, while breaking it signals continuation of the downtrend.
A major move is approaching as price gets compressed at the triangle’s apex.
Watch out for false breakouts / breakdowns → always wait for volume confirmation.
Strict risk management is crucial, especially for low-cap coins with high volatility and manipulation risks.
#NOT #NOTUSDT #Crypto #Altcoin #PriceAction #TechnicalAnalysis #DescendingTriangle #Breakout #Bearish #Bullish
HODL BASKETHello friends
You see the meme coin Natcoin on the weekly time frame that has an important resistance and a good support.
Now, to buy this currency, we must wait for a valid break of the resistance and then the price can move to the specified targets.
Note that the specified support is very important and for the price to rise, both the support and the resistance need to be maintained.
Be sure to observe risk and capital management.
*Trade safely with us*


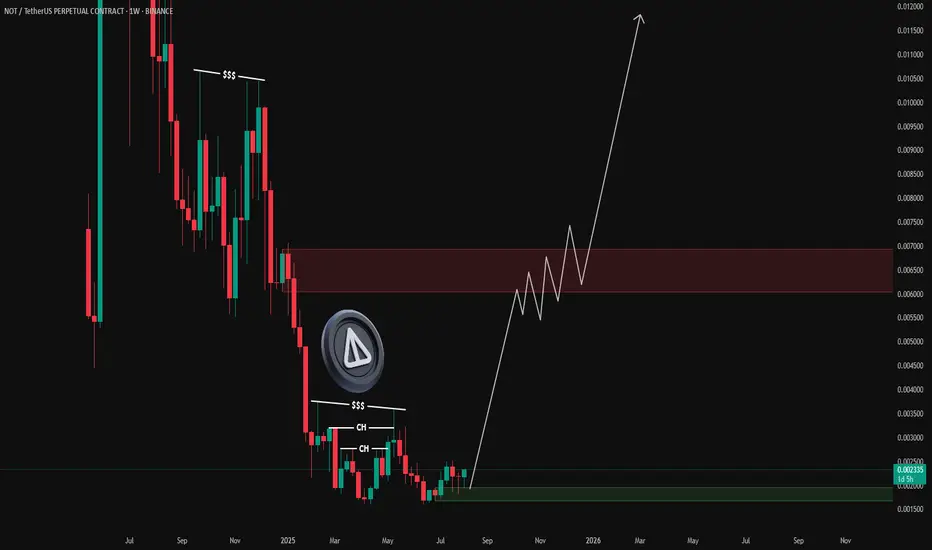
Notcoin's 3,000% Bull Market Confirmed · Don't Sell —HOLD!I've been thinking of doing an update on Notcoin... Here we are.
While the chart looks the same and is the same, prices are slowly rising. While everything is still happening at bottom prices and within the "opportunity buy zone," the market cycle continues to advance.
I will keep it simple for you because we've been tracking this project now for many months, so I can be straight. We have a history together.
When the initial bullish breakout happens it will be in the tune of 200-300%. That's just the first jump and the first few days. That's what you need to be prepared for.
When this happens, nothing has really happened this is only the start. Volatility increases and you don't know if you should hold or sell. Should I take profits? Of course not, that is only the start and after a few days of volatility the market settles and starts growing long-term. Long-term growth.
Long-term growth means growing for a long time not just a few days.
So forget about the rising trend, the bullish wave. Think about now, this is the only hard part and it is over. This was the hard part, the hard part is to wait. Once the wait is over, prices grow and it is growth not sideways. You will see the huge difference when prices start to go up.
Once the initial bullish breakout happens, continue to hold.
Hold long-term and hold strong.
Those who manage to be patient will receive a huge reward.
More money can be made holding that trying to catch the next hot trade.
Namaste.

#NOTCOIN #NOT #NOTUSD #NOTUSDT #Analysis #Eddy#NOTCOIN #NOT #NOTUSD #NOTUSDT #Analysis #Eddy
A reversal structure has formed on the weekly and daily time frames, and the necessary confirmations have been given on the weekly time frame. Considering the structure formed on the above time frame, as well as the behavior of this currency in the past chart, it is expected that this currency will perform a good pump.
I have identified the important supply and demand zones of the higher timeframe for you.
This analysis is based on a combination of different styles, including the volume style with the ict style.
Based on your strategy and style, get the necessary confirmations for this analysis to enter the trade.
Don't forget about risk and capital management.
The responsibility for the transaction is yours and I have no responsibility for your failure to comply with your risk and capital management.
💬 Note: The red order block cannot stop the growth of the price of this currency and by 0.01 cents this currency will be pumped more than 400%.
Be successful and profitable.
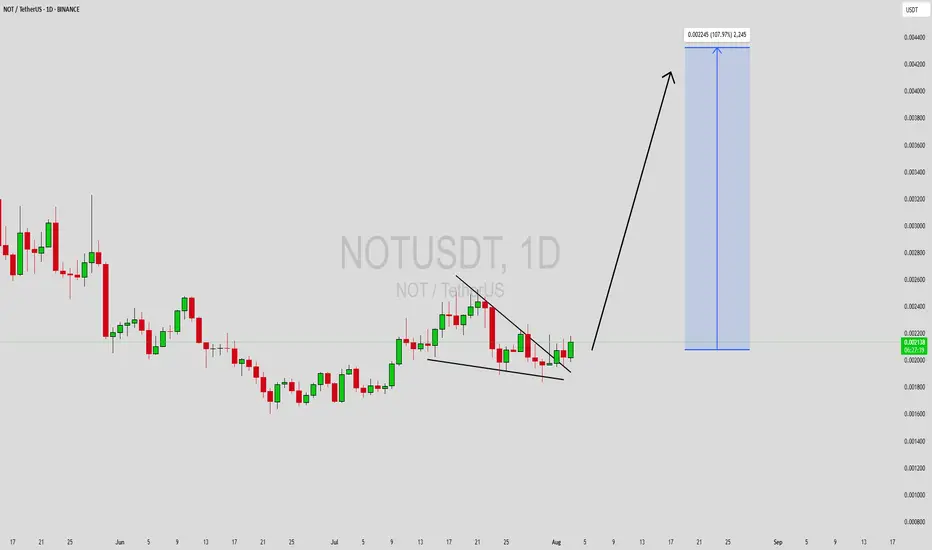
NOTUSDT Forming Falling WedgeNOTUSDT is forming a textbook falling wedge pattern, a well-known bullish reversal signal in technical analysis. After an extended downtrend, the price action has begun to consolidate within a narrowing range, indicating a potential breakout is imminent. Falling wedge formations often lead to explosive upward moves once the price breaks above the upper trendline resistance. With volume gradually picking up and bullish momentum building, NOTUSDT appears poised for a significant rally.
Traders and investors are closely watching this pair due to its high potential for a breakout. Historical price behavior around current levels shows strong accumulation, and the volume profile supports a bullish breakout scenario. The expected upside target projects a gain between 90% to 100%+ if the wedge pattern plays out as anticipated. This setup offers a strong risk-reward opportunity for those looking to catch an early trend reversal.
Market sentiment around NOT (Notcoin) has improved notably, fueled by its strong community, emerging utility in the Telegram ecosystem, and listing support from major exchanges. These fundamentals are adding confidence to the technical setup. The price currently sits at a critical juncture, and a breakout above resistance could attract significant attention and trigger FOMO among retail traders.
As always, confirmation is key—traders should wait for a strong breakout with increased volume before entering. Once confirmed, NOTUSDT could rapidly push toward its upper targets, making this a high-potential trade setup.
✅ Show your support by hitting the like button and
✅ Leaving a comment below! (What is You opinion about this Coin)
Your feedback and engagement keep me inspired to share more insightful market analysis with you!
LIVE TRADEHello friends🙌
Given the good trend we had, now that we have had a price correction, we can enter the trade with risk and capital management and move towards the specified goals.
🔥Follow us for more signals🔥
*Trade safely with us*
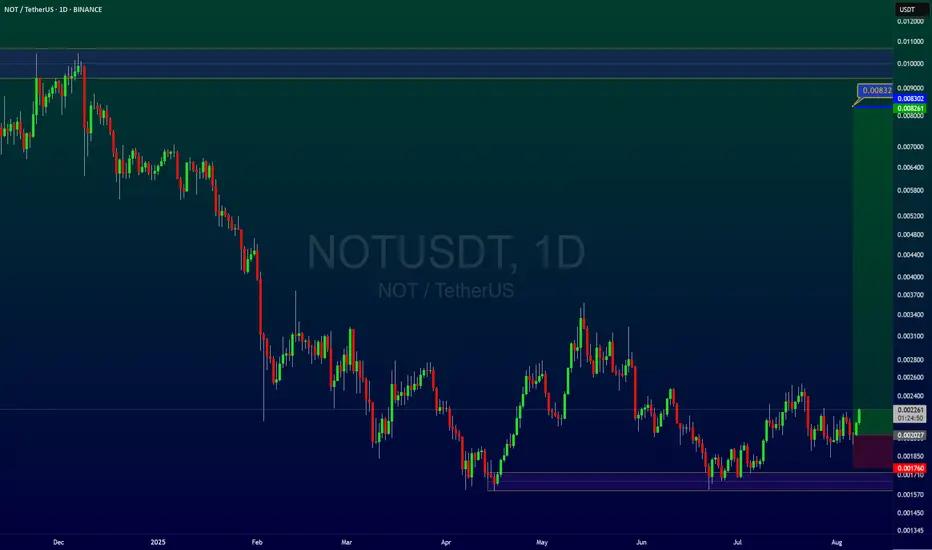
Notcoin · Last Call, Last Chance · Friendly ReminderWe looked at Notcoin recently and this is the last time you will see a publication at these low prices. In the next Notcoin update the price will be at least 100% higher and growing, we will be in the middle of a full blown bullish wave.
Right now Notcoin is still trading at the lower end of a downtrend. The downtrend ended and the market went sideways. Sideways is what we have now. The accumulation phase and zone where whales, smart trader and experts buy the most. The obvious reason being because it is always better to buy when prices are low.
4-8X. We are going with 6X for this one but the choice is yours.
Notcoin can grow anywhere between 1,000% and 3,000% in the coming months. I will aim for the higher targets just because I know this bull market will be very strong based on the charts and the early action we are getting. We are still at bottom prices marketwide and yet some pairs are already trading at new all-time highs. It means that this bull market will be big, bigger than usual and bigger than anything you can expect or imagine.
The strategy is to buy and hold. Spot. If you are leverage, then you need to decide on your risk, at this point, 2-3X is safe. Anything higher and you are opening yourself to a risky situation. Higher would imply higher profits potential, but would you risk everything for just a potential? Better play it safe while aiming big. If the pair can grow 30X in the coming months, leverage might not be the best choice.
Some people do both. What is your trading style? What are your trading goals?
Spot or leverage, low or high risk, we are going up. We had plenty of time to buy, plenty of warnings and plenty of opportunities. The market will wait no more. Prepare for the start of a mega bull run.
Thanks a lot for your continued support.
Namaste.