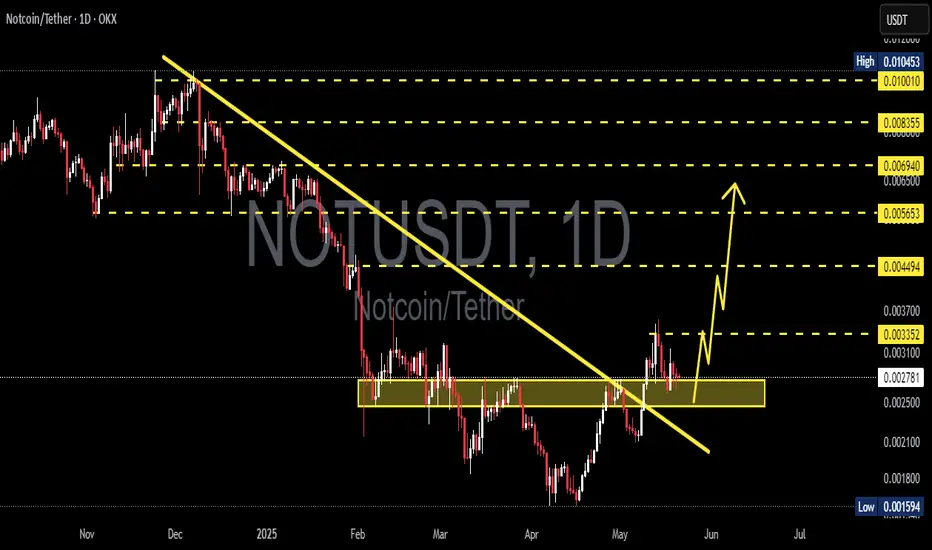
NOTUSDT 1D Analysis NOT ~ 1D Analysis
#NOT Buy incrementally from this support block with a short term target of at least 15%+ from here.
Notsignal
notcoin update"🌟 Welcome to Golden Candle! 🌟
We're a team of 📈 passionate traders 📉 who love sharing our 🔍 technical analysis insights 🔎 with the TradingView community. 🌎
Our goal is to provide 💡 valuable perspectives 💡 on market trends and patterns, but 🚫 please note that our analyses are not intended as buy or sell recommendations. 🚫
Instead, they reflect our own 💭 personal attitudes and thoughts. 💭
Follow along and 📚 learn 📚 from our analyses! 📊💡"

notcoin idea"🌟 Welcome to Golden Candle! 🌟
We're a team of 📈 passionate traders 📉 who love sharing our 🔍 technical analysis insights 🔎 with the TradingView community. 🌎
Our goal is to provide 💡 valuable perspectives 💡 on market trends and patterns, but 🚫 please note that our analyses are not intended as buy or sell recommendations. 🚫
Instead, they reflect our own 💭 personal attitudes and thoughts. 💭
Follow along and 📚 learn 📚 from our analyses! 📊💡"

#NOT 4H. Symmetrical triangle and potential for growth. 11/20/24Looks solid. At the moment, the price has formed a "symmetrical triangle" pattern.
I expect a bit more sideways movement, followed by a breakout and an upward move. I believe the launch of new tap-to-earn tokens in November will drive growth across the entire Ton ecosystem.
From the current levels, I anticipate at least a 50% increase without leverage. You already know the mid-term targets for Notcoin. Well, these are my targets and my opinion—it's up to you to decide what to do with these thoughts.

NOTCOIN📊Analysis by AhmadArz: notcoin
In this technical analysis chart for the new token NOT/USDT, the price movement is clearly outlined. Currently, the token is priced around $0.007919 📉 and is trending upwards within the blue channel 🔵📈.
Key resistance levels are identified at $0.008822, $0.009911, and $0.011448 🔒. The analyst suggests waiting for the price to break above the $0.0114 level to anticipate another potential pump 🚀.
Additionally, a crucial support zone is marked between approximately $0.004800 and $0.005100 🛡️. If the price reaches this area, it could be considered a good buying opportunity 📈💰.
Overall, if the price can break through the mentioned resistance levels, there is potential for further increases. However, if it falls below the ascending channel and enters the lower support zone, caution is advised ⚠️.
🔗"Uncover new opportunities in the world of cryptocurrencies with AhmadArz.
💡Join us on TradingView and expand your investment knowledge with our five years of experience in financial markets."
🚀Please boost and💬 comment to share your thoughts with us!

CE of Daily Bearish OB holding DXY ?
Price might fill the previous Vacuum Gap which is around 105 level by taking out the Buyside Liquidity above after that price might pullback into bearish , anything can happen ! Be Safe !

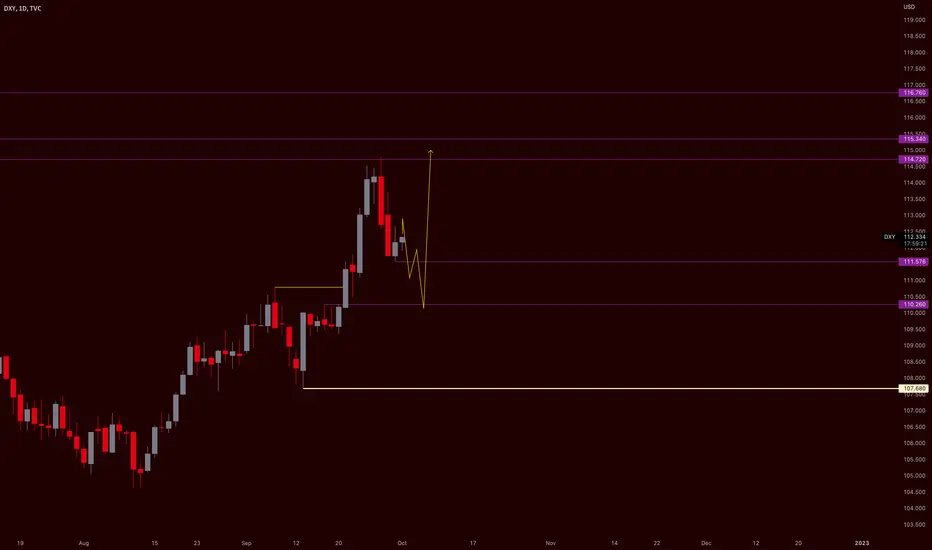
DXY Forecast for 1st Week of Oct
Daily Time Frame forecast , I am expecting some bearish continuation around 111.5 - 110 and price might evolved into impulsive bullish momentum at the end of this week / around 2nd of week Oct !
Gold Long position I've been learning forex for 2 months so help me to fix my mistakes . In here i saw a pattern ( IT IS NOT SIGNAL JUST AN IDEA )

My XAGUSD!!!! IDEA!!!I has bounced off a dynamic resistance level and I do believe it will come down to this new level of support for a 2 risk reward.
Just my idea take it as u wish this is not financial advice or a signal. Just Analysis. Do your homework. Happy Trading.

BreakdownAscending within bigger Ascending
3 Touch
High Test Rejection
Over all HTF in Expanding formation
It correctively broke out of the Expanding

Bearish Bat on 4H Aussie/ Dollar On the Weekly Chart, the pair almost seems to be making a Bear Pennant and has been in a significant downward trend. at the moment there is a Bearish Bat pattern! typically one might want to place stops above the pattern's entirety, but I like Risk/ Reward to be at least 1 risk/ 2 reward. There are 4 TP's each at signiciant Fib. Retrace levels of the AD leg. (Supposed to be CD But I like larger profits) :)
THIS IS NOT A SIGNAL!

