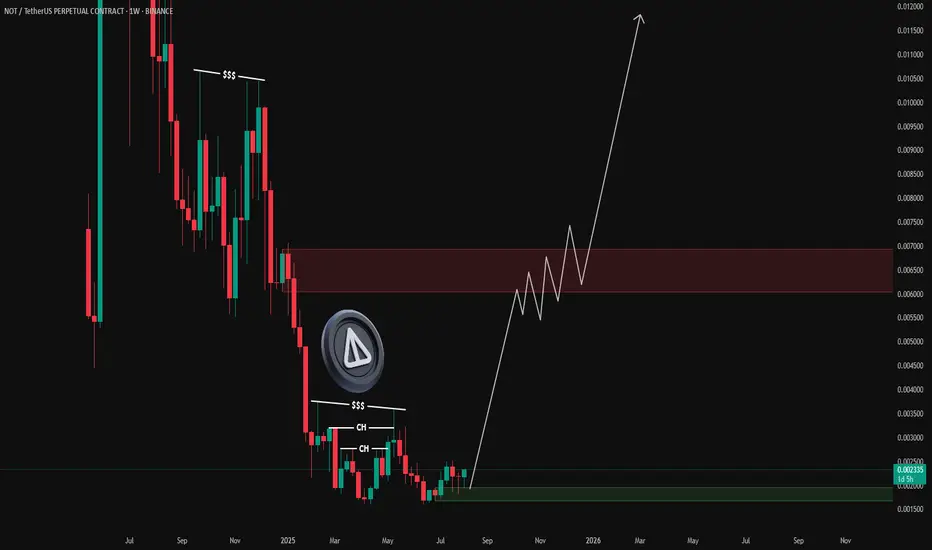
Notcoin (NOT) - Repeating Bearish Structure | Lower Lows → Dump 📊 Market Structure Analysis
Notcoin continues to respect a repeating bearish fractal structure on the daily timeframe.
Each cycle follows the same pattern:
short consolidation,
formation of a lower low,
followed by an impulsive sell-off / dump.
This structure has already played out multiple times, and every breakdown of support resulted in accelerated downside momentum.
🔁 Current Market Context
Right now, price is once again showing the exact same behavior:
the descending trendline remains intact,
each bounce is weak and gets sold into,
price continues to print lower highs and lower lows.
This indicates that sellers remain in full control, while demand is still absent.
🎯 Downside Targets
$0.00040 — first structural target
$0.00031 — next major downside zone
⚠️ Invalidation
This bearish scenario would be invalidated only by a clear break and close above the descending structure and the formation of a higher low.
📌 Summary
As long as Notcoin continues to form lower lows , the path of least resistance remains to the downside.
The market structure is unchanged — therefore, continuation of the dump remains the primary scenario.
NOTUSD

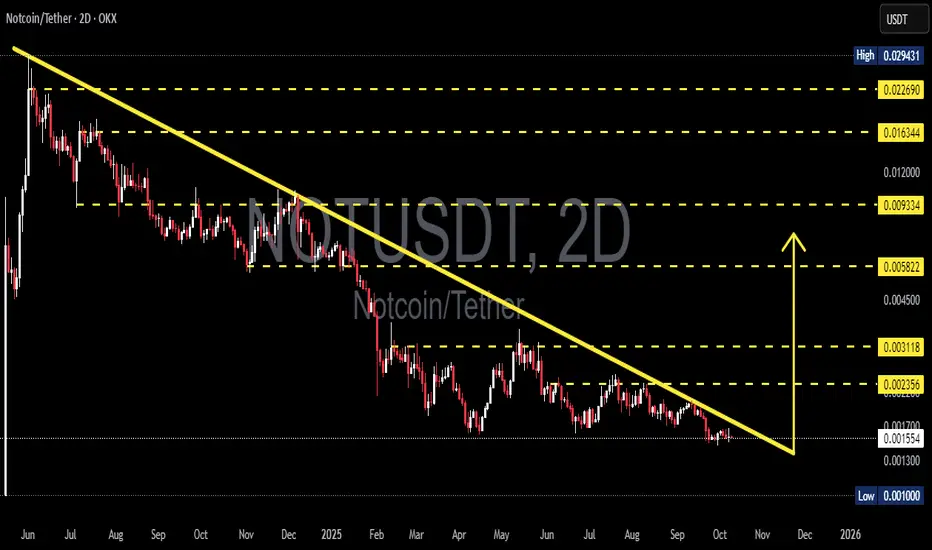
NOT/USDT — Descending Triangle: One Move Away from Expansion?The 2D chart of NOT/USDT reveals a descending triangle formation — a classic compression pattern signaling that the market is reaching a major decision point. For months, price action has been trapped under a falling trendline (yellow), forming a series of lower highs, while buyers continue to defend the 0.0013–0.0010 support zone with persistence.
This setup now represents a make-or-break moment:
Will NOT finally break out of its long-term downtrend, or will it face one last capitulation before finding a true bottom?
---
🔹 Pattern Structure
Pattern: Descending Triangle — a compression setup often seen near the end of a prolonged downtrend.
Interpretation: Still technically bearish, but every failed breakdown strengthens the potential for a bullish reversal.
Volume: Gradually declining — showing quiet accumulation and energy buildup before a potential expansion.
---
🔹 Key Technical Levels
Support Zone: 0.0013 – 0.0010 (major buyer defense)
Current Price: ≈ 0.001558
Resistance Targets:
R1 → 0.002356 (initial breakout target)
R2 → 0.003118 (trend flip zone)
R3 → 0.005822 (momentum expansion)
R4 → 0.009334 – 0.016344 (mid-term resistance cluster)
---
🟢 Bullish Scenario
A confirmed 2D candle close above the yellow trendline with strong volume could trigger a reversal breakout, signaling the end of the prolonged compression phase.
In that case, the next impulsive targets lie near 0.002356 and 0.003118.
Typically, a clean breakout is followed by a retest — the best opportunity for confirmation-based entries.
📈 “Breakout + Retest = Momentum Reversal.”
---
🔴 Bearish Scenario
If the 0.0013–0.0010 support breaks down with expanding sell volume, the descending triangle confirms its bearish continuation role.
This could lead to a quick retest of the 0.0010 zone, potentially marking a final capitulation phase before long-term accumulation begins.
📉 “Losing the floor means retesting history.”
---
⚙️ Overall Perspective
The market is entering the final stage of compression — volatility and volume are tightening, signaling that a major directional move is approaching.
Whether up or down, this next move could define NOT/USDT’s mid-term trend into Q4 2025.
> “The longer the silence, the bigger the explosion that follows.”
---
#NOTUSDT #Notcoin #CryptoAnalysis #DescendingTriangle #BreakoutSetup #PriceCompression #TrendReversal #AltcoinAnalysis #CryptoTrading #TechnicalAnalysis #SupportResistance #MarketStructure
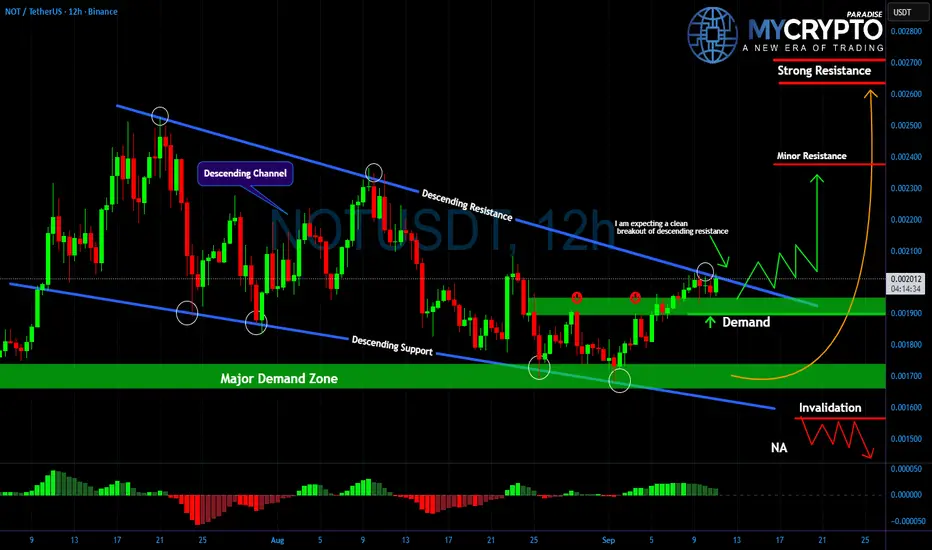
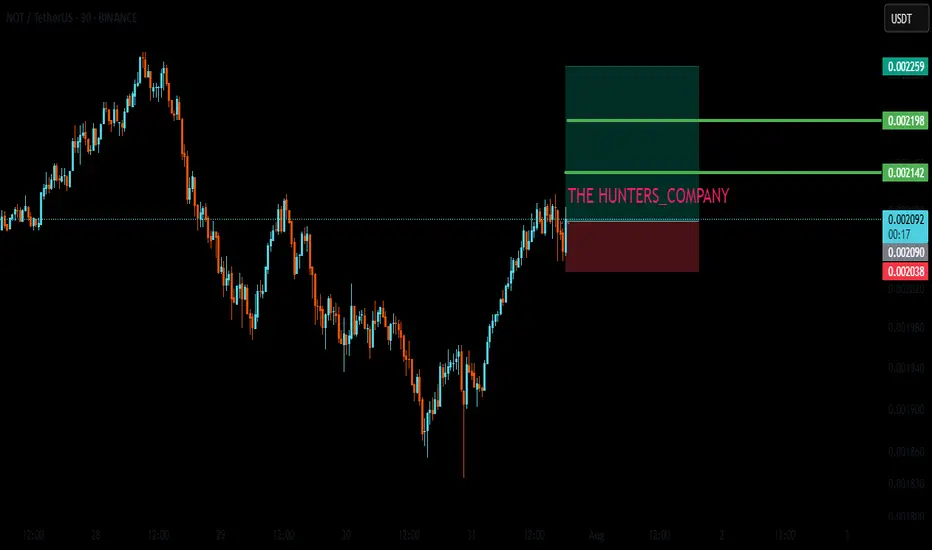
NOTUSDT: Silent Accumulation Before the Next Big BreakoutYello, Paradisers are you paying attention to what’s happening on NOT right now? While most traders are distracted, the price action has been quietly building pressure inside a textbook descending channel, and the breakout signs are now impossible to ignore.
💎After several weeks of heavy compression, #NOTUSDT finally pushed through descending resistance, signaling that sellers are losing their grip. For the last sessions, price has been retesting the breakout area, stabilizing right above the demand zone. This behavior often indicates silent accumulation before a more aggressive move begins.
💎As long as the demand zone holds, buyers keep the advantage. A clean breakout above the minor resistance around 0.0022 could open the path toward the strong resistance level near 0.0026, where significant supply is expected. If this level is reached, the momentum could accelerate sharply as short sellers begin to cover.
💎However, traders must also stay alert. A failure to hold the demand zone would expose price to the invalidation level around 0.0016. A breakdown below it would completely change the market structure and shift the bias back into bearish territory.
💎Momentum indicators are already showing encouraging signs of early accumulation, with every dip into demand quickly attracting buyers. If this continues, NOT could deliver a sharp breakout that leaves the majority of traders chasing late entries.
Strive for consistency, not quick profits. Treat the market as a businessman, not as a gambler.
MyCryptoParadise
iFeel the success🌴
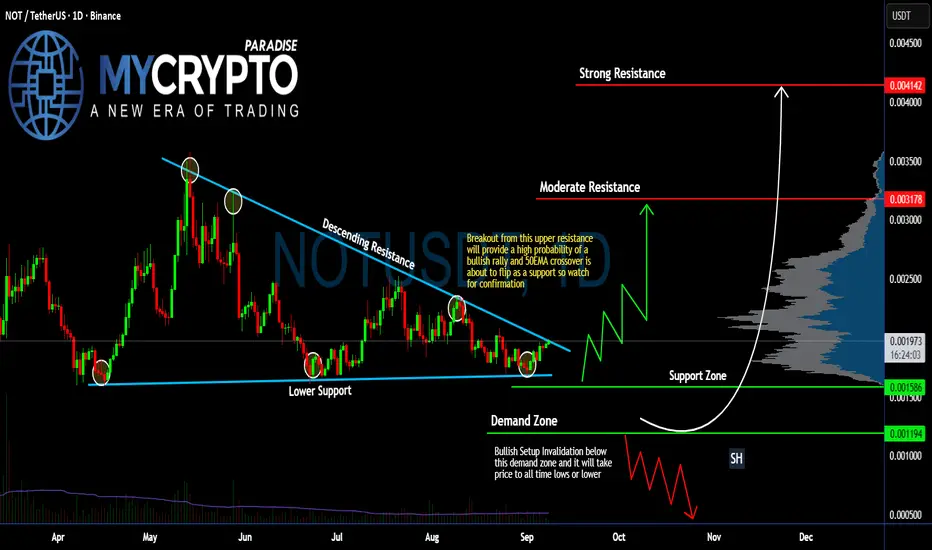
#NOT Ready to Make Massive Bullish Move | Must Watch for Bulls Yello, Paradisers! Is #NOTcoin about to explode into a bullish breakout, or is this just the calm before a brutal shakeout? Let’s break it down on #NOTUSDT:
💎After months of consolidation, #NOT has been trading inside a descending triangle, with clear descending resistance pressing price down and lower support holding the structure since April. Right now, the price is sitting at $0.00197, testing the upper boundary of this pattern.
💎A confirmed breakout above the descending resistance would open the door for a strong bullish rally. The 50 EMA is about to flip into support, which could act as extra confirmation if buyers step in.
💎In this scenario, the first target sits at moderate resistance around $0.0031, while a sustained push could bring us toward strong resistance at $0.0041. That zone aligns with the volume profile high and would likely trigger sharp profit-taking and volatility.
💎On the flip side, if bulls fail and GETTEX:NOT breaks below the support zone near $0.00158–$0.00119, the bullish structure becomes invalid. A drop into the demand zone would expose #NOT to fresh lows, potentially retesting all-time low levels. That’s where late longs risk getting wiped out, so this is the area where risk management becomes absolutely critical.
Stay patient, Paradisers. Let the breakout confirm, and only then do we strike with conviction.
MyCryptoParadise
iFeel the success🌴
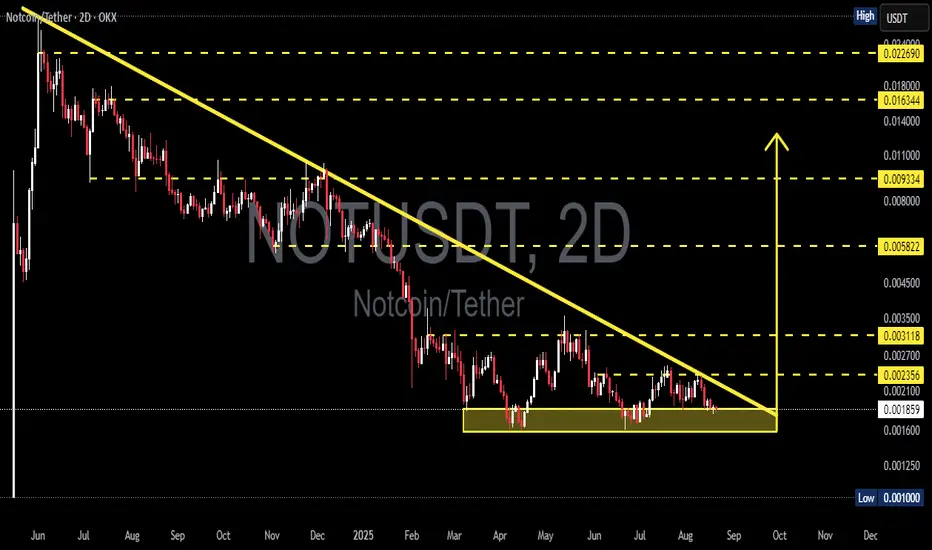
NOTUSDT — Descending Triangle Support! Breakout or Breakdown?Currently, NOT/USDT is trading at a decisive point after a long downtrend. The chart clearly forms a Descending Triangle, a classic pattern that often signals bearish continuation, but under certain conditions can turn into a bullish reversal if a strong breakout occurs.
---
🔎 Pattern & Context
Main Pattern: Descending Triangle (consistent lower highs + strong horizontal support).
Support Zone: 0.0016 – 0.0019 (yellow box). This zone has been tested multiple times, showing buyers are still defending it.
Previous Trend: Strong bearish trend → favors breakdown, but reversal potential remains if bulls manage to break above the descending trendline.
Momentum: Price is being squeezed at the apex of the triangle → a major move is likely imminent.
---
🟢 Bullish Scenario (Upside Breakout)
If price successfully breaks above the descending trendline with a 2D close + strong volume, a reversal setup will be triggered.
🎯 Bullish Targets:
First target: 0.002356 (nearest resistance).
Next targets: 0.003118 → 0.005822.
If strong momentum continues → potential extension toward 0.0093 – 0.0163 (resistance levels shown on chart).
📌 Validation: Breakout + successful retest of the trendline (turning into new support) increases bullish probability.
---
🔴 Bearish Scenario (Downside Breakdown)
If price fails to hold the 0.0016 – 0.0019 support zone, the descending triangle plays out as a bearish continuation pattern.
🎯 Bearish Targets:
Initial target: 0.0010 (previous major low).
If selling pressure accelerates → potential formation of new lows below 0.0010.
📌 Validation: 2D candle close below 0.0016 with strong volume + failed retest = confirmed breakdown.
---
📌 Conclusion & Key Notes
0.0016 – 0.0019 is the key decision zone. Holding it opens the door for a bullish reversal, while breaking it signals continuation of the downtrend.
A major move is approaching as price gets compressed at the triangle’s apex.
Watch out for false breakouts / breakdowns → always wait for volume confirmation.
Strict risk management is crucial, especially for low-cap coins with high volatility and manipulation risks.
#NOT #NOTUSDT #Crypto #Altcoin #PriceAction #TechnicalAnalysis #DescendingTriangle #Breakout #Bearish #Bullish
#NOTCOIN #NOT #NOTUSD #NOTUSDT #Analysis #Eddy#NOTCOIN #NOT #NOTUSD #NOTUSDT #Analysis #Eddy
A reversal structure has formed on the weekly and daily time frames, and the necessary confirmations have been given on the weekly time frame. Considering the structure formed on the above time frame, as well as the behavior of this currency in the past chart, it is expected that this currency will perform a good pump.
I have identified the important supply and demand zones of the higher timeframe for you.
This analysis is based on a combination of different styles, including the volume style with the ict style.
Based on your strategy and style, get the necessary confirmations for this analysis to enter the trade.
Don't forget about risk and capital management.
The responsibility for the transaction is yours and I have no responsibility for your failure to comply with your risk and capital management.
💬 Note: The red order block cannot stop the growth of the price of this currency and by 0.01 cents this currency will be pumped more than 400%.
Be successful and profitable.
LIVE TRADEHello friends🙌
Given the good trend we had, now that we have had a price correction, we can enter the trade with risk and capital management and move towards the specified goals.
🔥Follow us for more signals🔥
*Trade safely with us*
Notcoin and the Butterfly Effect
🦋 Bullish Butterfly Pattern Forming | NOTUSDT Analysis
A potential Bullish Butterfly is unfolding on NOTUSDT:
X to A: initial decline
A to B: ~94.3% retracement
B to C: higher low at ~99.6%
C to D: projected bullish leg toward 0.00327 (127.8% Fib), aligning with midline of the yellow descending channel
The price is currently testing the top of the red descending channel.
If bullish momentum holds and this upper boundary breaks, we anticipate a continuation toward point D, and potentially toward 0.006044, the upper yellow channel — a highly critical resistance. A breakout and close above this level may trigger the beginning of a major bullish trend.
🔸 Risk Management:
• Consider partial profit-taking near the midline of the yellow channel
• Trail stop-loss as the price nears point D
• Use only 1% of capital per position
⚠️ Key Note:
• If price breaks below point C, this bullish butterfly setup becomes invalid
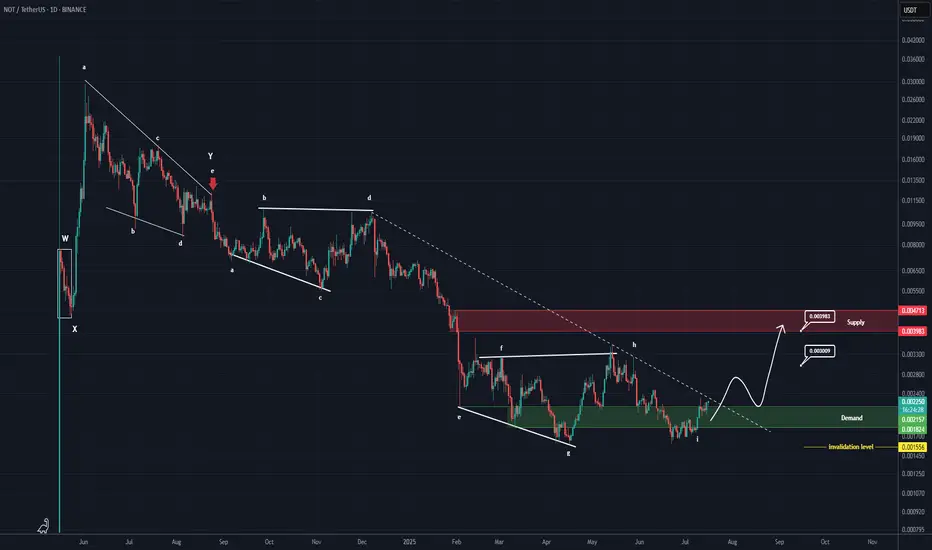
NOTCOIN New Update (1D)From the point where the red arrow is placed on the chart, the correction labeled as NOT has started.
The correction appears to be a symmetrical one, which now seems to be coming to an end. The current upward wave could be the X wave.
In previous analyses, we had also considered the structure to be symmetrical, but on a larger degree. However, based on the data currently available, it seems that the degree of this symmetrical structure is smaller.
If the price holds above the green zone, it may move toward the targets and the red box. The targets are marked on the chart.
A daily candle closing below the invalidation level will invalidate this analysis.
For risk management, please don't forget stop loss and capital management
When we reach the first target, save some profit and then change the stop to entry
Comment if you have any questions
Thank You
NOTUSDT 2D AnalysisNOT ~ 2D Analysis
#NOT This trade is very high risk. Buy if you still have confidence in this coin. With a short term target of at least 15%+.

NOT / USD. Local trend. Reversal zones 08 06 2025Local work ("market noise") is not a breakout of the inverted head and shoulders resistance zone (yellow reversal level). A rollback back to the horizontal channel formation zone with a 100% step. Everything is as before, nothing new can happen, for clarity, I showed the % to the key local support/resistance levels.
NOT Main trend. Channel. 16 03 2025

NOTUSDT 1D AnalysisNOT ~ 1D Analysis
#NOT Buy gradually from here if you still have confidence in this coin with a short term target of at least 15%+.

#NOT/USDT#NOT
The price is moving within a descending channel on the 1-hour frame, adhering well to it, and is heading for a strong breakout and retest.
We are seeing a bounce from the lower boundary of the descending channel, which is support at 0.002465.
We have a downtrend on the RSI indicator that is about to be broken and retested, supporting the upward trend.
We are looking for stability above the 100 moving average.
Entry price: 0.002621
First target: 0.002700
Second target: 0.002777
Third target: 0.002856

NOTUSDT 1D AnalysisNOT ~ 1D Analysis
#NOT Buy when re -testing this support block with a short -term target of at least 10%+ from here.

NOTHING !!!Do you think this will happen, or do you see NOT below $0.002 in the future?
Give me some energy !!
✨We spend hours finding potential opportunities and writing useful ideas, we would be happy if you support us.
Best regards CobraVanguard.💚
_ _ _ _ __ _ _ _ _ _ _ _ _ _ _ _ _ _ _ _ _ _ _ _ _ _ _ _ _ _ _ _
✅Thank you, and for more ideas, hit ❤️Like❤️ and 🌟Follow🌟!
⚠️Things can change...
The markets are always changing and even with all these signals, the market changes tend to be strong and fast!!

#NOT #NOTUSDT #NOTCOIN #AMD #Analysis #Spot #Long #Eddy#NOT #NOTUSDT #NOTCOIN #AMD #Analysis #Spot #Long #Eddy
NOTUSDT Higher Time Frame "AMD" Analysis
Great opportunity to invest spot at a specified price.
Important areas of the higher time frame are identified and labled.
This Analysis is based on a combination of different styles, including the volume style with the ict style. (( AMD Analysis ))
Based on your strategy and style, get the necessary confirmations for this analysis to buy entery the trade.
Don't forget risk and capital management.
The entry point, take profit point are indicated on the chart along with their amount.
The responsibility for the transaction is yours and I have no responsibility for not observing your risk and capital management.
Note: The price can go much higher than the first target, and there is a possibility of a 300% & 1000% pump on this currency. By observing risk and capital management, obtaining the necessary approvals, and saving profits in the target, you can keep it for the pump.
Be successful and profitable.

NOTUSDT 1DNOT ~ 1D Analysis
#NOT Buy gradually after successfully penetrating this resistant line with a short -term target of at least 10%+.

NOT coin is at risk of another drop (2H)At the top of the chart, we have a liquidity pool, and behind this pool, there is an interchange zone, which is a supply area. In this zone, we are looking for sell/short positions.
Additionally, below the price, a liquidity pool is currently forming, which is expected to break downward after collecting orders.
Targets are marked on the chart.
The closure of a daily candle above the invalidation level will invalidate this analysis.
For risk management, please don't forget stop loss and capital management
Comment if you have any questions
Thank You

#NOT/USDT#NOT
The price is moving in a descending channel on the 1-hour frame and is adhering to it well and is heading to break it strongly upwards and retest it
We have a bounce from the lower limit of the descending channel, this support is at a price of 0.001811
We have a downtrend on the RSI indicator that is about to break and retest, which supports the rise
We have a trend to stabilize above the moving average 100
Entry price 0.002000
First target 0.002145
Second target 0.002293
Third target 0.002480

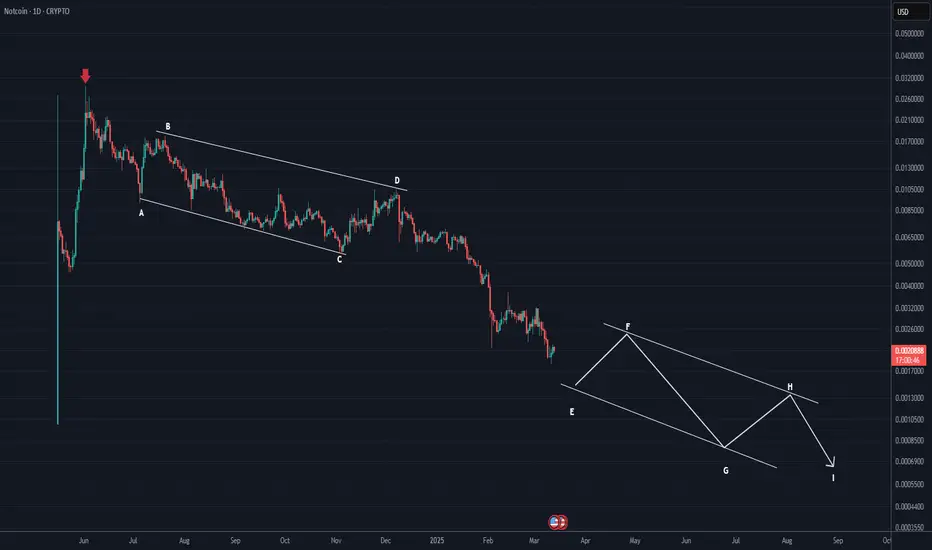
NOTCOIN will remain bearish for a long time (1D)This TON network meme coin seems to have entered a very long correction after its big rally. The correction started from the point where we placed the red arrow on the chart.
The corrective pattern appears to be a large symmetric, and we are currently in its largest wave, which is wave E.
The future path of NOT coin is drawn schematically so you can understand how much time correction and how many waves are left in this pattern.
For risk management, please don't forget stop loss and capital management
Comment if you have any questions
Thank You
NOT daily update#NOT daily update :
not made a long term correction after its pumping after its airdrop and this correction is based on the elliot waves so i think the correction is over and the rising as wave 1 after that can confirm that after that made a sharp down spike as wave 2 now we are in the 3rd wave

NOT going to EXPLODE !#NOT i was tracking this coin for a long time and i think there should be another down wave for this coin this can happen for 2 reasons 👇👇👇
1) once is that this coin is making the 5th wave of bearish which has and ABC pattern the B wave is made and now we are waiting for the C wave
2) #NOT has a huge mount of liq at the bottom of its chart (as you can see in the chart of coinglass)
for these 2 reasons i think that there should be another wave down and after that the market will explode !
also check out this analysis on not 👇👇👇

NOT daily update#NOT chart has a lot of liquidity and stacked volume
the liq at the bottom is taken and also there is some liq above the targets are there
