$NOT/USDT ANALYSISNOT/USDT on the 4-hour chart has recently broken its long-term descending trendline with strong volume confirmation. After the breakout, price sharply retested the broken trendline and is now stabilizing near the confluence of the EMA and Ichimoku cloud support. The retest wick shows buyers defending the structure, suggesting that the market is shifting from a downtrend to a potential accumulation or early bullish phase. As long as price holds above the 0.000586 zone, momentum remains positive toward the upper resistance near 0.000834. The rising volume spike at the breakout and the clean retest indicate healthy demand absorption. However, a clean 4H candle close back below 0.000535 would invalidate the setup and expose the previous low again. Overall, the chart structure favors continuation to the upside if the retest holds, signaling early trend reversal confirmation.
Notusdtlong

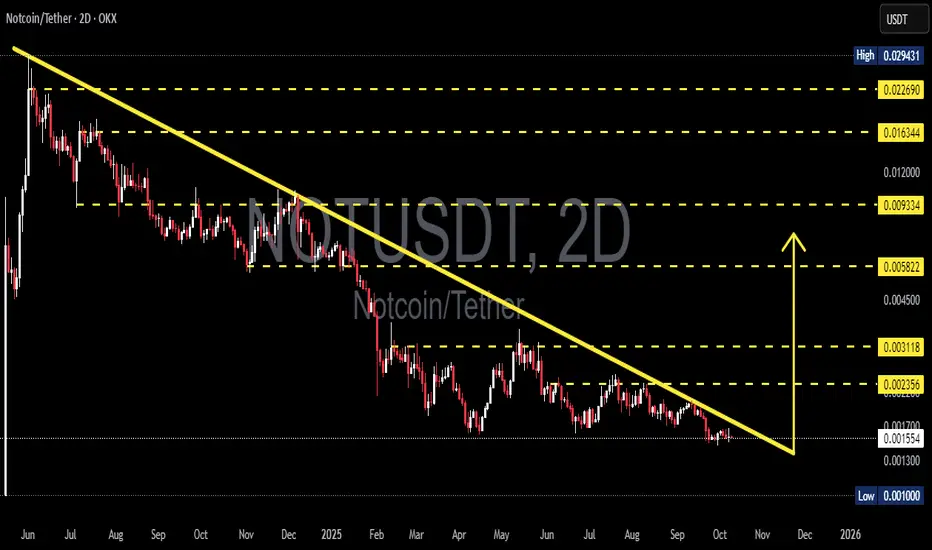
NOT/USDT — Descending Triangle: One Move Away from Expansion?The 2D chart of NOT/USDT reveals a descending triangle formation — a classic compression pattern signaling that the market is reaching a major decision point. For months, price action has been trapped under a falling trendline (yellow), forming a series of lower highs, while buyers continue to defend the 0.0013–0.0010 support zone with persistence.
This setup now represents a make-or-break moment:
Will NOT finally break out of its long-term downtrend, or will it face one last capitulation before finding a true bottom?
---
🔹 Pattern Structure
Pattern: Descending Triangle — a compression setup often seen near the end of a prolonged downtrend.
Interpretation: Still technically bearish, but every failed breakdown strengthens the potential for a bullish reversal.
Volume: Gradually declining — showing quiet accumulation and energy buildup before a potential expansion.
---
🔹 Key Technical Levels
Support Zone: 0.0013 – 0.0010 (major buyer defense)
Current Price: ≈ 0.001558
Resistance Targets:
R1 → 0.002356 (initial breakout target)
R2 → 0.003118 (trend flip zone)
R3 → 0.005822 (momentum expansion)
R4 → 0.009334 – 0.016344 (mid-term resistance cluster)
---
🟢 Bullish Scenario
A confirmed 2D candle close above the yellow trendline with strong volume could trigger a reversal breakout, signaling the end of the prolonged compression phase.
In that case, the next impulsive targets lie near 0.002356 and 0.003118.
Typically, a clean breakout is followed by a retest — the best opportunity for confirmation-based entries.
📈 “Breakout + Retest = Momentum Reversal.”
---
🔴 Bearish Scenario
If the 0.0013–0.0010 support breaks down with expanding sell volume, the descending triangle confirms its bearish continuation role.
This could lead to a quick retest of the 0.0010 zone, potentially marking a final capitulation phase before long-term accumulation begins.
📉 “Losing the floor means retesting history.”
---
⚙️ Overall Perspective
The market is entering the final stage of compression — volatility and volume are tightening, signaling that a major directional move is approaching.
Whether up or down, this next move could define NOT/USDT’s mid-term trend into Q4 2025.
> “The longer the silence, the bigger the explosion that follows.”
---
#NOTUSDT #Notcoin #CryptoAnalysis #DescendingTriangle #BreakoutSetup #PriceCompression #TrendReversal #AltcoinAnalysis #CryptoTrading #TechnicalAnalysis #SupportResistance #MarketStructure
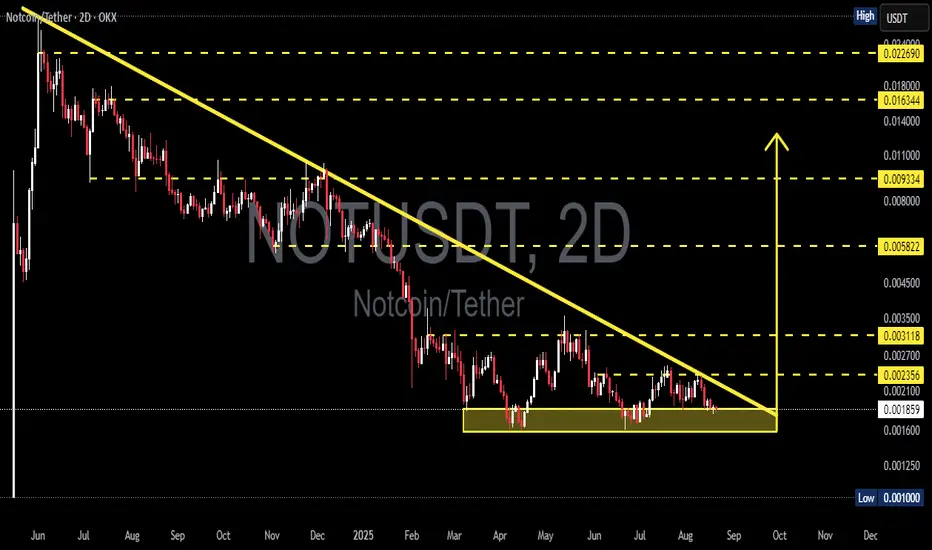
NOTUSDT — Descending Triangle Support! Breakout or Breakdown?Currently, NOT/USDT is trading at a decisive point after a long downtrend. The chart clearly forms a Descending Triangle, a classic pattern that often signals bearish continuation, but under certain conditions can turn into a bullish reversal if a strong breakout occurs.
---
🔎 Pattern & Context
Main Pattern: Descending Triangle (consistent lower highs + strong horizontal support).
Support Zone: 0.0016 – 0.0019 (yellow box). This zone has been tested multiple times, showing buyers are still defending it.
Previous Trend: Strong bearish trend → favors breakdown, but reversal potential remains if bulls manage to break above the descending trendline.
Momentum: Price is being squeezed at the apex of the triangle → a major move is likely imminent.
---
🟢 Bullish Scenario (Upside Breakout)
If price successfully breaks above the descending trendline with a 2D close + strong volume, a reversal setup will be triggered.
🎯 Bullish Targets:
First target: 0.002356 (nearest resistance).
Next targets: 0.003118 → 0.005822.
If strong momentum continues → potential extension toward 0.0093 – 0.0163 (resistance levels shown on chart).
📌 Validation: Breakout + successful retest of the trendline (turning into new support) increases bullish probability.
---
🔴 Bearish Scenario (Downside Breakdown)
If price fails to hold the 0.0016 – 0.0019 support zone, the descending triangle plays out as a bearish continuation pattern.
🎯 Bearish Targets:
Initial target: 0.0010 (previous major low).
If selling pressure accelerates → potential formation of new lows below 0.0010.
📌 Validation: 2D candle close below 0.0016 with strong volume + failed retest = confirmed breakdown.
---
📌 Conclusion & Key Notes
0.0016 – 0.0019 is the key decision zone. Holding it opens the door for a bullish reversal, while breaking it signals continuation of the downtrend.
A major move is approaching as price gets compressed at the triangle’s apex.
Watch out for false breakouts / breakdowns → always wait for volume confirmation.
Strict risk management is crucial, especially for low-cap coins with high volatility and manipulation risks.
#NOT #NOTUSDT #Crypto #Altcoin #PriceAction #TechnicalAnalysis #DescendingTriangle #Breakout #Bearish #Bullish
NOTUSDT 2D AnalysisNOT ~ 2D Analysis
#NOT This trade is very high risk. Buy if you still have confidence in this coin. With a short term target of at least 15%+.

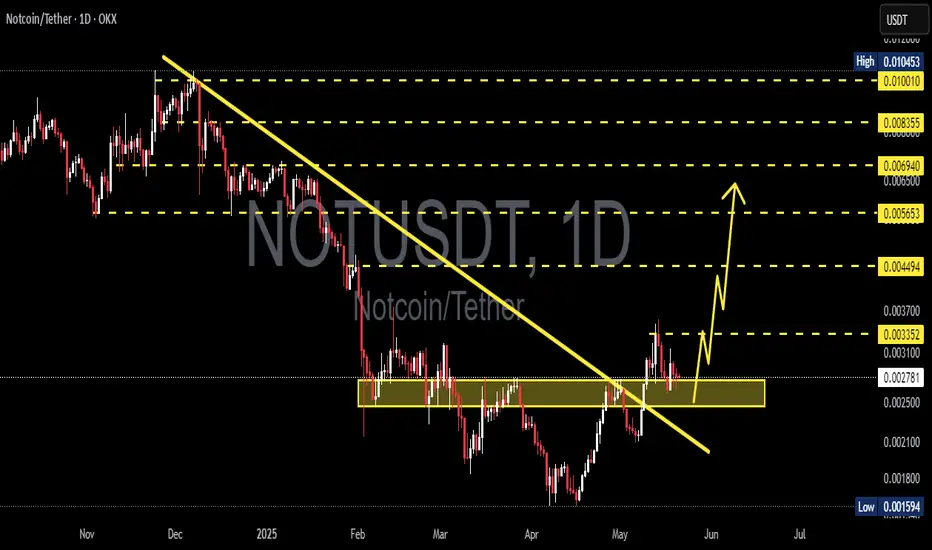
NOTUSDT 1D AnalysisNOT ~ 1D Analysis
#NOT Buy gradually from here if you still have confidence in this coin with a short term target of at least 15%+.

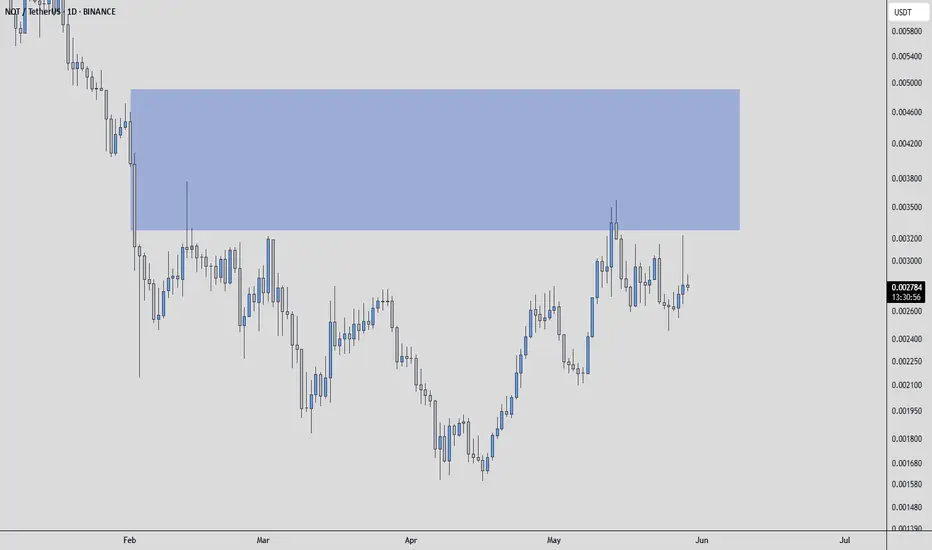
NOTUSDT - SELLERS ARE IN CONTROL!!!Observing NOTUSDT, one identifies a notable blue box on the chart. This area, in the estimation of a discerning investor, appears to function as a significant resistance level.
The principle here is straightforward: when an asset's price ascends to a particular zone and consistently encounters selling interest, preventing further ascent, that zone establishes itself as a resistance. This blue box suggests a concentration of supply, where those who hold the asset are prepared to divest.
At present, my observation indicates that buyers are not actively engaged in overcoming this resistance. The market's current disposition, unfortunately, does not present a bullish outlook for this particular asset.
While technical patterns are not the sole determinant of value, they can illuminate where market participants are distributing positions. A sustained defense of this blue box by sellers, particularly if accompanied by a decrease in buying pressure or an uptick in selling volume, would reinforce its significance. Here, one would also scrutinize the volume footprint for signs of genuine distribution, look for CDV (Cumulative Delta Volume) divergences that might signal a shift in momentum, and patiently await low timeframe (LTF) confirmations to validate any potential short entry.
It is worth noting that my focus is exclusively on assets demonstrating a sudden and significant increase in volume, as such movements often precede more substantial price action. This selective approach helps in concentrating capital where the market is showing clear intent. In this instance, the lack of such decisive buying volume further solidifies my current stance.
Conversely, a decisive breach of such a resistance level would necessitate a re-evaluation, as it would indicate a shift in the balance between supply and demand. However, for the present, this blue box stands as a point of interest for those seeking to understand the potential ceiling for NOTUSDT's price action.
📌I keep my charts clean and simple because I believe clarity leads to better decisions.
📌My approach is built on years of experience and a solid track record. I don’t claim to know it all but I’m confident in my ability to spot high-probability setups.
📌If you would like to learn how to use the heatmap, cumulative volume delta and volume footprint techniques that I use below to determine very accurate demand regions, you can send me a private message. I help anyone who wants it completely free of charge.
🔑I have a long list of my proven technique below:
🎯 ZENUSDT.P: Patience & Profitability | %230 Reaction from the Sniper Entry
🐶 DOGEUSDT.P: Next Move
🎨 RENDERUSDT.P: Opportunity of the Month
💎 ETHUSDT.P: Where to Retrace
🟢 BNBUSDT.P: Potential Surge
📊 BTC Dominance: Reaction Zone
🌊 WAVESUSDT.P: Demand Zone Potential
🟣 UNIUSDT.P: Long-Term Trade
🔵 XRPUSDT.P: Entry Zones
🔗 LINKUSDT.P: Follow The River
📈 BTCUSDT.P: Two Key Demand Zones
🟩 POLUSDT: Bullish Momentum
🌟 PENDLEUSDT.P: Where Opportunity Meets Precision
🔥 BTCUSDT.P: Liquidation of Highly Leveraged Longs
🌊 SOLUSDT.P: SOL's Dip - Your Opportunity
🐸 1000PEPEUSDT.P: Prime Bounce Zone Unlocked
🚀 ETHUSDT.P: Set to Explode - Don't Miss This Game Changer
🤖 IQUSDT: Smart Plan
⚡️ PONDUSDT: A Trade Not Taken Is Better Than a Losing One
💼 STMXUSDT: 2 Buying Areas
🐢 TURBOUSDT: Buy Zones and Buyer Presence
🌍 ICPUSDT.P: Massive Upside Potential | Check the Trade Update For Seeing Results
🟠 IDEXUSDT: Spot Buy Area | %26 Profit if You Trade with MSB
📌 USUALUSDT: Buyers Are Active + %70 Profit in Total
🌟 FORTHUSDT: Sniper Entry +%26 Reaction
🐳 QKCUSDT: Sniper Entry +%57 Reaction
📊 BTC.D: Retest of Key Area Highly Likely
📊 XNOUSDT %80 Reaction with a Simple Blue Box!
📊 BELUSDT Amazing %120 Reaction!
📊 Simple Red Box, Extraordinary Results
📊 TIAUSDT | Still No Buyers—Maintaining a Bearish Outlook
📊 OGNUSDT | One of Today’s Highest Volume Gainers – +32.44%
I stopped adding to the list because it's kinda tiring to add 5-10 charts in every move but you can check my profile and see that it goes on..
NOTUSDT 1D Analysis NOT ~ 1D Analysis
#NOT Buy incrementally from this support block with a short term target of at least 15%+ from here.
#NOT/USDT#NOT
The price is moving within a descending channel on the 1-hour frame, adhering well to it, and is on its way to breaking it strongly upwards and retesting it.
We are seeing a bounce from the lower boundary of the descending channel, this support at 0.002681.
We have a downtrend on the RSI indicator that is about to break and retest, supporting the upward trend.
We are looking for stability above the 100 moving average.
Entry price: 0.002940
First target: 0.003096
Second target: 0.003209
Third target: 0.003428

#NOT/USDT#NOT
The price is moving within a descending channel on the 1-hour frame, adhering well to it, and is heading for a strong breakout and retest.
We are seeing a bounce from the lower boundary of the descending channel, which is support at 0.002465.
We have a downtrend on the RSI indicator that is about to be broken and retested, supporting the upward trend.
We are looking for stability above the 100 moving average.
Entry price: 0.002621
First target: 0.002700
Second target: 0.002777
Third target: 0.002856

NOTUSDT 1D AnalysisNOT ~ 1D Analysis
#NOT Buy when re -testing this support block with a short -term target of at least 10%+ from here.

#NOT/USDT#NOT
The price is moving within a descending channel on the 1-hour frame, adhering well to it, and is on its way to breaking it strongly upwards and retesting it.
We are seeing a bounce from the lower boundary of the descending channel, this support is at 0.002400.
We have a downtrend on the RSI indicator that is about to break and retest, which supports the upward trend.
We are looking for stability above the 100 moving average.
Entry price: 0.002410
First target: 0.0002531
Second target: 0.002600
Third target: 0.002675

NOTUSDT 1DNOT ~ 1D Analysis
#NOT Buy gradually after successfully penetrating this resistant line with a short -term target of at least 10%+.

NOT Coin: Poised for a Breakout? Key Resistance Level in FocusGreetings, fellow traders.
While many cryptocurrencies are experiencing upward momentum or consolidating in preparation for potential rallies, Notcoin (NOT) has recently surged 4-5%, reaching a critical daily resistance zone.
Breakout Potential:
This resistance level has proven significant, with NOT having tested and failed to break through it twice this week. A successful breakout above this zone could unlock substantial upside potential.
Long Trade Setup (Conditional):
Entry Trigger: A confirmed close of a 1-hour or 2-hour candle above the current daily resistance is required. Then, initiate a long position when the price of the subsequent candle surpasses the high of the confirming (breakout) candle. This two-step confirmation helps mitigate the risk of a false breakout.
Target 1: $0.003000 - $0.003100
Target 2: $0.003700 - $0.003800
Risk Management:
This is a higher-risk, breakout-based setup. Implement appropriate risk management, including a defined stop-loss strategy, to protect capital in case of a failed breakout.
Disclaimer: This analysis is for informational purposes only and does not constitute financial advice. Conduct thorough due diligence and risk assessment before making any trading decisions.

#NOT/USDT#NOT
The price is moving within a descending channel on the 1-hour frame, adhering well to it, and is on its way to breaking it strongly upwards and retesting it.
We are seeing a bounce from the lower boundary of the descending channel, this support at 0.002280.
We have a downtrend on the RSI indicator that is about to break and retest, supporting the upward trend.
We are looking for stability above the 100 moving average.
Entry price: 0.002390
First target: 0.002556
Second target: 0.002723
Third target: 0.002890

#NOT/USDT#NOT
The price is moving in a descending channel on the 1-hour frame and is adhering to it well and is heading to break it strongly upwards and retest it
We have a bounce from the lower limit of the descending channel, this support is at a price of 0.001811
We have a downtrend on the RSI indicator that is about to break and retest, which supports the rise
We have a trend to stabilize above the moving average 100
Entry price 0.002000
First target 0.002145
Second target 0.002293
Third target 0.002480

NotUSDT IdeaGreetings, traders.
BINANCE:NOTUSDT
A recent break above $0.003400 suggests a potential upward move towards the resistance level at $0.007000. This presents an opportunity for long trades targeting $0.007000.
Upon reaching this target, a price correction towards the 0.618 Fibonacci retracement level is anticipated. This retracement could offer a favorable setup for further upward momentum, potentially driving the price towards $0.007700 and subsequently $0.078000.
Traders seeking long entries may consider initiating positions above $0.0064000.
Best of luck in your trading endeavors.
Remember that this is just a technical analysis and doesn't guarantee future market movements. Always conduct your own research and manage your risk accordingly.

NOTUSDT Analysis & IdeaHey traders!
Taking a look at NOTUSDT, we can see the price has recently corrected to the 0.618 Fibonacci retracement level, finding support around $0.006250. I believe this correction is temporary and NOTUSDT is likely to resume its upward trend from the $0.006200 - $0.006250 zone, targeting the $0.007000 level.
Trade Idea:
Entry: Long above $0.006370
Take Profit: $0.006950 - $0.007000
Stop Loss: $0.006050
Remember:
This is just my personal view, and it's crucial to always conduct your own research and consider your risk tolerance before making any trading decisions.
Keep a close eye on trading volume and price action for confirmation of any potential upward movement.
Let me know if you have any questions or thoughts on NOTUSDT!
Happy trading!

NOTUSDT 3DNOT ~ 3D
#NOT This is the last support block for this coin. If you still have Conviction on this coin,. Buy in stages with a target of 20%++

NotCoin"🌟 Welcome to Golden Candle! 🌟
We're a team of 📈 passionate traders 📉 who love sharing our 🔍 technical analysis insights 🔎 with the TradingView community. 🌎
Our goal is to provide 💡 valuable perspectives 💡 on market trends and patterns, but 🚫 please note that our analyses are not intended as buy or sell recommendations. 🚫
Instead, they reflect our own 💭 personal attitudes and thoughts. 💭
Follow along and 📚 learn 📚 from our analyses! 📊💡"

notcoin update"🌟 Welcome to Golden Candle! 🌟
We're a team of 📈 passionate traders 📉 who love sharing our 🔍 technical analysis insights 🔎 with the TradingView community. 🌎
Our goal is to provide 💡 valuable perspectives 💡 on market trends and patterns, but 🚫 please note that our analyses are not intended as buy or sell recommendations. 🚫
Instead, they reflect our own 💭 personal attitudes and thoughts. 💭
Follow along and 📚 learn 📚 from our analyses! 📊💡"

NOTUSD Long#NOTUSD (1 day)
Notcoin formed the "PGiP" pattern, we will consider a long with a successful price consolidation above the resistance level of the figure, the target is 0.013! Cancel and break below 0.008
The author's opinion may not coincide with yours! Remember this and take this into account in your trading transactions before making a trading decision.
Your reactions are your support for my work

NOTUSDT POTENTIALLY BULLISHThe crypto space is gradually all shifting into the bullish phase and BINANCE:NOTUSDT is no different. #NOTUSDT has shifted into the bullish phase and I will hold till it comes to 0.01 point. I will not be surprised if the coin does 10x

NOT / USDT : Bitcoin Dips, NOT Holding Strong at Support – EyeinNOT/USDT: Bitcoin Dips, NOT Holding Strong at Support – Eyeing a Bounce Back
NOT/USDT is displaying resilience despite Bitcoin's recent downturn, holding firmly at a crucial support level. This zone has historically proven to be a strong area for buyers to step in, setting the stage for a potential recovery move.
Key insights:
1. Support zone significance: NOT/USDT is currently trading at a well-established support level that has consistently held during previous corrections. This level is critical for determining the next directional move.
2. Bitcoin's influence: The recent Bitcoin dip has weighed on the broader market, but NOT/USDT’s ability to maintain support shows relative strength, indicating buyers are defending this zone.
3. Momentum signals: Momentum indicators such as RSI are showing oversold conditions, suggesting a potential bounce could be on the horizon.
Steps to confirm a bounce:
Look for a clear reversal candle on the 4H or daily timeframe, such as a bullish engulfing or hammer pattern.
Monitor trading volume for an uptick during the bounce, as this would confirm strong buying interest.
Watch for higher lows forming after the bounce, which would indicate a shift towards an uptrend.
Potential targets (post-bounce):
Risk management strategies:
Place a stop-loss below the current support zone to limit downside risk.
Avoid overleveraging and ensure your position size aligns with your overall strategy.
Remain vigilant for Bitcoin’s price movements, as further dips could impact NOT/USDT’s ability to sustain the bounce.
This analysis is for educational purposes only and should not be taken as financial advice. Always conduct your own research before making any trading decisions.
