14 oct push down nasdaqas seen in the video.
we are going short.
dominant force of the day in short.
entry in blue.
stop in red
targets in green
Have fun
Elektra
Nq!!

The NQ dumped to a 4 hour order block created Sept 14th 11pm ESTThe NQ dumped to a 4 hour order block that was created Sunday Sept 14th 11pm EST
Could be coincidence and would make sense to reverse (if it does Monday), but this chart looks TOO Perfect .
Insider Trading at the highest level?
Just looks to perfect to be organic.
I will have my longs in at open, see you at open! : )

Bearish Outlook on NQ📉 Bearish Outlook on NQ
After completing the manipulation phase, NQ has tapped perfectly into the Bearish FVG (1H) zone around 25,366.45 – 25,392.25, sweeping both SSLs in the process. This confirms premium-level distribution, suggesting the market is ready for a downside move.
Scenario 1 – Primary (Bearish Bias):
Price rejects from the Bearish FVG 1H, fails to reclaim 25,366.45, and begins its descent. Liquidity below the BSL at 25,293.65 becomes the first target, followed by a clean run toward 25,264.95, completing a liquidity sweep below recent lows.
Scenario 2 – Rejection & Re-Test:
A short-term push above 25,330.55 (NAS100FT) to re-test the Bearish FVG 1H could offer another entry opportunity before the drop resumes toward 25,293.65 and 25,264.95.
Scenario 3 – Deep Liquidity Grab Before Reversal:
Should price tap deeper into the Bullish FVG 4H, we could see a final liquidity sweep below 25,264.95 before a stronger bullish reaction emerges.
🎯 Overall Bias:
Bearish — targeting liquidity below 25,293.65 and 25,264.95. Manipulation phase complete, distribution underway.
Follow and like for more.
Greetings,
MrYounity

Final sell off ahead of FOMC | Head n ShouldersI believe price will stage one final sell-off before resuming its push toward higher highs. On the 4H chart, a potential Head & Shoulders pattern is forming, suggesting price may fill the hourly gap at 24,856 before or during the FOMC release.
The 15-minute chart offers a more precise entry compared to the 1H and 4H timeframes.
I plan to enter within the 25,149–25,150 price range, provided my bias remains valid heading into the New York open.
Lets get it!⚡

S&P 500 Futures ES $1000 risk per contract/ES in a $1000 risk to $1000 reward position. Bias is bullish but watch out for news. Trailing stops can be used to scalp the market. /MES is only $100 risk per contract for 1:1 ratio. Let watch and see what happens?

ES continuing with my short stratStructure is key when identifying direction. Overall trend isnt as important as you think. When trading reversals I look for large moves in one direction that allows for large moves back, I capitalize off of finding the structure shift and I enter only on discount. Watch your win rate increase when entering deeper into discount.
Trade for Christ

Nasdaq to 25,300? | Long Idea 10/3I believe Nasdaq still has room to climb, with the 25,300 range in sight to finish off the week. The price action closely mirrors the pattern from September 5th–9th, 2025, and I wouldn’t be surprised to see history repeat itself here.
I’m planning to go long from the 25,105 imbalance, holding through all-time highs and into the void through 25,300. Once ATHs are broken, I’ll trail my stop closely to lock in profits.

Market on Fire: S&P 500 & Nasdaq Rally Towards New HighsWe have a beautiful P-Shape volume profile formed at the top and we broke and closed above it.
The P-shape volume profile is bullish profile that is formed when large volumes are transacted at the highs meaning participants a willing to pay premium price . You can see the POC so close to the top of the VAH
I checked the CVD of the volume on a footprint chart and i see the volume has -ve Delta , which means alot of aggressive sellers transacted there trying to push the price down. Now that they are being squeezed slowly and start closing out their positions, it should fuel the uptrend. i entered the trade soon as we broke and closed above the value area.
Food for thought.. Who was willing to pay the high price to buy from the aggressive sellers?
DEFINITIONS
POC- point of control
VAH- Value area high
CVD- Cumulative Volume Delta
Target is the ExoFade area..Lets see how this trade goes

Short Trade Idea for 9/30 | NQI’m anticipating price to either push into the 1H bearish imbalance at 24,894 or reject from the NWOG around the 24,856 range before turning lower toward the 24,640.00 range. My bias is firmly short for now — but I’ll reassess as we approach the open.

NQ Shorts re entryAfter the recent win I saw a new clear break above my set levels. And a perfect textbook reversal formed. Entere more shorts.
Setting alerts and waiting patiently is how consistency starts, once you form those small habits over time it becomes simple repition and then profitability flows from there.
I didnt find this consistency until I aligned my trading with Christ.

Nq shorts at the momentI took a short position here and am looking to trail it down for a decent RR.
Glory to Christ!

My past present and Futures with Christ!We have been doing things quite different lately.
One setup is all we do.
It is quite boring.
But it works
and Christ is the center of it all!
A Bullish Friday for NasdaqNow that support has been reached, I’m anticipating Nasdaq to resume its bull run. During the AM session, I’ll be watching for either a double bottom or an inverse head-and-shoulders pattern to form.
On the daily chart, I’m anticipating a rejection from the 24,600 Daily FVG.
It may be too early to confirm, so I’ll revisit and update this idea in the morning.
Lets go Long⚡

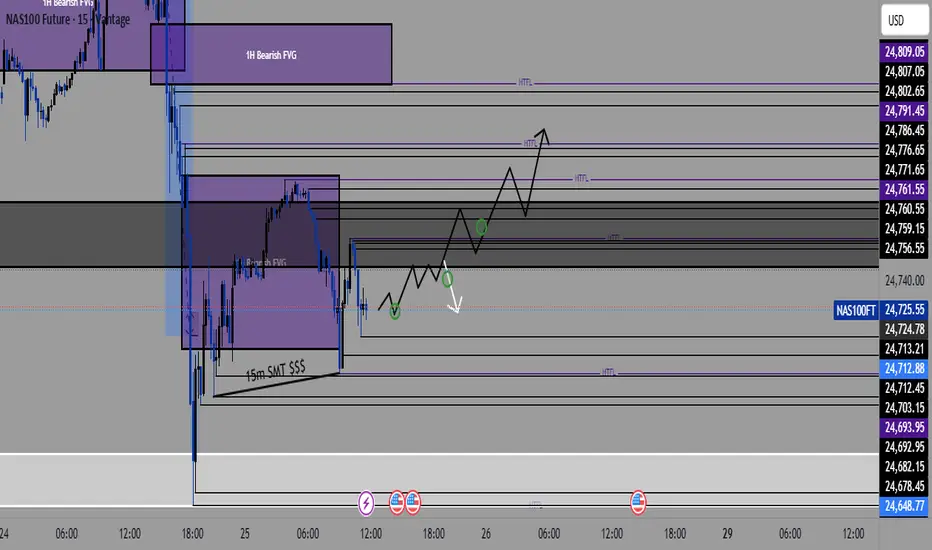
NAS100 (15-Minute Timeframe)🔍 Key Levels to Watch:
Bullish Setup 👇: After a dip in price, we've seen potential accumulation at the 15-minute FVG (Fair Value Gap), setting up for a possible bounce. 🟢
Bearish Resistance ⬆️: Price is currently interacting with a 1-hour Bearish FVG, with potential for further downside if resistance holds. ⛔️
🔵 Potential Trade Plan:
Look for a Pullback: Price could retrace to the higher time-frame resistance zones around 24,791.45 (HTFL) or 24,786.45.
Key Entry Points: Focus on price action near the 15-minute FVG, which may give us a clearer bullish confirmation. 🟢
Target Zones: Aiming for 24,791.45 and higher based on overall momentum.
🔥 Stay alert and trade wisely! Always use proper risk management.
Greetings,
MrYounity
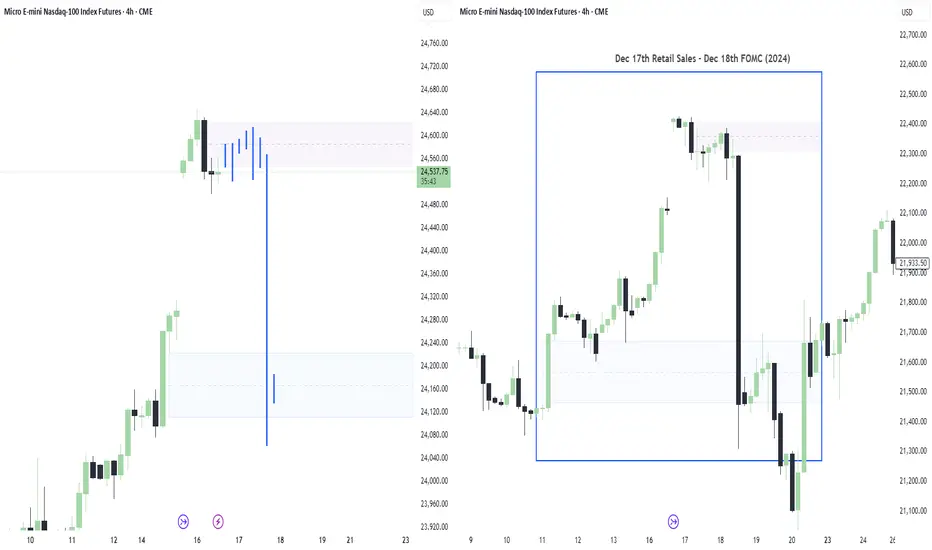
Nasdaq Echoing December FOMC| NQ1 Short SetupAfter spotting the new day opening gap, I immediately analyzed the charts for a comparable All-Time High NDOG scenario. Sure enough, I found nearly identical price action — unfolding on the same days and with the exact same news catalysts.
I’m planning to short from around 24,600.00, with the expectation that 24,200.00 will get taken out.
Let's see how this plays out⚡
Is NASDAQ going for a correction or Stop Hunt?Are we on the right track? If I missed anything please let me know in the comments 🙏🏾

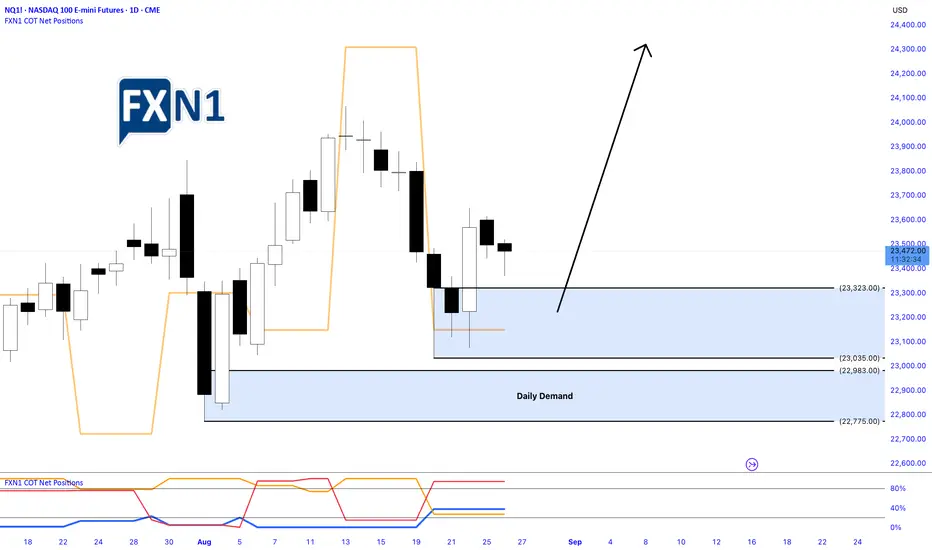
Nasdaq Pulls Back After Friday’s Rally: Identifying Demand ZoneYesterday, the Nasdaq underwent a pullback following a robust bullish surge on Friday. During this correction, a fresh Daily Demand Zone emerged on the chart, signaling potential support levels. Traders are now eyeing this area as an opportunity to position for a possible new high, should the market retrace further today. The current outlook favors a long setup, with anticipation of a continued upward move contingent on the price respecting the identified demand zone.
✅ Please share your thoughts about NQ1! in the comments section below and HIT LIKE if you appreciate my analysis. Don't forget to FOLLOW ME; you will help us a lot with this small contribution.
NAS still charging HighsEverything explained in video, please let me know if I may have missed any details!

From -$450 to +450 to -$450 to +$350. Revenge trading example First 2 trades minus 200. Should have stopped. Wild swings from profit to loss to profit. Bad trading but good result. Lesson not learned.
I'm using fixed range volume profile, overnight highs and lows, 9 and 21 ema's, and VWAP. I trade momentum with breaks and retests of key levels (explained in the video). Bear and bull flags.
I tried to include screenshots of my Ninja execution screen and Apex PnL screen but they didn't come through.

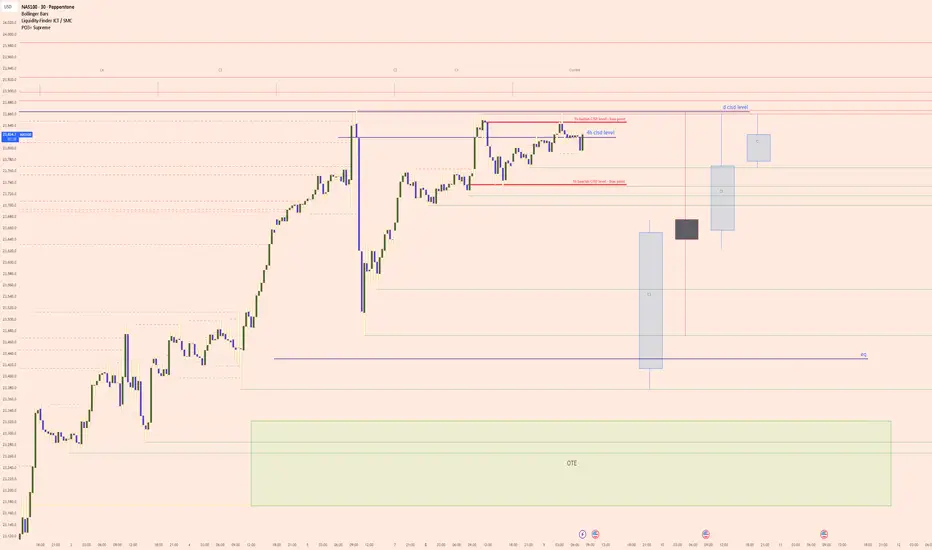
NAS100 (Nasdaq) Key Levels and Probable Draw on LiquidityA clear bullish market structure driven by an aggressive upward displacement.
This energetic move to the upside has created several price inefficiencies, or gaps, which are areas where price delivery was one sided.
Currently, price is consolidating in a premium range, above the equilibrium of the recent impulse leg.
The logical draw on liquidity, or the ultimate target for this bullish momentum, is the distinct old high labeled as the "d cisd level" (Daily change in the state of delivery).
The market is likely reaching for this level to clear out any resting buy side orders.
Before reaching that ultimate target, a retracement is a high probability event.
Price may pull back to rebalance the inefficiency at the "4h cisd level", which should now act as a significant support area.
This would represent a move back into a relative discount, offering a more favorable entry for buyers aiming for the highs.
Should this level fail, a deeper retracement into the larger green zone labeled "OTE" would signify an optimal entry point within the overall bullish leg.
The narrative remains bullish as long as these key lower levels of support are respected.
The alternative path would likely have led to chasing price in a premium, resulting in a poor risk to reward entry. PEPPERSTONE:NAS100 CME_MINI:NQ1! CME_MINI:MNQ1!
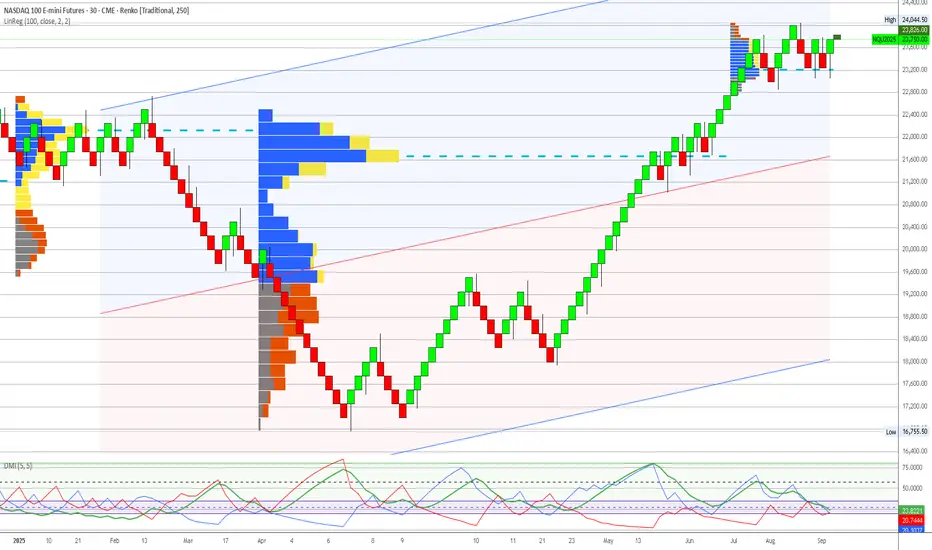
Nasdaq 100 (NQ) - Technical Analysis Report - 20250908Analysis Date: September 8, 2025
Current Price: 23,671
Market Session: Post-Market Analysis
---
Executive Summary
Nasdaq 100 presents a moderately extended equity position requiring defensive management, but with meaningful institutional support structure revealed through 3-quarter volume profile analysis. While trading above recent institutional accumulation, the presence of multiple quarterly POCs creates a more robust support framework than initially assessed. This positioning requires cautious defensive strategies rather than emergency liquidation, with clear institutional reference levels for risk management.
---
Quarterly Volume Profile Analysis
3-Quarter Institutional Positioning Intelligence
The 3-quarter volume profile (Q1-Q3 2025) reveals a complex but supportive institutional positioning pattern across multiple price ranges:
Multi-Quarter Institutional Activity Zones:
Q1 2025: Heavy blue institutional accumulation at 21,800-22,200 range
Q2 2025: Substantial blue volume during correction at 19,800-20,500 range
Q3 2025: Fresh institutional activity developing at 22,000-22,400 levels
Current price (23,671) moderately extended above most recent institutional positioning
Comprehensive Support Structure:
Primary Support: 22,000-22,400 (Q1/Q3 institutional convergence zone)
Secondary Support: 20,200-20,500 (Q2 correction accumulation)
Extended Support: 19,500-20,000 (historical institutional floor)
Current Extension: 6-8% above primary institutional zones (manageable vs. catastrophic)
Institutional Pattern Analysis:
21,800-22,200: Q1 original institutional positioning validates current levels
19,800-20,500: Q2 correction buying shows institutional conviction during weakness
22,000-22,400: Q3 re-engagement demonstrates continued institutional participation
Above 23,000: Moderate extension requiring defensive positioning
Price Structure Context
Historical Pattern Recognition:
The 3-quarter analysis reveals continuous institutional engagement rather than abandonment, indicating healthy market structure with multiple layers of smart money support. This pattern suggests institutional rotation and repositioning rather than wholesale exit from technology exposure.
Revised Risk Assessment:
Moderate Extension: 6-8% above institutional levels vs. previously assessed 18%+
Multiple Support Layers: Three quarterly POCs provide robust institutional framework
Institutional Continuity: Ongoing smart money participation throughout 2025
Risk Definition: Clear institutional boundaries at multiple levels for defensive management
Sector Composition and Market Leadership
Technology Sector Positioning:
Artificial intelligence leadership driving institutional reallocation
Mega-cap concentration providing stability and institutional interest
Innovation premium supporting elevated valuation multiples
Defensive technology characteristics during uncertain economic cycles
---
Execution Chart Technical Analysis
Current Technical Configuration - MIXED SIGNALS
DEMA Analysis - MOMENTUM CONCERNS:
Black Line (Fast DEMA 12): Currently at 23,671
Orange Line (Slow DEMA 20): Currently at 23,597
Configuration: Bullish but showing momentum deceleration
Trend Bias: Technical momentum weakening despite continued bullish bias
DMI/ADX Assessment - TREND MATURITY:
ADX Level: Declining from previous highs, indicating mature trend phase
+DI vs -DI: +DI maintaining slight edge but margin narrowing
Momentum Direction: Signs of trend maturation after extended advance
Trend Strength: Weakening ADX suggests institutional repositioning phase
Stochastic Analysis - OVERBOUGHT BUT NOT EXTREME:
Tactical Stochastic (5,3,3): Overbought with some negative divergence
Strategic Stochastic (50,3,3): Extended levels but within historical norms
Divergence Analysis: Moderate negative divergences suggesting consolidation need
Support and Resistance Levels
Critical Technical Levels:
Current Resistance: 24,000 (psychological and technical barrier)
Immediate Support: 23,400 (DEMA cluster support)
Key Support: 22,800 (recent consolidation boundary)
Major Support: 22,200 (Q1/Q3 institutional convergence)
Critical Support: 20,500 (Q2 institutional accumulation)
Ultimate Support: 19,500-20,000 (historical institutional floor)
---
Trading Scenarios and Setup Criteria
Scenario 1: Defensive Profit-Taking Setup (PRIMARY)
Recommended Position Management:
Systematic reduction of existing positions by 50-75%
Profit-taking priority given moderate extension above institutional levels
Maintain small tactical exposure with tight risk management
Capital reallocation to higher-conviction institutional accumulation opportunities
Profit-Taking Protocol:
Primary Action: Reduce positions by 50-75% at current levels
Secondary Reduction: Complete exit on failure to hold 22,500 support
Stop Management: Trail stops using 22,200 institutional support
Cash Allocation: Redirect capital to commodity opportunities with stronger institutional backing
Scenario 2: Tactical Range Trading (SECONDARY)
Range-Bound Management:
Defined range: 22,200-23,800 (institutional support to resistance)
Small position tactical trading within institutional boundaries
Quick profit-taking on bounces toward 23,500-23,800
Defensive positioning on approaches to 22,200 support
Range Parameters:
Long Zone: 22,200-22,500 (institutional support approach)
Short Zone: 23,600-23,800 (resistance approach)
Stop Distance: 400-600 points maximum
Position Size: Reduced allocation (1% account risk maximum)
Scenario 3: Breakdown Management (DEFENSIVE)
Support Violation Protocol:
Break below 22,200 requires immediate position liquidation
Institutional support violation indicates potential deeper correction
Target return to 20,200-20,500 Q2 institutional accumulation
Complete avoidance until clear institutional re-engagement
Breakdown Parameters:
Critical Level: 22,200 (institutional support)
Action Required: Immediate exit of all positions
Targets: 20,500, 20,000, 19,500 (institutional accumulation zones)
Re-entry Criteria: New institutional accumulation evidence required
---
Risk Management Protocols
Position Sizing Guidelines
Defensive Approach (Recommended):
Maximum Risk: 1.5% of account (reduced from standard due to extension)
Contract Calculation: Account Size × 0.015 ÷ (Stop Distance × $5)
Example: $100,000 account with 500-point stop = 40 contracts maximum
Rationale: Extended positioning requires conservative allocation
Stop Loss Hierarchy
Tactical Stop: 23,200 (execution chart support cluster)
Strategic Stop: 22,200 (institutional support boundary)
Emergency Stop: 20,500 (Q2 institutional accumulation violation)
Portfolio Management Framework
Defensive Positioning Strategy:
Current Holdings: Reduce exposure by 50-75%
New Positions: Limited tactical exposure only
Capital Reallocation: Redirect to institutional accumulation opportunities (NG, CL, 6E)
Monitoring Frequency: Daily assessment of institutional level respect
---
Market Context and External Factors
Technology Sector Fundamental Assessment
Supporting Factors:
Artificial intelligence revolution driving institutional reallocation
Productivity gains supporting elevated valuation multiples
Defensive growth characteristics during economic uncertainty
Innovation leadership providing competitive advantages
Risk Factors:
Interest rate sensitivity affecting growth stock premiums
Regulatory scrutiny on mega-cap technology companies
Valuation concerns at current extension levels
Economic cycle sensitivity for discretionary technology spending
Institutional Investment Trends
Smart Money Positioning:
Continued institutional engagement evidenced by Q3 volume activity
Rotation within technology rather than wholesale sector exit
Quality focus on mega-cap names with defensive characteristics
AI theme driving strategic institutional reallocation
---
Monitoring Checklist and Alert Levels
Daily Monitoring Requirements
Institutional Respect: Monitor behavior at 22,200 support boundary
DEMA Configuration: Watch for momentum deterioration or bearish crossover
Volume Analysis: Track institutional activity at current levels
Sector Rotation: Monitor technology vs defensive sector performance
Policy Impact: Federal Reserve decisions affecting growth stock valuations
Critical Alert Levels
Risk Escalation Alerts:
Break below 22,200 institutional support with volume
DEMA bearish crossover below 23,400
ADX declining below 20 with -DI gaining dominance
Technology sector rotation accelerating toward defensives
Defensive Action Triggers:
Multiple failures to break above 24,000 resistance
Volume decline on any rally attempts above 23,500
Institutional selling evidence (yellow volume) at current levels
Federal Reserve policy shifts affecting interest rate outlook
---
Strategic Outlook and Risk Assessment
Risk/Reward Analysis
Moderate Risk Profile:
Upside Potential: Limited 500-1,000 points to major resistance
Downside Risk: 1,500-3,000 points to institutional accumulation zones
Risk/Reward Ratio: Unfavorable 1:2+ downside bias
Probability Assessment: Moderate (35%) for further upside, High (65%) for correction
Portfolio Allocation Recommendation
Defensive Management Required
Nasdaq 100 requires defensive positioning due to moderate extension above institutional levels, but the presence of multiple quarterly POCs provides meaningful support structure. While not emergency territory, the asymmetric risk profile favors systematic profit-taking and capital reallocation to higher-conviction opportunities with stronger institutional backing. The 3-quarter analysis reveals ongoing institutional engagement, allowing for tactical exposure with proper risk management.
Allocation Framework:
Current Portfolio Weight: Reduce to 8-12% maximum (from higher previous levels)
Entry Method: Limited tactical positions only until institutional re-accumulation
Hold Period: Short-term tactical only, systematic profit-taking
Exit Strategy: Defensive reduction with 22,200 as critical support
---
Conclusion and Strategic Assessment
Nasdaq 100 analysis demonstrates the importance of comprehensive timeframe evaluation in institutional intelligence assessment. The 3-quarter volume profile reveals a more nuanced risk picture than initially assessed, showing continued institutional engagement across multiple price levels. While defensive positioning remains appropriate due to moderate extension, the presence of multiple institutional support layers allows for tactical exposure rather than complete avoidance. Current conditions warrant systematic profit-taking with clear institutional boundaries for risk management.
Strategic Priority: Defensive positioning with systematic profit-taking while respecting institutional support levels at 22,200 and 20,500 as critical risk management boundaries.
Next Review: Daily monitoring of institutional level respect and momentum indicators
Position Management: Systematic reduction with defensive stops at institutional boundaries
---
Important Disclaimer
Risk Warning and Educational Purpose Statement
This analysis is provided for educational and informational purposes only and does not constitute financial advice, investment recommendations, or trading signals. All trading and investment decisions are solely the responsibility of the individual trader or investor.
Key Risk Considerations:
Futures trading involves substantial risk of loss and is not suitable for all investors
Past performance does not guarantee future results
Market conditions can change rapidly, invalidating any analysis
Leverage can amplify both profits and losses significantly
Individual financial circumstances and risk tolerance vary greatly
Professional Guidance: Before making any trading decisions, consult with qualified financial advisors, conduct your own research, and ensure you fully understand the risks involved. Only trade with capital you can afford to lose.
Methodology Limitations: Volume profile analysis and technical indicators are tools for market assessment but are not infallible predictors of future price movement. Market dynamics include numerous variables that cannot be fully captured in any single analytical framework.
The views and analysis presented represent one interpretation of market data and should be considered alongside other forms of analysis and individual judgment.
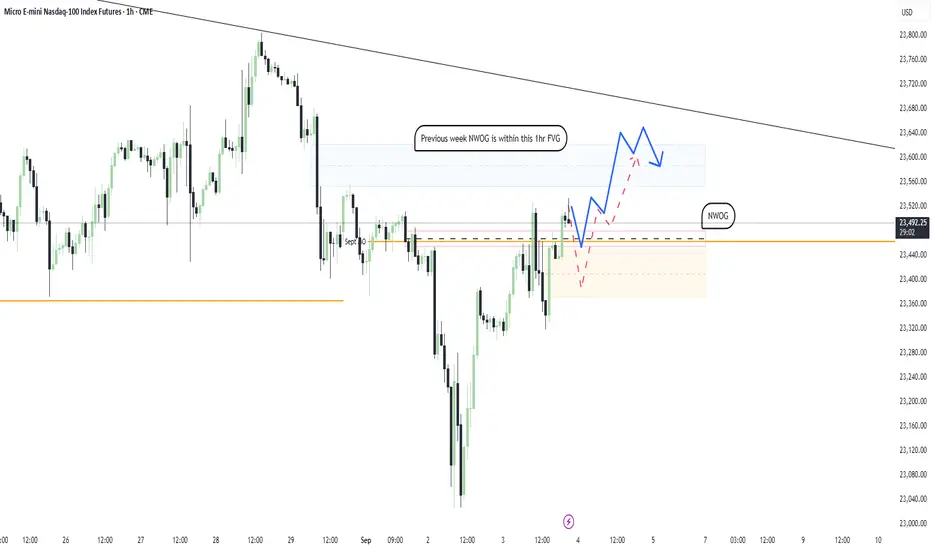
Is Nasdaq still Bullish?I’m still sensing bullish momentum on Nasdaq. My expectation is for price to retrace back into this week’s NWOG before making a push toward last week’s NWOG and the 1-hour gap at 23,583.00. There’s also a possibility we dip to fill the gap at 23,400.00 first, but if that scenario plays out, I don’t see price maintaining its bullish momentum afterward.
On the weekly chart, price continues to strongly respect the Bullish OB formed in the first week of August. As long as this level holds, I expect momentum to carry us higher in the near term.
We'll see tomorrow morning⚡