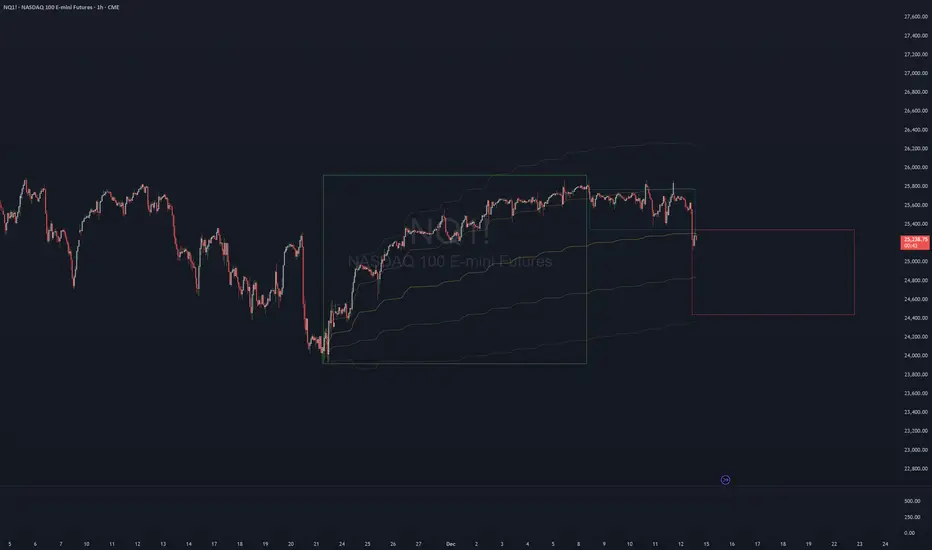
NQ for Christmas WeekNot entirely sure what will happen this week but volume will be odd over the holidays.
Would not expect this 200 point move, however after the most recent bounce off that weekly level it would make sense for this trend to continue.
Yellow levels are weekly. Orange level is most relevant 4hr level
BreakPoint LITE plotted the buy signal
TrenVantage LITE plotted the trends
Levels derived from TrenVantage TRADER pro indicator.
Nq!!

WEEKLY SPY (ES-SP500-SPX-US500) Outlook - Prediction (14 DEC)WEEKLY SPY (SP500-SPX-US500) Outlook - Prediction (14 DEC)
📊 Market Sentiment
Market sentiment has turned slightly bullish again following the FED’s rate cut decision. We saw the market react quickly after Powell’s speech. QE has restarted, and the FED stated it will buy $40 billion of Treasury bills over the next 30 days. This narrative supports the bullish case; however, $40B is relatively small when compared to the overall size of the U.S. market.
At the same time, the bearish narrative is strengthening. Powell stated that “rates are now in a plausible range of neutral,” and the FED emphasized that it will assess incoming data until the January meeting. No decision has been made for January yet.
This keeps the market in a state of uncertainty and when the market lacks a clear narrative, it often turns bearish. Keep this in mind.
📈 Technical Analysis
Price ran the 690 level and printed another all time high, which I highlighted in last week’s prediction (see the linked idea below). However, although price tagged 690, it failed to close above it, and we saw a strong rejection.
This reaction is a textbook example of a range deviation model. When price cannot close above a key level, it often seeks lower prices to gather liquidity and energy for continuation.
📌Prediction – Game Plan
There are two scenarios I am monitoring:
Scenario 1 (Black Scenario) – Bullish:
Price targets the 678.75 level and runs that swing but fails to close below or closes back above 678.75. This would indicate that price has collected sufficient liquidity to expand higher.
In this case, I will be buying calls, taking partial profits at 684.25, and letting the remainder run toward all time highs.
Scenario 2 (Red Scenario) – Bearish:
Price aggressively breaks 678.75 and closes below it on a 4H candle. In that case, I will look to buy puts around 678.75 if price provides a retest.
My first target will be 670, followed by 660.5.
The 670 level may act as a reversal zone for SPY. If we tap this level and see a daily close above 670, I will consider that price is attempting to seek higher levels again.
💬 For detailed insights and broader market context, please check my Substack link in profile.
For educational purposes only. This is not financial advice.

WEEKLY QQQ (NQ-US100-USTECH) Outlook - Prediction (14 DEC)WEEKLY QQQ (NQ-US100-USTECH) Outlook - Prediction (14 DEC)
📊 Market Sentiment
Market sentiment has turned slightly bullish again following the FED’s rate cut decision. We saw the market react quickly after Powell’s speech. QE has restarted, and the FED stated it will buy $40 billion of Treasury bills over the next 30 days. This narrative supports the bullish case; however, $40B is relatively small compared to the overall size of the U.S. market.
At the same time, the bearish narrative is strengthening. Powell stated that “rates are now in a plausible range of neutral,” and the FED emphasized that it will assess incoming data until the January meeting. No decision has been made for January yet.
This keeps the market in a state of uncertainty and when the market lacks a clear narrative, it often turns bearish. Keep this in mind.
📈 Technical Analysis
QQQ hit the 629 level, as I pointed out last week. I am linking last week’s QQQ prediction below for reference.
Price ran the 629 level but could not close above it. After that, we saw selling pressure due to SPY and YM hitting all time highs and getting rejected. QQQ was the weaker index last week, which explains why we did not expand as much as SPY and why QQQ failed to reach all time highs.
I believe the expansion higher will resume, but first price needs to gather more energy before continuing upward.
📌 Prediction – Outlook
I am tracking three different scenarios:
Scenario 1 (Black Line) – Bullish:
Price runs the 610.5 level and closes above it. If this occurs, I will be buying calls, targeting 617.5 first, with a runner for higher levels.
Scenario 2 (Orange Line):
Price retraces to 610.5 and closes below, creating a deeper pullback. Price then reaches 605.5 and closes back above it. This would likely initiate bullish momentum.
In this case, I would be buying calls, targeting 610.5 first and 617.5 as the second target.
Scenario 3 (Red Line) – Bearish:
Price retraces to 610.5 and aggressively closes below. Price then continues lower toward 597.5 without showing strength.
If price later closes back above 597.5, I will look to buy calls.
Initial profit targets would be 605.5 and 610.5.
💬 For detailed insights and broader market context, please check my Substack link in profile.
For educational purposes only. This is not financial advice.

SPY (ES-US500-SPX) Weekly Prediction – Outlook (21 DEC)SPY (ES-US500-SPX) Weekly Prediction – Outlook (21 DEC)
📊 Market Sentiment
Market sentiment turned fully bullish after the CPI data came in significantly lower than expected on Thursday. While the expectation was 3.1%, the actual CPI print came at 2.7%, which was a meaningful downside surprise.
This data does not directly determine the outcome of the January FED meeting, as another CPI report will be released on January 13, 2026, which will be far more critical for the FED’s decision making process. However, the current soft inflation trend increased the probability of another lower CPI reading in January, which positively impacted risk sentiment across markets.
📈 Technical Analysis
In my previous SPY analysis last week, I clearly outlined the expectation of an early week pullback followed by a precise reversal level. That scenario played out exactly as anticipated.
Following the CPI release, price completed its reversal and closed the week with very strong bullish price action on Friday. In my opinion, this behavior suggests that the corrective phase has likely ended and price is now preparing for continuation to the upside.
📌 Game Plan
I think price may target the 683.5 level early in the week.
For call options and long positions, the key lower timeframe reaction zones I will be monitoring are 678.25 and 675.25.
If price rallies directly toward 683.5, I plan to sell the majority of my existing call positions around that level. However, if price first tests 678.25 or 675.25 before reaching 683.5, I am considering adding additional call exposure from those zones.
That said, my decision to enter will strongly depend on 1H and 4H candle closes. I will not enter positions in a market that simply breaks through these levels. If price tests these zones and prints strong bullish 1H or 4H closes, that is when I will begin executing call option entries.
💬 For deeper sentiment and strategy insights, subscribe to my Substack free access available.
This analysis is for educational purposes only and does not constitute financial advice. Always conduct your own research before trading or investing.

QQQ (NQ-US100) Weekly Prediction – Outlook (21 DEC)QQQ (NQ-US100) Weekly Prediction – Outlook (21 DEC)
📊 Market Sentiment
Market sentiment turned fully bullish after the CPI data came in significantly lower than expected on Thursday. While the consensus expectation was 3.1%, the actual CPI print came at 2.7%, representing a meaningful downside surprise.
This data does not directly determine the outcome of the January FED meeting, as another CPI report will be released on January 13, 2026, which will be far more critical for the FED’s decision making process. However, the current soft inflation trend increased the probability of another lower CPI reading in January, which positively impacted risk sentiment across markets.
📈 Technical Analysis
Last week’s QQQ analysis played out perfectly. I hope you were able to capitalize on it. Price reversed precisely from the levels we anticipated following the CPI release. I am linking last week’s QQQ weekly analysis below for reference.
After the CPI data, price transitioned back into a clean bullish structure on both the daily and weekly timeframes. On Friday, QQQ rallied impulsively and closed the week with strong bullish momentum.
Overall, I think the market structure supports bullish continuation.
📌 Game Plan
I think QQQ may directly test 618.5 (Target 1) early in the week, followed by a move toward 625.75. These are the two bullish targets I expect to be reached within this week.
Price may also move toward these targets without any meaningful retracement. I plan to close one third of my call options at 618.5 and the remaining portion at 625.75 from the positions I am holding since Thursday.
If price pulls back to 611.75 or 607 before reaching 625.75 and prints strong 1H or 4H bullish candle closes, I will look to add new call option positions targeting 625.75.
In the event of a developing bearish structure, I will provide updates. However, at this stage, I do not see any clear bearish signals.
💬 For deeper sentiment and strategy insights, subscribe to my Substack free access available.
This analysis is for educational purposes only and does not constitute financial advice. Always conduct your own research before trading or investing.

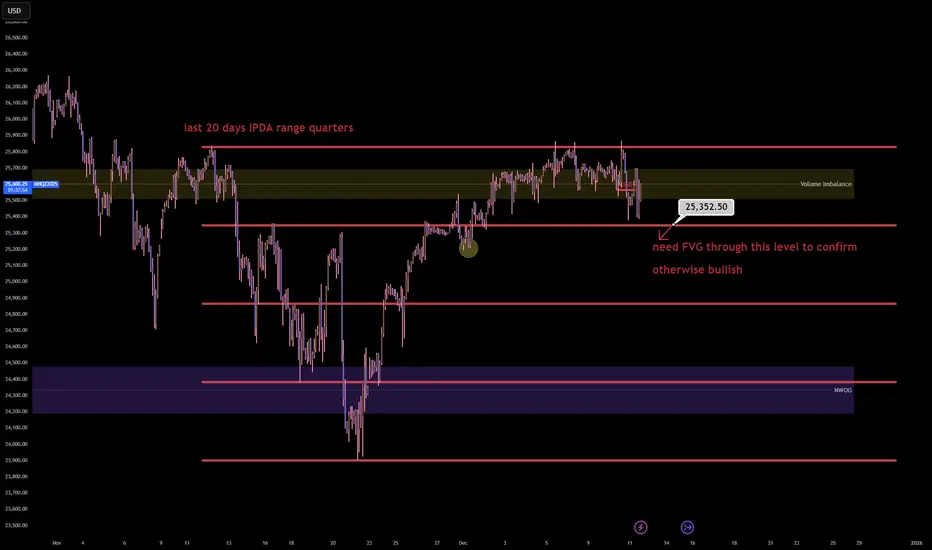
267 handle move bullish - NQ
Lower 1D Shadow quadrant exactly respected, which is a strong bullish sign according to ICT
1D Breaker MT (midpoint or mean-threshold) exactly respected with the candle bodies, which is also a strong bullish sign according to ICT
The event horizon - which is the midpoint of 2 new-day- or new-week-opening-gaps align exactly with the 1D volume imbalance CE (consequent encroachment or midpoint)
Strong bullish market-structure and the movement aligns with seasonal tendencies as well

NQ 100 E-mini - Technical Update: C-D Leg Evolution & ProjectionAnalysis:
A bullish AB=CD harmonic pattern remains in progress. The C-D leg has exhibited a strong impulsive advance, aligning with expected volume profile. However, price has yet to reach the primary Fibonacci projection cluster that defines the pattern's D-point completion zone.
Recent Price Action & Interpretation:
A pullback occurred following a test of the initial 1.000 Fibonacci projection (25,323). This is interpreted as a routine retracement within the broader C-D leg, not a reversal signal.
Critical Technical Tenet: The pattern is not considered complete until price tests the 1.272-1.414 Fibonacci extension zone, which serves as the primary confluence for the D point.
Forward Outlook & Triggers:
With the pattern still within its normative completion window, the path of least resistance remains upward toward the key projection zone. A sustained move into the 1.272-1.414 area is sought for potential long exit or reversal setups. Any breach below would negate this constructive view.

NQ (Nasdaq 100 Futures) - Technical Short SetupMarket Context & Thesis
Price action on the NQ is approaching a significant technical confluence, suggesting a potential reversal zone favorable for short positioning. The setup is defined by two key Fibonacci retracement levels aligning closely, indicating strengthened resistance.
Technical Rationale
Primary Resistance Confluence: Price is nearing the convergence of two distinct .382 Fibonacci retracement levels.
A longer-term .382 retracement measured from the late-October high to the November low.
A more recent .382 retracement from the December 10th high.
Volume Analysis: The rally to the longer-term .382 level in November was accompanied by strong volume (~11M), potentially representing a prior distribution zone. The subsequent advance to the current zone has occurred on notably lower volume (~3M), indicating weakening bullish momentum and lack of broad participation, which supports the reversal premise.
Conclusion
The confluence of dual Fibonacci resistance, corroborated by divergent volume profiles, presents a high-probability short entry opportunity. The trade structure offers a disciplined, quantified approach with a positive expected value based on 3:1 risk-reward framework.

NQ Update 24,816 - Funded Future's TraderMy target for EOD tomorrow. Obviously through future's you have the ability to follow these through options a bit better.
100% On all future callouts and option callouts. I stream live on YT everyday.
Ask about the indicator it's free.

NQ Trade idea Christmas week (12/22-12/26)Basically using fib .618-.79 level.
1.wait for it to be tapped
2.confirmaton for entry fvg, ifvg, 20 ema crossed
3.stop loss
a). Tight- top of fvg formed
b). Moderate- top of structure
c). Bigger - Top of entry zone

NQ; Continuation to lower demand? 📈 Hey Traders!
Here’s a fresh outlook from my trading desk. If you’ve been following me for a while, you already know my approach:
🧩 I trade Supply & Demand zones using Heikin Ashi chart on the 4H timeframe.
🧠 I keep it mechanical and clean — no messy charts, no guessing games.
❌ No trendlines, no fixed sessions, no patterns, no indicator overload.
❌ No overanalyzing the market; use only two time frames.
❌ No scalping, and no need to be glued to the screen.
✅ I trade exclusively with limit orders, so it’s more of a set-and-forget style.
✅ This means more freedom, less screen time, and a focus on quality setups.
✅ Just a simplified, structured plan and a calm mindset.
💬 Let’s Talk:
💡Do you trade supply & demand too ?
💡What’s your go-to timeframe ?
💡Ever tried Heikin Ashi ?
📩 Got questions about my strategy or setup? Drop them below — ask me anything, I’m here to share.
Let’s grow together and keep it simple. 👊

US100 - Short Position US100 H1
We have a top forming on a previous area of supply, a higher risk trade, but with high risk comes high reward. We have a 10R measured here on this position.
Failing this, we may take a loss and trade towards 25,250 price, major resistance, from here, we will look to recoup any potential loss from this trade and then some, risk management is key as always.

Another QuickScalp on #USDJPY ? ... 📌 Market Insight: {#USDJPY }
⚠️ Risk Assessment: {High}
🚀 Approach:
Not a Quality setup but by a valid momentum structure we can take it as QuickScalp .
#Ash_TheTrader #Forex #GBPJPY #MarketAnalysis #TradingSetup #RiskManagement #GOLD #Scalper #NQ #EURUSD

#EURUSD , Risky Setup📌 Market Insight: {#EURUSD }
⚠️ Risk Assessment: {High}
🚀 Approach:
Not a Quality setup at all ... need VALID LTF entry sign first. ... shouldn't go to Edge and then back up .... QuickScalp setup
#Ash_TheTrader #Forex #GBPJPY #MarketAnalysis #TradingSetup #RiskManagement #GOLD #Scalper #NQ #EURUSD

NQ Possible Longs IncomingUsing Volume Profile from intraday volume for 12/16/2025. Price keeps reacting to the area in rectangle for some time. It tried breaking below and pushed back up into the resistance area. Looking for price to break through the resistance and turn support out of the POC.

Bearish Pendant SPX BE CAREFULNot financial advice dont hold a license you have an inverse head and shoulders on a micro time frame inside of a bearish pendant I would like to see 6750 swept before end of day dont get caught in the chop

NQ 24,958 TargetShorting NQ from the 35,317.5 or so will obviously need to adapt and adjust as time goes on reference my previous post for levels

NQ at Crossroads: AI Optimism Meets Auction Reality1. Macro Context and Narrative
The Nasdaq continues to trade at the intersection of macro-optimism and valuation sensitivity. The underlying narrative remains dominated by growth expectations, policy signaling, and the ongoing AI investment cycle. While rate volatility and geopolitical headlines continue to inject short term noise, the broader sentiment surrounding NQ remains constructive, albeit increasingly selective.
AI remains the central driver of price discovery in the index. Capital expenditure commitments tied to data centers, semiconductors, and cloud infrastructure continue to reinforce the long term growth narrative. Market participants have been willing to pay a premium for earnings visibility tied to AI monetization, particularly among mega cap constituents that dominate NQ weightings. However, as expectations rise, the market has become less forgiving. Each earnings cycle and macro headline is now filtered through a valuation lens, which has resulted in more two way trade and sharper rotations rather than one directional expansion.
This shift has created an environment where upside progress requires acceptance and follow through, while failure to hold value areas invites responsive selling. In our opinion, sentiment is no longer euphoric but remains optimistic, with positioning sensitive to both macro headlines and technical acceptance.
2. What the Market Has Done?
• The market spent August in a well defined consolidation range, building value and compressing volatility.
• In September, the market imbalanced higher out of that consolidation range and trended upward, reaching the 25400 area and printing new all time highs.
• On October 10, the market sold off sharply down to 24250, which aligned with the high of the prior consolidation range, as Trump renewed China tariff threats.
• Buyers responded at that level and the market balanced, forming bid block 1.
• The market then resumed its uptrend and made new all time highs as US China tariff tensions eased, supported by headlines around Trump and Xi meeting and confirmation of a trade deal.
• From the end of October through the rest of November, the market stalled at 26400, where sellers re entered and auctioned price lower toward 24709, which aligned with the bid block midpoint.
• Buyers attempted to reassert control and bid prices higher, but sellers stepped down offers at 25850, the level where they had previously taken control and drove prices lower through the bid block to 24000 which aligns with the top range of the consolidation range.
• Buyers responded again at 24000 and successfully auctioned price back up toward 25850.
• Over the past week, the market balanced within the December 1 weekly range and value area, but sold off on Friday and closed below the December 1 weekly low.
3. What to Expect in the Coming Week
The key level to watch remains the previous week’s settlement at 25213.50.
Bullish Scenario
• If the market is able to hold above 25213.50, I expect a move back toward the 25850 area, which aligns with composite weekly VAH and the weekly one standard deviation high.
• There is a high probability of two way repair within the prior week’s low volume area between 25213.50 and 25475, which aligns with the two week composite VAL, before continuation higher through the previous week’s value area toward 25828.50.
• If sellers fail to respond in that zone, the market could extend higher toward 26250, which aligns with the October 27 weekly VAH, and potentially toward 26444, the weekly two standard deviation high, to make new all time highs.
Bearish Scenario
• If the market is unable to hold above 25213.50, expect a move lower toward the November 24 weekly VPOC, where buyers should respond.
• Failure of buyers to hold there opens the door for continuation lower toward 24600, which aligns with the November 24 weekly low volume area and the weekly one standard deviation low.
• Further weakness could target the 24400 area, which aligns with a key daily support level.
Neutral Scenario
• If the market lacks volume, and velocity while attempting to move above 25500, which aligns with the prior week’s value area low, or below 24600, which aligns with the November 24 weekly VPOC, expect two way rotation and balance to develop.
Conclusion
In our opinion, NQ remains structurally strong, but the market is no longer forgiving. Acceptance and follow through are required for upside continuation, while failure to hold key value references continues to invite responsive selling. With AI optimism still intact but valuations elevated, the index is increasingly dependent on auction quality rather than narrative alone. As always, context, acceptance, and participant response at key levels will define the next leg.
What is your take on NQ for the upcoming week? Please drop a comment and give a boost so that more from the community can join in the conversation.
Disclaimer: This is not financial advice. Analysis is for educational purposes only; trade your own plan and manage risk.

NQ1! (Nasdaq 100) has entered the terminal phaseThe Nasdaq 100 has entered the terminal phase of its 20 day institutional dealing range and is currently executing a distribution program within the premium quartile. The failure to sustain price acceptance above the 25,700.00 Volume Imbalance suggests the algorithm is preparing for a mean reversion event to rebalance the monthly ledger.
The present price action represents a classic 'Bull Trap' at the upper boundary of the range where retail momentum is being absorbed by institutional limit sell orders ahead of a repricing to equilibrium.
Entry: 25,550.00 (Sell Limit)
Stop loss: 25,880.00 (330.00 points)
Take profit: 24,850.00 (700.00 points)
Risk to reward ratio: 2.12R
CME_MINI:NQ1! CME_MINI:MNQ1! IG:NASDAQ
The Opportunity
The 20 day IPDA lookback reveals that price is oscillating within a defined premium distribution block between 25,350.00 and 25,850.00. The market has expended significant energy to reach this valuation but has failed to close the daily candles above the key Volume Imbalance at 25,700.00.
This rejection signature implies that the 'Santa Rally' narrative has been utilized to engineer exit liquidity for smart money positions accumulated at the lows. The algorithm is an efficiency engine and it cannot justify a new macro expansion leg without first revisiting the internal range equilibrium to capitalize the move.
The Entry
Initiating a short position in the 25,550.00 to 25,600.00 zone aligns with the institutional logic of selling the upper 25% of the monthly range. This zone offers the highest statistical edge as it places the entry directly against the 'Ceiling' of the current volatility profile while targeting the 'Floor' of the recent expansion.
The Volume Imbalance acts as a natural defensive barrier for the stop loss as the algorithm will typically respect this array during a distribution phase.
The Invalidation
The bearish causal chain is ontologically corrupted if price achieves a daily close above the 25,880.00 range high. Such an event would signify a 'Blue Sky' breakout and a shift in regime from range bound to trending.
If the market accepts price above this threshold it implies that the premium valuation has become the new floor and the algorithm is targeting the 26,000.00 psychological level.
Key Trajectory Waypoints
Target 1: 25,350.00 | Type: 75% Range Quartile | Probability: 70% | ETA: 24 Hours
Target 2: 24,850.00 | Type: Range Equilibrium (50%) | Probability: 60% | ETA: 2-3 Days
Target 3: 24,400.00 | Type: NWOG / Discount Target | Probability: 40% | ETA: Next Week
The Shadow Reality
A 35% probability exists for the antithetical reality: The Range Expansion.
In this scenario the current consolidation is a 'High Tight Flag' and the algorithm ignores the equilibrium requirement to force a squeeze into the 26,000.00 level immediately.
This reality is confirmed if price holds above 25,650.00 for two consecutive 4 hour closes.
$NQ NASDAQ/US100 Bearish W Pattern Target Hit, Next Quick UpdateHi
The W pattern completed as expected and after that it fell. It reached the first bearish target. I personally am not looking for any more bearishness. I an bullish from the current levels. However I trade what I see and will plan after seeing the latest price action.
There was a big gap let. All these gaps may or may not get filled but they are important levels. So if the markets becomes bullish again, it may try to go higher from the current levels o fill that gap to the upside.
These is a previous gap level which can also provide support if the market falls from the current levels.
Trade what you see, wait for the confirmations and manage the risk as always.
Follow for more. Please support this analysis by liking, commenting, and sharing with friends, colleagues, traders, and trading communities. Thanks👍🙂

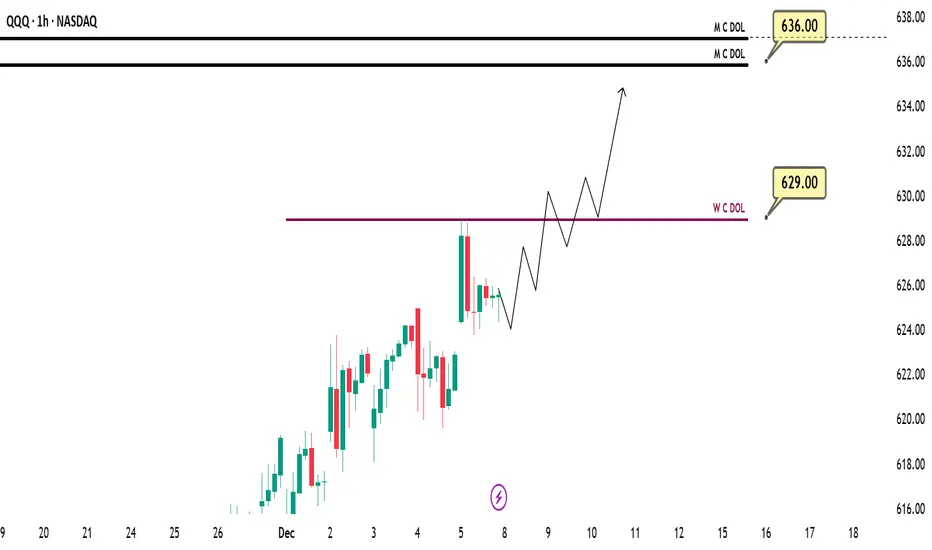
QQQ (US100 – USTECH – NQ) WEEKLY PREDICTION - (08 DEC)QQQ (US100 – USTECH – NQ) WEEKLY PREDICTION
📊 Market Sentiment
Market sentiment remains bullish, supported by expectations of a potential FED rate cut in December.
Additionally, Trump’s likely nominee for the next FED Chair Kevin Hassett, a strong advocate of aggressive rate cuts has strengthened this bullish outlook.
Markets have already begun pricing in the possibility of earlier and more aggressive cuts throughout 2026, fueling continued upside momentum.
📈 Technical Analysis
QQQ is strongly bullish at the moment.
In my opinion, as long as SPY continues pushing toward all time highs, QQQ is unlikely to experience any meaningful retracement.
📌 Game Plan – Prediction
I expect QQQ to reach 629 this week at minimum.
A strong move may occur right after the market opens however, since the FED decision will be released on Wednesday, the early part of the week may show some choppy or ranging price action.
💬 For deeper sentiment and strategy insights, subscribe to my Substack free access available.
⚠️This analysis is for educational purposes only and does not constitute financial advice. Always conduct your own research before trading or investing.
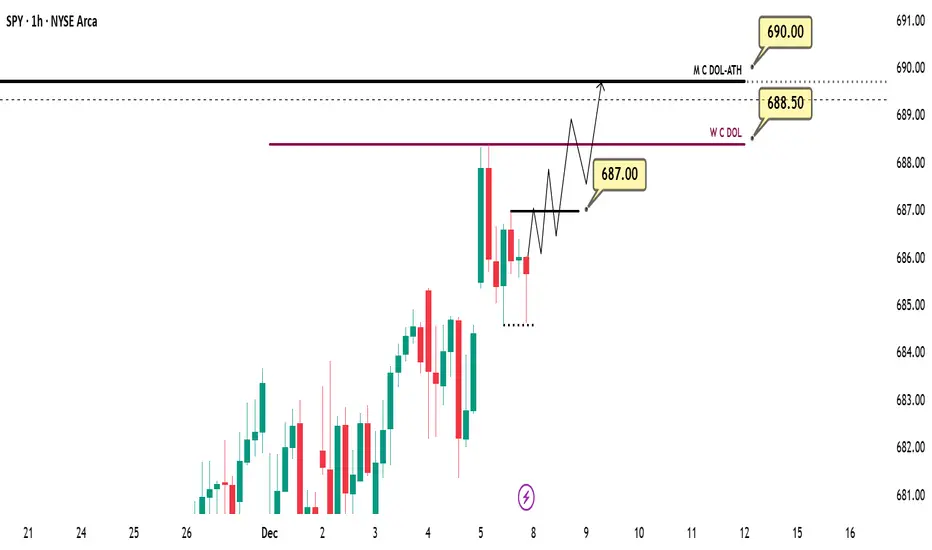
SPY (US500–SP500–SPX) WEEKLY PREDICTION (08 DEC)SPY (US500 – SP500 – SPX) WEEKLY PREDICTION
📊 Market Sentiment
Market sentiment remains bullish, supported by expectations of a potential FED rate cut in December.
Additionally, Trump’s likely nominee for the next FED Chair Kevin Hassett, a strong advocate of aggressive rate cuts has strengthened this bullish outlook.
Markets have already begun pricing in the possibility of earlier and more aggressive cuts throughout 2026, fueling upward momentum.
📈 Technical Analysis
SPY remains strongly bullish and is currently targeting new all time highs.
In my opinion, during this type of price behavior, I do not expect a deep retracement before the market attempts to run the previous highs.
📌 Game Plan – Prediction
I expect SPY to either push directly into new all time highs or consolidate until Wednesday’s FED decision.
If I see a strong daily close above 687, I plan to buy the retracement into 685, targeting:
First target: 688.5
Second target: All-time highs around 690
💬 For deeper sentiment and strategy insights, subscribe to my Substack free access available.
⚠️ This analysis is for educational purposes only and does not constitute financial advice. Always conduct your own research before trading or investing.
Short NQLaunched an anchored VWAP from the swing low (11/21/25 pre-mkt):
-Traded constructively (finding support above the +1 deviation band) for about 17 trading days
-Lost steam, started trading below +1 dev band; support became resistance (Mon 12/8 pre-mkt)
-Fell below VWAP this morning (Fri 12/12 10am-ish)
.....and until it escapes that red box, it's a short for me.
Short NQ