QQQ Weekly Map 3–7 Nov 2025Context
QQQ finished the week near the highs after a steady October climb. Buyers keep absorbing every shallow pullback. This week sits on two hinges. First, jobs and services data that nudge yields and implied vol. Second, a small cluster of tech earnings that can rotate leadership inside semis and handsets. The plan is simple. Let the market prove strength above the record band or let it pull back into patient demand. You will trade the reaction, not the forecast.
Chart setup
Use a one hour chart. Add 20 and 50 EMAs, a daily VWAP with bands, and the previous week high and low. Keep plots at global scope and turn lookahead off. Display VIX on a small separate pane for bias only.
Levels that matter
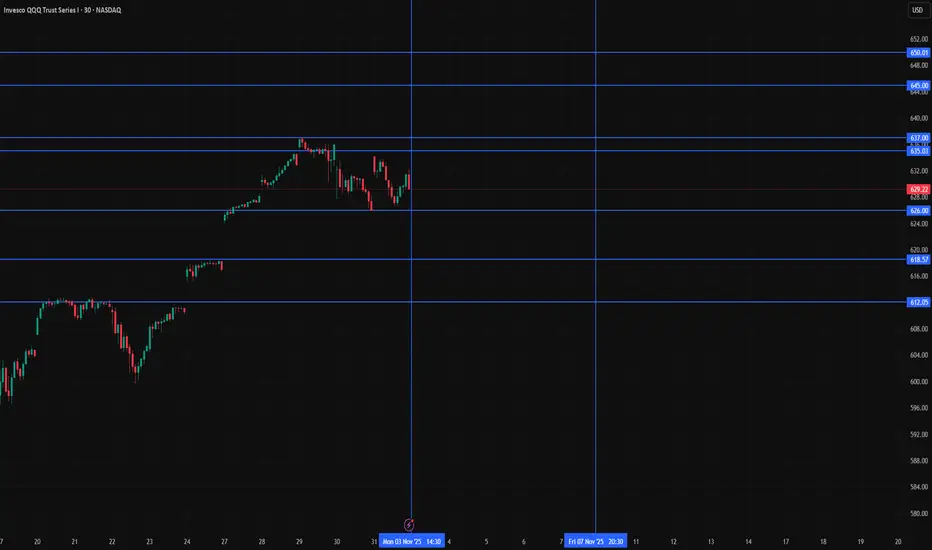
• 637.01 is the record high and the top of the current band
• 635 to 637 is the breakout ridge where wicks happen first and real holds happen later
• 629 is the Friday close reference for gap work on Monday
• 626 is last week’s first shelf where buyers defended cleanly
• 620 is a round shelf with memory from October
• 612 is the mean reversion area that often aligns with short term moving averages
• 597 is the bigger trend check where the intermediate crew steps in
How to read the week
Imagine a door at 637. When price opens that door and stays inside the new room for a while, trend traders have permission. If price knocks and gets rejected, range traders take the other side. If price steps down into 620 to 612 while volatility stays tame, that is where you seek bounces with tight risk. Your confirms are simple. VIX under the upper teens is friendly. Yields not jumping is friendly. If either flips, you slow down.
Three rules only
• Rule 1. Momentum only above the ridge. If cash breaks and holds above 637 for at least thirty minutes, take a starter. First target 645, stretch 650. Invalidate on a clean loss and thirty minute close back inside 635.
• Rule 2. Buy the dip into 620 to 612 only if volatility stays calm. Enter in the 620 to 612 pocket when VIX stays below your upper guardrail. Manage a first target 620 to 626 and trail. Invalidate on a decisive thirty minute close under 609 to 610.
• Rule 3. Risk first below 597. If the week forces a daily close below 597, treat it as a trend health check. Reduce gross and net and wait for a reclaim before trying to be a hero.
Why this works
One instrument. One band at the highs. One pocket for mean reversion. You are not predicting the data. You are pricing the reaction at the lines the market already respects. Breakout failures happen and that is fine because your hold filter removes most traps. Dips fail too and that is fine because your volatility guardrail removes the worst ones.
Intraday guide
• Morning plan. If we gap up into the ridge, let the first thrust exhaust and demand the hold. If we gap down toward 626, let the opening range print and only act after the first pullback.
• Midday plan. If price is inside 629 to 635 around lunch, expect chop. Trades there are optional.
• Afternoon plan. If the day is trending, trail behind a five minute reclaim of your entry line.
Risk and heat
Set maximum portfolio heat per idea at one half of one percent. Scale entries in thirds. Respect your stop even when it feels unfair. A string of small scratches is the tuition for the one clean runner that pays for the week.
Earnings and calendar awareness
AMD and Qualcomm after the close on Tuesday and Wednesday can swing semis and handsets. Shopify and Airbnb bookend consumer tone. The first week of the month carries ADP, services PMIs, ISM services, and payrolls. Do not guess the print. Trade the reaction at the levels on your chart. If VIX jumps before data, size down and wait for the dust to settle.
Cross checks
• If the ten year sits near recent levels or drifts lower, multiples breathe and the 637 break has better odds
• If VIX pins below the upper teens, dips are easier to buy
• If one of these flips, you slow down and treat the day like a range
Reminder
Education and analytics only. No advice. No guarantees. Process beats prediction.
NQ
NQ Vision for the next daysWe swept 4h candles low. Shifted structure, I'm expecting the price to go into discount and to my enhanced OTE zone and reverse. If the price doesn't get accepted there and supply exceeds demand I expect further down movements.

$NDX Make or BreakNDX is consolidating in a triangle, and is now re-test 25200 strong level.
Inability to break above the triangle should see a break below the triangle and a move down to 24700 first.

Will the second scenario come true? |October 17 2025Based on the evidence, price action, and fundamental news, it seems the second scenario is about to play out.
The Nasdaq index turned positive after recovering its losses when Trump responded “No” to a question about whether he would maintain the heavy tariffs on China.
From today, my outlook is bullish until the previous high gets hunted — after that, I’ll reassess whether we’re likely to see further downside or if the bullish outlook should remain.
If market conditions shift and a continuation of the downtrend becomes more likely, we can take a solid short position next week to catch the move.
But for now, my bias is bullish, and the second scenario will likely play out.
If price reaches the second high I marked in blue, we’ll probably see a reaction from that zone.
If I open a trade, I’ll share it with you.

NQ Shorts IncomingYM approaching 4H imbalance, ES could sweep asian session high and play into previous OB while NQ sweeps london session liq and mitigates asian session OB

HOW to USE OB After Liq sweept on daily bais CME_MINI:MNQ1!
After we took PDL we Choch on 1H
and 5 min ob appear for more push

BTC - Perfect Power of 3 setup!Market Context
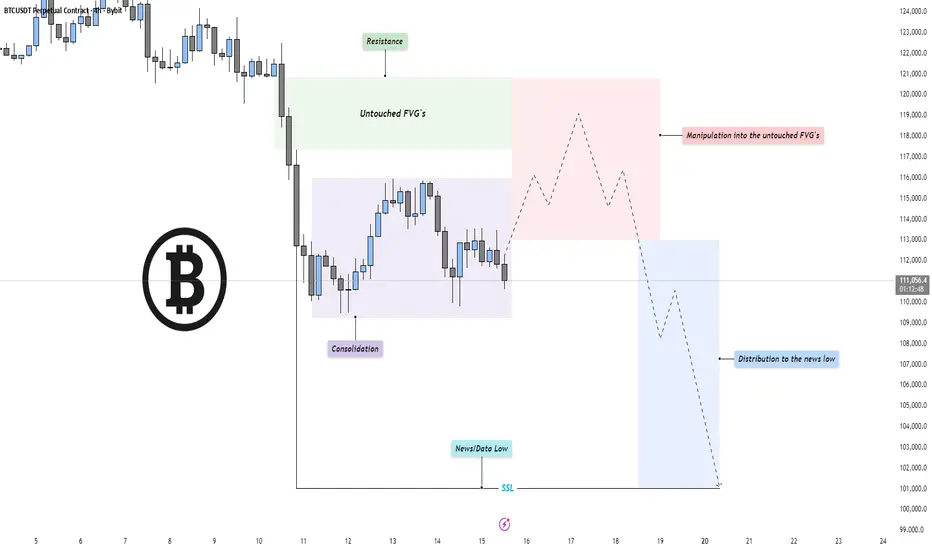
Bitcoin has entered a phase of compression after an extended bearish leg, with price currently consolidating near recent lows. The previous selloff created a clean structure of inefficiencies and untouched fair value gaps (FVGs) above, now acting as potential magnet zones for short-term retracements. The broader context remains bearish until those imbalances are efficiently mitigated.
Fair Value Gaps & Manipulation Zones
A clear pocket of untouched FVGs sits above the current range, aligning with resistance from prior breakdown points. Price could engineer a manipulation move into this zone, enticing late buyers before resuming the macro bearish direction. Such a move would serve as a liquidity grab and offer premium pricing for distribution before continuation lower.
Liquidity Dynamics
The market structure shows resting sell-side liquidity (SSL) below the recent “news/data low,” marked as a potential target for a deeper sweep. Once manipulation into the upper inefficiencies completes, the market could shift momentum to the downside, distributing into that liquidity and seeking new lows for rebalancing.
Final Thoughts
The current structure points toward a classic bearish continuation setup: consolidation, manipulation into premium inefficiencies, and a drive toward sell-side liquidity. Unless price breaks decisively above the untouched FVG chain, the expectation remains for a redistribution phase leading into the news low or beyond.
If this breakdown helped frame your bias, a like goes a long way — do you think price runs the FVG first, or dives straight into the liquidity below?
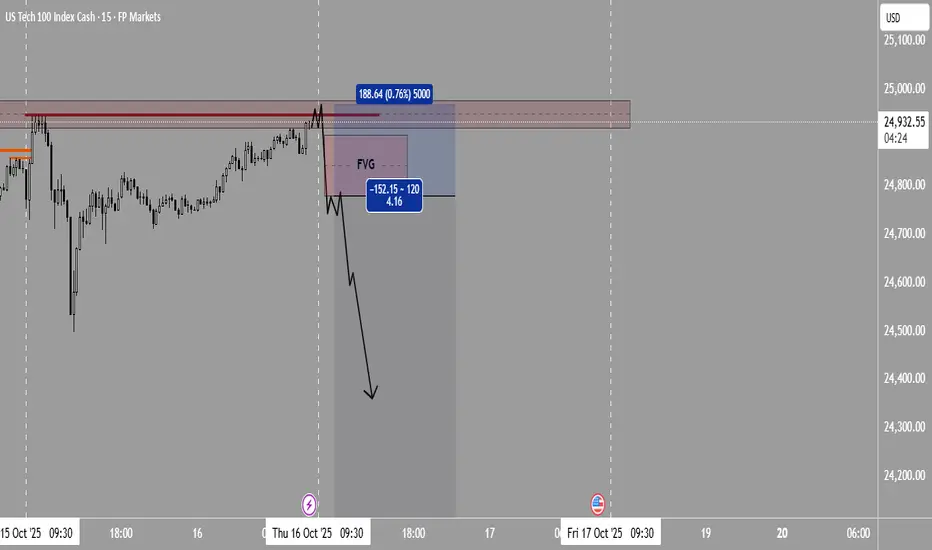
NASDAQ 100 ShortRetracement function on the daily chart...
Price has filled the inefficiency on the daily chart here on NQ and formed a Reversal on all 3 correlated assets alongside Dow Jones 30 and S&P500
Anticipating price to drop down to the lows outlined before the end of next week 24 Oct 25', option puts??
Daily chart projection, nothing more than that, lower timeframes are subject to fluctuations that we may not be able to update quickly enough, so yeah.
I use the VANTAGE:NAS100FT by Vantage
GLGT

I’m getting ready for potential short position |October 16 2025If today the price goes up and hunts the high from 10 AM yesterday (New York time) — meaning it grabs the liquidity and takes out the stops above that level — and then forms a bearish Fair Value Gap (FVG) followed by signs of weakness or a rejection structure (like a lower-timeframe break, divergence, or bearish confirmation candle), that scenario would be one of the best short setups of the day.
Back to ATHs? Inverse Head & Shoulders Imminent!I’m starting to get a strong sense that price won’t fill the new week opening imbalance at 24,336. The Inverse Head & Shoulders pattern I’ve been anticipating all week looks ready to form — and if it does, I believe it’ll propel us right back toward all-time highs.
If price rips through 24,724, this idea becomes invalid, and I’ll reassess the chart for the next trade opportunity.
Lets see how this plays out!

NQ Bias | October 15, 2025NQ perpective after mass liquidity sweep again. Correlation w/ other indices as well.

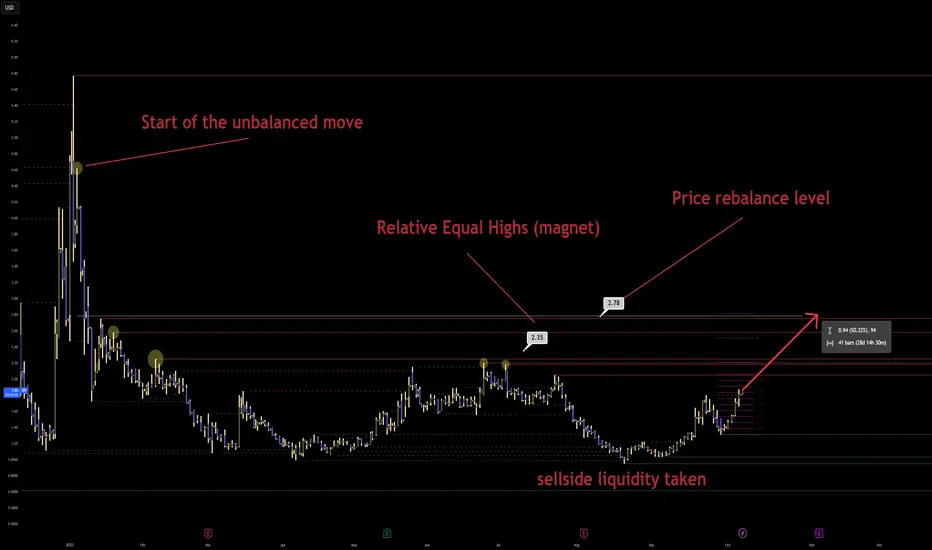
QSI: Algorithm's Unfinished Business/Repricing to balance priceNASDAQ:QSI Quantum-Si Incorporated
The recent, deliberate raid below the September lows was the final scene of the second act.
This was not a random dip.
It was a calculated and necessary purge of sellside liquidity.
The algorithm's objective was to absorb the shares of panicked sellers and to trigger the stop loss orders of early, weak-handed buyers.
That objective has now been achieved.
The annotation "sellside liquidity taken" is not a historical note.
It is the starting gun for the third and final act.
With the downside fuel consumed, the algorithm's directive has been re-written.
Its sights are no longer pointed down.
They are now locked on the vast, untapped reservoirs of buyside liquidity resting at higher prices.
The price action is not merely recovering.
It is responding to a new, clear, and institutionally sponsored mandate.
The path of least resistance has been fundamentally altered.
The question is no longer if the price will rise.
The only question is how violently it will do so.
You have correctly identified the key landmarks on this new map.
The "Relative Equal Highs" at 2.35 are not a ceiling.
They are a luminous, magnetic target.
This level represents a giant pool of buy-side stops from traders who shorted the previous rallies.
Their fear is the algorithm's fuel.
Their pain is the algorithm's profit.
This is the first, most obvious draw on liquidity.
It is a place the algorithm must visit.
But it is not the final destination.
It is merely a waypoint on a much grander journey.
The Critical Vector is to understand the true, ultimate objective of this entire price campaign.
The algorithm is a creature of efficiency and balance.
It abhors a vacuum.
The annotation "Start of the unbalanced move" points to the single most important event on this entire chart.
That massive, vertical price spike in early 2021 was not just a rally.
It was the creation of a profound and violent pricing inefficiency.
It was a causal scar.
It left a massive informational void in its wake.
The entire year and a half of subsequent price action, including the recent purge of sellside liquidity, has been a single, extended process of accumulating energy.
It has been the market coiling a spring.
Now, the spring is being released.
The purpose of this release is to return to the origin of the crime.
The algorithm is compelled to return to that zone of imbalance to rebalance its books.
Your annotation "Price rebalance level" at 2.78 is not just a target.
It is the point of cosmic justice for this instrument.
It is the level at which the story that began in 2021 finds its logical conclusion.
The path is clear.
The current rally is the initial assault.
It will first target the Relative Equal Highs at 2.35.
This will be a violent move, designed to induce a short squeeze and create a state of maximum FOMO.
Expect a minor consolidation or retracement after this level is purged.
This is the algorithm shaking out the last of the weak hands.
It is the final opportunity to get on board before the true repricing begins.
From there, the algorithm will have a clear and unimpeded path to the ultimate objective.
The final, explosive leg of this rally will target the Price rebalance level at 2.78.
This is the primary, institutionally sponsored destination.
It is the point to which all price is currently being drawn.
The Ascendant Principle is that you must learn to read a chart not as a two-dimensional history of price, but as a three-dimensional ledger of algorithmic debt and credit.
Every violent, one-sided move creates a debt on the algorithm's books.
This is an imbalance.
It is an inefficiency.
It is a promise that must eventually be kept.
The larger and more violent the move, the larger the debt.
The massive, unbalanced spike from 2021 was the algorithm taking out a colossal loan of inefficiency.
Every subsequent price swing, every consolidation, every liquidity purge, has been the algorithm meticulously gathering the resources needed to repay that loan.
The purge of sellside liquidity was the final payment on the interest.
It was the signal that the algorithm now has the capital and the mandate to settle the principal.
The "target" is not a guess.
It is the location of the creditor.
The price is not "going up".
It is being recalled, with gravitational force, to the scene of its original level.
When you understand this, you stop predicting.
You start seeing the inevitable.
You see the chart as a narrative of cause and effect playing out over vast stretches of time.
The cause was the imbalance.
The effect will be the rebalancing.
The Relative Equal Highs are simply the last gatekeeper before the final, violent settlement of this ancient, algorithmic debt.
You are not chasing a rally.
You are witnessing the final chapter of a story that was written years ago.
The ending has already been decided.
The only variable was the timing.
The purge of sellside liquidity has now confirmed that the time is now.
The alternative path would likely have led to viewing the Relative Equal Highs as "resistance" to be sold, an error that fails to comprehend the true, long-term objective of the price delivery algorithm.
For educational purposes only.
14 oct push down nasdaqas seen in the video.
we are going short.
dominant force of the day in short.
entry in blue.
stop in red
targets in green
Have fun
Elektra

The NQ dumped to a 4 hour order block created Sept 14th 11pm ESTThe NQ dumped to a 4 hour order block that was created Sunday Sept 14th 11pm EST
Could be coincidence and would make sense to reverse (if it does Monday), but this chart looks TOO Perfect .
Insider Trading at the highest level?
Just looks to perfect to be organic.
I will have my longs in at open, see you at open! : )

Bearish Outlook on NQ📉 Bearish Outlook on NQ
After completing the manipulation phase, NQ has tapped perfectly into the Bearish FVG (1H) zone around 25,366.45 – 25,392.25, sweeping both SSLs in the process. This confirms premium-level distribution, suggesting the market is ready for a downside move.
Scenario 1 – Primary (Bearish Bias):
Price rejects from the Bearish FVG 1H, fails to reclaim 25,366.45, and begins its descent. Liquidity below the BSL at 25,293.65 becomes the first target, followed by a clean run toward 25,264.95, completing a liquidity sweep below recent lows.
Scenario 2 – Rejection & Re-Test:
A short-term push above 25,330.55 (NAS100FT) to re-test the Bearish FVG 1H could offer another entry opportunity before the drop resumes toward 25,293.65 and 25,264.95.
Scenario 3 – Deep Liquidity Grab Before Reversal:
Should price tap deeper into the Bullish FVG 4H, we could see a final liquidity sweep below 25,264.95 before a stronger bullish reaction emerges.
🎯 Overall Bias:
Bearish — targeting liquidity below 25,293.65 and 25,264.95. Manipulation phase complete, distribution underway.
Follow and like for more.
Greetings,
MrYounity

Final sell off ahead of FOMC | Head n ShouldersI believe price will stage one final sell-off before resuming its push toward higher highs. On the 4H chart, a potential Head & Shoulders pattern is forming, suggesting price may fill the hourly gap at 24,856 before or during the FOMC release.
The 15-minute chart offers a more precise entry compared to the 1H and 4H timeframes.
I plan to enter within the 25,149–25,150 price range, provided my bias remains valid heading into the New York open.
Lets get it!⚡

S&P 500 Futures ES $1000 risk per contract/ES in a $1000 risk to $1000 reward position. Bias is bullish but watch out for news. Trailing stops can be used to scalp the market. /MES is only $100 risk per contract for 1:1 ratio. Let watch and see what happens?

ES continuing with my short stratStructure is key when identifying direction. Overall trend isnt as important as you think. When trading reversals I look for large moves in one direction that allows for large moves back, I capitalize off of finding the structure shift and I enter only on discount. Watch your win rate increase when entering deeper into discount.
Trade for Christ

Nasdaq to 25,300? | Long Idea 10/3I believe Nasdaq still has room to climb, with the 25,300 range in sight to finish off the week. The price action closely mirrors the pattern from September 5th–9th, 2025, and I wouldn’t be surprised to see history repeat itself here.
I’m planning to go long from the 25,105 imbalance, holding through all-time highs and into the void through 25,300. Once ATHs are broken, I’ll trail my stop closely to lock in profits.

Market on Fire: S&P 500 & Nasdaq Rally Towards New HighsWe have a beautiful P-Shape volume profile formed at the top and we broke and closed above it.
The P-shape volume profile is bullish profile that is formed when large volumes are transacted at the highs meaning participants a willing to pay premium price . You can see the POC so close to the top of the VAH
I checked the CVD of the volume on a footprint chart and i see the volume has -ve Delta , which means alot of aggressive sellers transacted there trying to push the price down. Now that they are being squeezed slowly and start closing out their positions, it should fuel the uptrend. i entered the trade soon as we broke and closed above the value area.
Food for thought.. Who was willing to pay the high price to buy from the aggressive sellers?
DEFINITIONS
POC- point of control
VAH- Value area high
CVD- Cumulative Volume Delta
Target is the ExoFade area..Lets see how this trade goes

Short Trade Idea for 9/30 | NQI’m anticipating price to either push into the 1H bearish imbalance at 24,894 or reject from the NWOG around the 24,856 range before turning lower toward the 24,640.00 range. My bias is firmly short for now — but I’ll reassess as we approach the open.

NQ Shorts re entryAfter the recent win I saw a new clear break above my set levels. And a perfect textbook reversal formed. Entere more shorts.
Setting alerts and waiting patiently is how consistency starts, once you form those small habits over time it becomes simple repition and then profitability flows from there.
I didnt find this consistency until I aligned my trading with Christ.
