NAS100 Technical Outlook | Entry & Targets | Prof.TraderTilkiHey Guys,
I’ve analyzed NAS100 on the 30-minute timeframe.
Entry Level: 25104.00
Stop Level: 25397.00
TP1: 25033.00
TP2: 24896.00
TP3: 24504.00
Risk / Reward Ratio: 2.05
This analysis is shared based on your strong interest and requests.
My only request from you is your support through likes. Your engagement is what keeps me motivated to continue sharing these analyses and supporting you.
A big thank you to everyone who consistently supports my posts.
Let’s see how this setup plays out.
Best regards.
NASDAQ 100 E-MINI FUTURES

Market cycle, Accumulation ,manipulation and distribution week.As I previously said we are going down , with this week having an accumulation phase and during the late stage of the week a mass sell off.
It stopped at 50% previous range so im almost sure tomorrow we will see asia and London going higher and NY am taking the lower side of both session ,lets see for PM but I thing a bit of a retrace will be happening this will be the closing candle of the week .

Tech stocks still correctingTech socks are still looking to finish correcting. S5INFT shows more room down to 4800 before they find support and can begin a new uptrend. This fits with the nasdaq 100 forming a sideways range that will likely break down in a correction matching S5INFT.
Good luck!

Nasdaq Short Is Playing Out - TGT 24'080First, Nasdaq has failed to make a new high.
Then price dropped, missing the red CL by just a couple of points. Is this really a miss?
Let’s play: *What if…*
The white fork measured how far price could pull back. As we Forkers know, there was about an 80% probability that price would retrace to the white Centerline - and indeed, the CL was reached.
Now it looks like price is turning on a dime.
Next target: the red Centerline around 24,080–24,000.
Here I’m sharing some deeper insights on the lower time frames:
Questions and comments are always appreciated.

NASDAQ 's long-term consolidation resembles prior peaks.Nasdaq (NDX) has been practically trading sideways since October 30 2025. This 3-month consolidation resembles Nasdaq's last aggressive correction that started in late February 2025. As you can see both have a Resistance Zone that kept the consolidation valid until a 2nd rejection that (in the 2025 case) broke below the 1D MA200 (orange trend-line) and confirmed the sharp correction.
Right now the 1D MA200 held last week but the 1D RSI printed an oversold bounce similar to that late February fractal. As a result, once the index breaks below the 1D MA200, we can technically claim that a deeper correction is confirmed. It's first Target should technically be the 1W MA100 (black trend-line) around 21800 (based on its current trajectory).
---
** Please LIKE 👍, FOLLOW ✅, SHARE 🙌 and COMMENT ✍ if you enjoy this idea! Also share your ideas and charts in the comments section below! This is best way to keep it relevant, support us, keep the content here free and allow the idea to reach as many people as possible. **
---
💸💸💸💸💸💸
👇 👇 👇 👇 👇 👇

NQ weekly walkthrough 08.02.2026, SaturdayCME_MINI:NQ1!
Covered NQ plays throughout this week. Go ahead and check it out

Nasdaq Centerline Target at 24'220NQ has host everything what is called support.
My target is the 24120 at the Cetnerline.
On a complete flush, further lower targets would be the white Centerline around 23'500.
Time until it hit's the 24220?
I have no cristal bowl. But for each day it takes, I'll move the target even lower, attached to the Centerline.
Since I play this with Options, I don't have a hard Stop/Loss, just risking what my risk-management allowes me in my account.
!! Trade small - It could snap back anytime !!
Stay save
Emilio

NAS100 Weekly Outlook: Watch This Liquidity Sweep Before SellingNAS100 🌍
The macro narrative heading into this week is dominated by a sudden reassessment of the AI investment cycle following a string of high-stakes earnings reports 🏦. While Big Tech giants like Meta and Microsoft have delivered "on-paper" beats, the underlying sentiment is shifting toward exhaustion as investors start demanding immediate monetization from massive AI capital expenditures. Interestingly, general online sentiment is showing a "buy-the-dip" mentality reaching near-extreme levels, suggesting a potential liquidity hunt before the real move lower can materialize. This retail eagerness to catch the falling knife often provides the perfect fuel for a deeper sweep of the lows 🧹.
We are seeing a Bearish Market Structure on the H4 after a significant rejection at the 26,000 psychological level 📉. While the long-term trend remains structurally bullish, the prevailing community chatter is heavily leaning toward a bounce, which tells me retail is likely positioned poorly and trapped in early long positions. The recent break of the 25,200 support zone has shifted the immediate momentum to the downside, and I am watching for the market to exploit this "crowded long" positioning before settling into a more sustainable range.
Key Zone: The confluence of the bearish Parallel Channel and the Fibonacci 50% retracement level (near 25,293) is the primary area of interest 📉.
We are currently trading just below the mid-point of the recent sell-off, and the price action is carving out a corrective flag within a descending channel. I am watching for a 'run on liquidity' to sweep the late buyers I'm seeing across various social forums who are aggressively longing this minor pullback 🧹. If we see a failure to reclaim the 50% Fibonacci level accompanied by a bearish "Break of Structure" (BoS) on the lower timeframes, it will confirm that the sellers are still firmly in control of the weekly range.

Daily Walkthrough on NQ ES and GoldCME_MINI:NQ1!
CME_MINI:ES1!
COMEX:GC1!
Daily orderflow and the thought process of today's trade. MMXM trader next day model


NASDAQ similarities with the 2022 Bear Cycle are striking.Nasdaq (NDX) almost tested last week its October 2025 High and got rejected. Unless it breaks soon, this is technically considered a Double Top. With the 1W RSI being already on a Lower Highs Bearish Divergence since July 2023, the whole pattern draws similarities to the bullish build-up that led to he 2022 Bear Cycle.
As long as the market doesn't make a new High, it is possible to that we are in a similar situation as January 2022, with the 1W RSI (ellipse) virtually identical to today's and lower than the High 3 months ago.
The 2022 Bear Cycle bottomed just after it breached below the 1W MA200 (orange trend-line). Based on the trend-lines current trajectory, this could be below 19500 by the end of 2026.
---
** Please LIKE 👍, FOLLOW ✅, SHARE 🙌 and COMMENT ✍ if you enjoy this idea! Also share your ideas and charts in the comments section below! This is best way to keep it relevant, support us, keep the content here free and allow the idea to reach as many people as possible. **
---
💸💸💸💸💸💸
👇 👇 👇 👇 👇 👇

A Nasdaq Scalp With 2 Opposing ForcesWhat I'm looking for is a simple daily Bread & Butter Trade.
My RealSwings show me the Trend. The Orange Fork is projecting it to the downside too.
Notice the touches at the orange Center-Line.
Price respects the Pitchfork.
I'm stalking a long Trend.
It's a counter Trend trade and I know that probabilities are somewhat lower than I could trade with the direction of the Trend.
Here's the 5min. where I enter the trade:
My target is the Pullback of the white Centerline, which gives me a good Risk/Reward Ratio.
Let's see if we get stopped-in to the Trade.

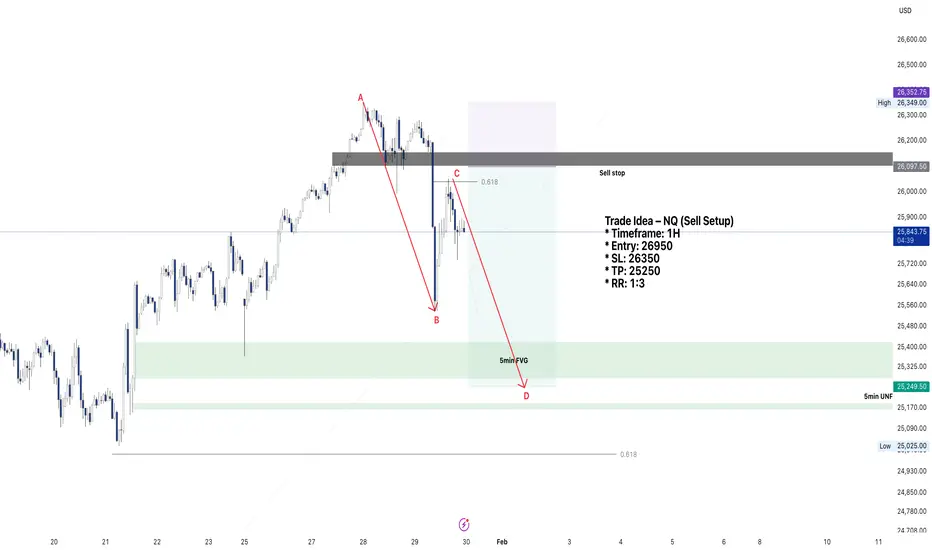
NQ Sell Setup – Dead Cat Bounce After BOS (1H, 1:3 RR)Trade Idea – NQ (Sell Setup)
* Timeframe: 1H
* Entry: 26950
* SL: 26350
* TP: 25250
* RR: 1:3
- We dropped from 26349 to 25536 after moving from the Jan2026 lows near 25000 to the Jan highs at 26349, which marked a 0.618 Fib retracement.
- From the sharp sell-off between 25536 and 26050, price has already completed another 0.618 retracement, which I consider a classic dead cat bounce.
- The break of structure (BOS) was confirmed once we closed below 26,100, so this move back to 26050 is corrective rather than impulsive.
- The decline from 26349 to 25536 formed Wave A to B. After the current 0.618 retracement up to 26050, I expect price to complete Wave C to D, targeting the 25250 area.
- The RR setup is excellent, with approximately 255 points of stop loss versus 848 points of potential profit, giving a 1:3 RR.
- There is also a strong probability of a deeper move back toward 25000, which aligns with the 0.618 Fib retracement from the Nov 2025 lows to the Jan 2026 highs.
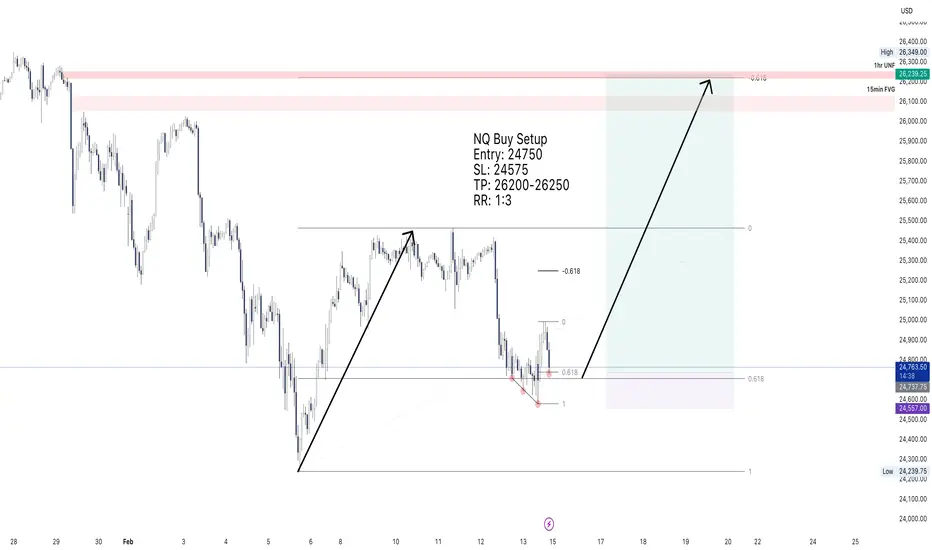
Short setup on NQI see a beautiful and most probable short setup on NQ in 4HR TF.
Entry: 25800-25700
SL: 26050
TP: 24750
RR: 1:3RR

NASDAQ (NAS100) – Key Liquidity Levels Amid Market UncertaintyHi Traders!
The Nasdaq continues to exhibit a strong bullish bias, maintaining its position above major moving averages. Following the recent price action, we are seeing a healthy consolidation phase near the all-time highs, suggesting that institutional participants continue to defend pullbacks within the prevailing bullish structure.
Technical Observations
Support/Resistance: The price is currently testing a crucial Supply-to-Demand flip zone around the 25.434 level.
Indicators: The RSI is currently hovering in the neutral-to-overbought territory, indicating that while the trend is strong, a minor pullback or "cooling off" period wouldn't be surprising before the next breakout.
Trade Idea / Execution
Bullish Scenario: The sweep of the 25,281 liquidity level followed by a strong impulsive hourly close to the upside confirms a renewed continuation toward all-time highs (ATH). As long as price holds above the reclaimed 25,281 level, the path toward all-time highs (ATH) remains intact.
Bearish Scenario: A sustained move below 25,281 could open the door for a deeper pullback toward the 100-day EMA area (24,987) to re-collect liquidity.
Analyst’s Note: Keep a close eye on the upcoming Macro data (CPI/FOMC) as it will likely act as the primary catalyst for the next directional move. High volatility is expected.

NQ: Stalking the 4H SupplyThe Macro Context
We are currently pushing into a significant 4-hour Supply Block. After the recent impulsive moves, the market is approaching a zone where institutional sell orders have historically lived. As a "sponge" to these lessons, I’m not interested in guessing the top—I’m waiting for the market to reveal its hand.
The Execution Plan
I am stalking a short entry with two specific "Hermit" requirements:
The Liquidity Hunt: Ideally, I want to see a wick above the high of this 4H supply zone to sweep out the early shorts.
Price Acceptance: I need to see a 4-hour candle close firmly inside or below the box after that wick. If we get a full candle close above this zone, the trade idea is invalidated and the "Macro Roadmap" gets a rewrite.
The Trigger
Once the 4H rejection is confirmed, I’m dropping down to the 15-minute timeframe to look for a Market Structure Shift to the downside.
No Shift = No Trade. * Patience is a position. We wait for the "handoff" from buyers to sellers to be documented on the tape.

S&P500 & NASDAQ: Trading Above The +FVG! Look For Longs!Welcome back to the Weekly Forex Forecast for the week of Jan. 27-30th.
In this video, we will analyze the following FX market: S&P500 and NASDAQ
Both indices have been trading sideways. Both made an inefficient bearish move last week that
took a week to recover from. Both have been struggling to get move higher through a bearish FVG.
That changed Monday. The Monday candle closed above the -FVG, indicating bullish order flow.
Look to take advantage tomorrow! Price is heading towards buy side liquidity, and there will be opportunities to take valid long setups over the next 24 hrs.
Enjoy!
May profits be upon you.
Leave any questions or comments in the comment section.
I appreciate any feedback from my viewers!
Like and/or subscribe if you want more accurate analysis.
Thank you so much!
Disclaimer:
I do not provide personal investment advice and I am not a qualified licensed investment advisor.
All information found here, including any ideas, opinions, views, predictions, forecasts, commentaries, suggestions, expressed or implied herein, are for informational, entertainment or educational purposes only and should not be construed as personal investment advice. While the information provided is believed to be accurate, it may include errors or inaccuracies.
I will not and cannot be held liable for any actions you take as a result of anything you read here.
Conduct your own due diligence, or consult a licensed financial advisor or broker before making any and all investment decisions. Any investments, trades, speculations, or decisions made on the basis of any information found on this channel, expressed or implied herein, are committed at your own risk, financial or otherwise.

NAS100: The Fed Trap is Set! Don't Buy Yet NASDAQNAS100 🌍 The US100 macro narrative heading into this week is dominated by the Federal Reserve Interest Rate Decision scheduled for today, January 28, 2026 🏦. Markets are pricing in a likely "Pause," but with political pressure mounting and Tech Earnings season in full swing, volatility is guaranteed. The "Driver of the Week" is the interplay between this Fed policy update and Big Tech guidance—essentially, we are waiting to see if the central bank validates the recent rally or triggers a "sell the news" event. Sentiment remains cautiously Risk-On, but traders are lightening exposure ahead of the FOMC press conference 🎤.
We are seeing a Bullish Market Structure on the H4 📈, printing clear higher highs and higher lows, with the recent impulse leg shattering resistance at 26,000. However, the current candles are showing rejection wicks at the top, suggesting the market is overextended and craving a healthy correction before the next leg up. This pullback is necessary to reset the RSI and gather fresh liquidity for a push toward new highs.
Key Zone: The chart highlights a pristine confluence area where the Ascending Parallel Channel support intersects perfectly with the 50% (25,753.3) and 61.8% (25,641.8) Fibonacci Retracement levels 📉. This "Golden Pocket" is the exact area where institutional algorithms often rest buying orders during a trend continuation.
We are currently trading at the top of the range, and chasing price here is risky. I am watching for a classic "Judas Swing" or stop-hunt lower to sweep early buyers before the real move begins 🧹. The ideal scenario is a sharp dip into our Buy Zone post-FOMC, trapping bears who think the trend has reversed, only to see price reclaim the channel and surge.

NQ Trading Inside Pivot Zone — Expansion Incoming 1/27/26📊 NQ (Nasdaq 100 Futures) — Premarket Trading Plan
Timeframe: 30-min
Session Theme: Balance → Expansion from Pivot
🟡 Primary Pivot Zone (Decision Area)
25,984 – 25,960
This zone defines control for the session.
Above pivot → bullish continuation bias
Below pivot → rotational / risk-off behavior
No bias without acceptance.
🔴 Upside Levels (If Pivot Holds)
26,007 – 26,043 → First resistance / acceptance test
26,085 – 26,130 → Major supply / upside extension zone
Failure here likely rotates price back toward the pivot.
🟢 Downside Levels (If Pivot Fails)
25,912 – 25,880 → First support / responsive bids
25,845 (Prior Week High) → Structural bull line
25,738 (Prior Week Close) → Breakdown confirmation
25,680 – 25,630 → Major demand / liquidation pocket
Acceptance below 25,845 signals real momentum shift.
🧠 Market Structure Read
Higher-timeframe trend remains bullish
Price is compressing above weekly structure
Current action = balance, not rejection
Expect range expansion once pivot resolves
This is a decision day, not a chase environment.
🧭 Trade Thesis
🟢 Bull Case
Hold 25,984–25,960
Buyers defend pullbacks into the pivot
Acceptance above 26,007 opens: 26,043
26,085 → 26,130
Best longs = pivot holds + higher low + volume confirmation
🔴 Bear Case
Acceptance below 25,960
Rotation toward 25,912 → 25,880
Loss of 25,845 opens: 25,738
25,680 – 25,630 if momentum accelerates
Shorts only make sense after pivot failure, not inside it.
📌 BOTTOM LINE — REAL IMPACT FACTORS FOR NQ TODAY
🟢 Bullish / Supportive
✅ Positive premarket futures bias
✅ Strong tech earnings anticipation
✅ Softer USD supporting risk assets
✅ Global equities resilient despite tariff rhetoric
🔴 Bearish / Risk Factors
⚠ Fed policy caution — no aggressive easing signal
⚠ Tariff headlines & geopolitical risk remain overhangs
⚠ Sector divergence (weak insurers) could spill into sentiment
📊 Quantum Regime Snapshot (QRS)
🟡 Neutral → Conditional Risk-On
Risk appetite remains constructive above the pivot, but this is not full risk-on. Structure confirmation required before pressing size.
⚡ Volatility Expectation
Moderate → Elevated
Compression near pivot = expansion potential
Earnings + macro uncertainty = fast rotations
Expect two-way trade, not a straight trend day
🎯 Execution Rules
Trade reactions, not predictions
Above pivot → lean long, buy pullbacks
Below pivot → fade strength, expect rotation
No acceptance = patience

1/26/26 NQ Premarket Playbook — Levels First, Noise LastNQ 📊 | Premarket Trading Plan (30-Min)
🧲 Premarket Pivot: 25,710
→ Line in the sand for today’s bias
🔴 Resistance / Supply
25,738 – 25,845 → prior rejection / supply shelf
25,880 – 25,912 → upper resistance band
25,960 → stretch target if risk fully flips on
🟢 Support / Demand
25,630 – 25,600 → first demand / pullback support
25,555 → key structural level
25,380 – 25,365 → major demand zone
25,127 → last support before range damage
🧭 TRADE THESIS
🟢 Bull Case
Acceptance above 25,710 keeps upside pressur
Holding 25,630–25,600 on pullbacks = buy structure
Sustained trade above 25,738 opens rotation toward
25,845 → 25,880+
➡️ Buyers must defend dips, not allow value to slip back below pivot
🔴 Bear Case
Failure to hold 25,710 = rejection at value high
Acceptance back below 25,630 opens 25,555
Loss of 25,555 exposes 25,380 demand
➡️ Shorts favored on failed reclaims into resistance

NASDAQ Will the 2-month Resistance hold and cause a correction?Nasdaq (NDX) opened lower today but quickly recovered as it hit its 1D MA50 (blue trend-line). With last week's Low being on the 1D MA100 (green trend-line), the level that has caused the last two major rebounds since November 21 2025, the market focus shifts again on Resistance 1 (almost 2 months intact), which has caused the last 4 top rejections.
With the Lower Highs trend-line also since its All Time High holding and a huge 1D RSI Lower Highs Bearish Divergence since September 22 2025, as long as the market doesn't close a 1D candle above Resistance 1, we expect a bearish reversal first to 24900 (just above Support 1) and if Support 2 breaks, bearish extension targeting the 1D MA200 (orange trend-line) around 24200.
---
** Please LIKE 👍, FOLLOW ✅, SHARE 🙌 and COMMENT ✍ if you enjoy this idea! Also share your ideas and charts in the comments section below! This is best way to keep it relevant, support us, keep the content here free and allow the idea to reach as many people as possible. **
---
💸💸💸💸💸💸
👇 👇 👇 👇 👇 👇

Trade outlook on Gold, Silver, Crude, NQ, ES, BTCCovered my 5 instruments. What was the narrative for the day and how I framed my trades on Gold and NQ and what were the key areas that you need to look for.
