Nasdaq Retests January Highs + BSL – Rejection Here?Hello Fellow Traders,
We're looking at the Nasdaq (NQ or NDX) today.
The index has retested and taken out the January highs again — hitting major buy-side liquidity from earlier in the month.
Right now, the market is in a major consolidation phase and could stay range-bound through much of Q1. We're trading in premium territory relative to the broader dealing range — so a correction down to the discount area (below equilibrium) feels likely and healthy in this environment.
If we see clear rejection signs from the current area (e.g., strong wicks, failure to hold highs, or displacement lower), expect a potential waterfall move down to the highlighted discount PD Arrays.
Focus on reactions at those PD Arrays (like FVGs, NDOG/NWOG, Order Blocks, etc.) — not just price.
Example: If the top highlighted FVG breaks with displacement (strong move through it), it flips to an iFVG (inverted FVG). Any retracement back into that iFVG becomes a solid short signal.
Vice versa for lower arrays — bullish reactions there could confirm continuation or reversal.
Bias: Still overall bullish macro, but short-term correction to discount zones is expected to reload buyers. Watch for confirmation at those PD Arrays before acting — patience pays!
Keep risk tight, especially in choppy consolidation. What's your view on Nasdaq? Expecting rejection and drop, or breakout higher first? Drop your thoughts below!
#Nasdaq #NQ #NDX #TechnicalAnalysis #SMC #ICT #PDArrays #FVG #Forex #Indices
Nq100

Short setup on NQI see a beautiful and most probable short setup on NQ in 4HR TF.
Entry: 25800-25700
SL: 26050
TP: 24750
RR: 1:3RR

Us100 (Nas100) POTENTIAL SELL SETUP
Previous Daily High has been taken
Strong Correlation with Us500
Now waiting for confirmation inside the 1H FVG for potential sell opportunity.
No confirmation = No Trade
Let Price come to me

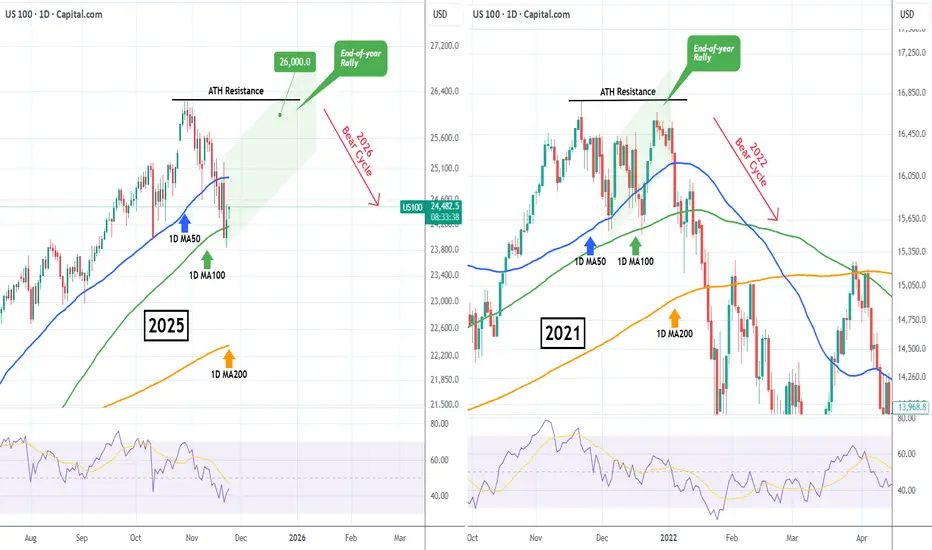
NASDAQ is on the verge of collapse.Nasdaq (NDX) completed its 'Santa rally' on December 26 and since then it's been pulling back, breaking below the 1D MA50 (blue trend-line), despite today's early rise in the aftermath of Maduro's capture over the weekend.
Technically, it is repeating the Cycle Top formation of 2021. That was achieved under a Lower Highs trend-line, which as soon as the very first week of 2022, started a violent correction that extended well beyond the 1D MA200 (orange trend-line), making a first stop on the 2.618 Fibonacci extension, before a dead-cat-bounce kicked in.
Right now, the latest Lower High was that 'Santa rally' and since we've just started the first week of 2026, there are high probabilities that a new collapse will begin. Even the 1D RSI comes to confirm this, being very similar to that of late 2021.
If the market repeats the 2022 Bear Cycle, then we are looking at a first Low at 21000 (Fib 2.618) by March.
---
** Please LIKE 👍, FOLLOW ✅, SHARE 🙌 and COMMENT ✍ if you enjoy this idea! Also share your ideas and charts in the comments section below! This is best way to keep it relevant, support us, keep the content here free and allow the idea to reach as many people as possible. **
---
💸💸💸💸💸💸
👇 👇 👇 👇 👇 👇

NASDAQ One final Santa push??Nasdaq (NDX) is rebounding today on its 1H MA50 (blue trend-line), capitalizing on the short 6-day Channel Up that it's been trading in.
With a 1H MACD Bullish Cross confirming the start of the new Bullish Leg, we can expect at least a +2.11% rise (similar to the 1st Bullish Leg) on this one, targeting 25900, as part of the final 'Santa rally' push.
---
** Please LIKE 👍, FOLLOW ✅, SHARE 🙌 and COMMENT ✍ if you enjoy this idea! Also share your ideas and charts in the comments section below! This is best way to keep it relevant, support us, keep the content here free and allow the idea to reach as many people as possible. **
---
💸💸💸💸💸💸
👇 👇 👇 👇 👇 👇

NQ Trade idea Christmas week (12/22-12/26)Basically using fib .618-.79 level.
1.wait for it to be tapped
2.confirmaton for entry fvg, ifvg, 20 ema crossed
3.stop loss
a). Tight- top of fvg formed
b). Moderate- top of structure
c). Bigger - Top of entry zone

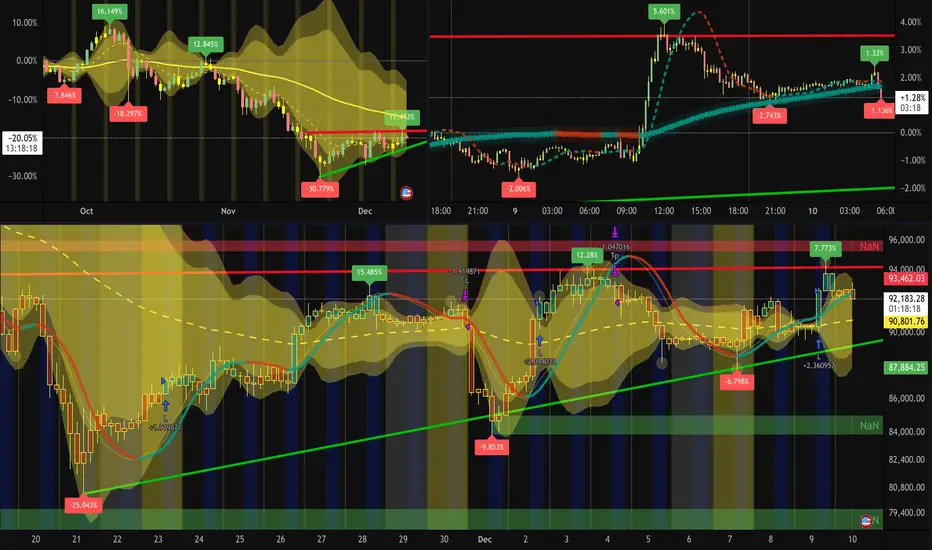
December 10th, Pre-FOMC Macro-Assets Analysis and ProjectionsToday (December 10th, 2025), US federal reserve chair - Jerome Powell will speak at the FOMC Press Conference at 2 pm (NY timezone)
He will announce committee's decision to change the interest rate. Rather than speculating what he may say, lets look at a few basic economic principles in order to understand how it may impact the markets.
FUNDAMENTAL
Case A : They decide to cut the interest rate.
1. Interest rate goes down → Borrowing feels cheaper
2. Borrowing feels cheaper → Demand for money (here, USD) rises
3. Demand for money rises → Money printing (supply) increase
4. Money supply increase → Price of everything increases (over time) (rising inflation)
5. Rising inflation → USD weakens
6. USD weakens → Gold / Crypto strenthens
Case B : They decide to hike the interest rate.
1. Interest rate goes up → Less / No money printing
2. Less / No money printing → Limited money supply → Virtual scarcity
3. Virtual scarcity of money→Value of money (here, USD) strengthens
4. USD strengthens → Gold / Crypto weakens
Case C : They decide to keep the interest rate same.
Interest rate stays same → Continued Market Momentum
TECHNICAL
( All charts displayed as of 12/10/2025 4:00 (UTC-5) )
1. DOLLAR ( TVC:DXY )
# 1-Day Long term bias : Bearish
# 1-Day Current phase : At POI in bearish consolidation with a possible double top
# 4-Hours' Trend : In a downtrend from its second top (from 1D timeframe)
# 4-Hours' Likely Liquidity Zone ; Sell-side sweep between 99.450-99.550
# 4-Hours' Projection : DXY likely to expand its current downtrend and fall further down atleast 98.650
2. GOLD ( OANDA:XAUUSD )
# 1-Day Long term bias : Bullish
# 1-Day Current phase : At Possible High forming bullish continuation pattern
# 4-Hours' Trend : Sideways, forming a falling wedge pattern
# 4-Hours' Likely Liquidity Zone ; Buy-side sweep between 4150-4175
# 4-Hours' Projection : Gold likely to test / sweep support before expanding upside to atleast 4265
3. BITCOIN ( CRYPTO:BTCUSD )
# 1-Day Long term bias : Bearish
# 1-Day Current phase : At Possible Low retracing back to its equilibrium (solid yellow line)
# 4-Hours' Trend : Sideways, forming a ABCDE Horizontal Triangle (as per Elliot Wave theory)
# 4-Hours' Likely Liquidity Zone ; Buy-side sweep at 88k / 83k | Sell-side sweep at 96k
# 4-Hours' Projection : Heavily likely to sweep both side during FOMC and start expanding upside to atleast 108k
4. SP500 / NASDAQ / DOW-JONES ( TVC:SPX )
# 1-Day Long term bias : Bullish
# 1-Day Current phase : At Possible High retracing back to its equilibrium (dashed yellow line)
# 4-Hours' Trend : Uptrend, in disequilibrium with downside momentum
# 4-Hours' Likely Liquidity Zone ; Sell-side swept above 6870 | Buy-side liquidity at 6530
# 4-Hours' Projection : Likely to pullback to its equilibrium or stay stagnant before continuing its upside expansion to atleast 6950
Overall,
if the Fed decides to cut rate by 0.25%, market may show strong volatility
if the Fed decides to cut rate by 0.50%, market may show extreme volatility
if the Fed decided anything else, market stays stagnant with one-time hype volatility move
DXY likely to expand its current downtrend and fall further down atleast 98.650
Gold likely to test / sweep support before expanding upside to atleast 4265
Bitcoin likely to sweep both side during FOMC and start expanding upside to atleast 108k
SP500 likely to pullback to its POI or stay stagnant before its upside expansion to atleast 6950
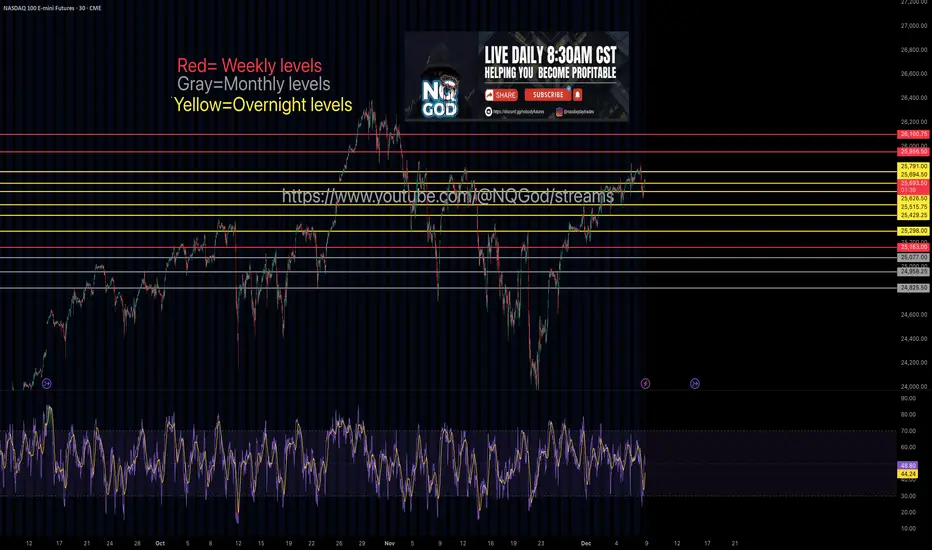
NQ Weekly, monthyl, Overnight levels from a Funded traderPing me with any quetions pretty straight forward levels here
NASDAQ formed its 1st 4H Golden Cross in 7 months!Nasdaq (NDX) completed last Friday its first 4H Golden Cross formation in more than 7 months (since May 01). This is taking place while the index is inside a Channel Up, making a V-shaped recovery from the November 21 Low.
The last time all the above conditions were fulfilled was exactly during the May Golden Cross. With the 4H MA200 (orange trend-line) as its Support, the index eventually hit its previous All Time High (ATH).
As we've entered the Fed week, we can finally see this move to the ATH Resistance, so our short-term Target on Nasdaq remains 26200.
---
** Please LIKE 👍, FOLLOW ✅, SHARE 🙌 and COMMENT ✍ if you enjoy this idea! Also share your ideas and charts in the comments section below! This is best way to keep it relevant, support us, keep the content here free and allow the idea to reach as many people as possible. **
---
💸💸💸💸💸💸
👇 👇 👇 👇 👇 👇

NASDAQ Santa Rally back to 26000 started?Nasdaq (NDX) rebounded on Friday after marginally breaching below its 1D MA100 (green trend-line) for the first time since May 09! The continuation today is a sign of a potentially strong rebound, the traditional end-of-year rally that is know as 'Santa's rally'.
Based on the 2021 Bull Cycle, which after touching its own 1D MA100 it started a final rally that almost tested its ATH Resistance, we can expect Nasdaq to now rise towards the end of the year to potentially 26000.
Could this be the last rally before a new Bear Cycle in 2026?
---
** Please LIKE 👍, FOLLOW ✅, SHARE 🙌 and COMMENT ✍ if you enjoy this idea! Also share your ideas and charts in the comments section below! This is best way to keep it relevant, support us, keep the content here free and allow the idea to reach as many people as possible. **
---
💸💸💸💸💸💸
👇 👇 👇 👇 👇 👇
Nasdaq reversa 6-11-25Sellers were absorbed in that area, and the Nasdaq will likely reverse from this point in the coming days.
If it breaks through the supply zone, the trend could turn bullish in the next few days.

Maximum profit: Top 5 indices of OctoberIn October, client activity peaked around #SP500, #NQ100, #DAX30, #FTSE100, and #NIKKEI . These five indices not only showed the highest share of profitable trades but also delivered the best returns across all index instruments. Strong corporate earnings, steady demand, and a positive news backdrop continue to support their growth potential.
Growth outlook for key indices through the end of 2025:
• #SP500: New record highs, solid earnings from major players, and expectations of a Fed rate cut support buying the dip with moderate risk.
• #NQ100: Tech demand remains strong as firms invest in data centers and AI infrastructure. If earnings stay on track, there’s still room to grow.
• #DAX30: After hitting new all-time highs in 2025, the German index benefits from improved global trade sentiment and stable EU data. Exporters thrive on robust external demand.
• #FTSE100: The UK market remains near its highs, supported by strong performance in key sectors and commodities. Year-end liquidity may further reinforce the uptrend.
• #NIKKEI: Japan’s index keeps climbing, helped by a weak yen boosting exports and a predictable monetary environment. Further gains are possible if global conditions remain calm.
FreshForex analysts believe short-term index performance hinges on three main factors: current earnings season results, inflation trends, and central bank decisions. Risk management and awareness of the macro calendar remain essential.

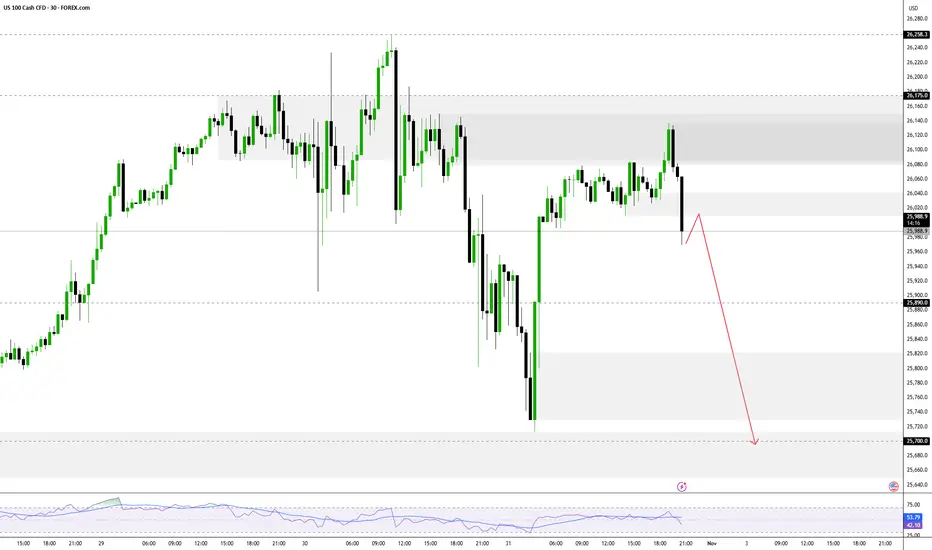
NAS100 | Bearish Momentum Extends The Nasdaq 100 fell about 2.1% (~500 points) as projected, maintaining a bearish outlook while technology stocks continued to weigh on market sentiment.
Below 25,700: Bearish continuation towards 25,340 → 25,230 → 25,000.
Above 25,700: Short-term recovery towards 25,820 → 26,170.

Reversal From ATH, Momentum Turns Cautious Reversal From ATH, Momentum Turns Cautious
The NASDAQ reversed from its all-time high and remains below 26,175, signaling short-term bearish momentum.
➡️ Below 26,175: Bearish bias toward 25,890 → 25,700 → 25,340.
➡️ Above 26,245: Bullish continuation toward 26,500 → 26,850.
Pivot POINT: 26,175
Support: 25,890 · 25,700 · 25,340
Resistance: 26,500 · 26,850 · 27,000
USNAS100 remains bearish while below 26,175, but a 1H close above 26,245 would confirm a bullish breakout toward higher targets.
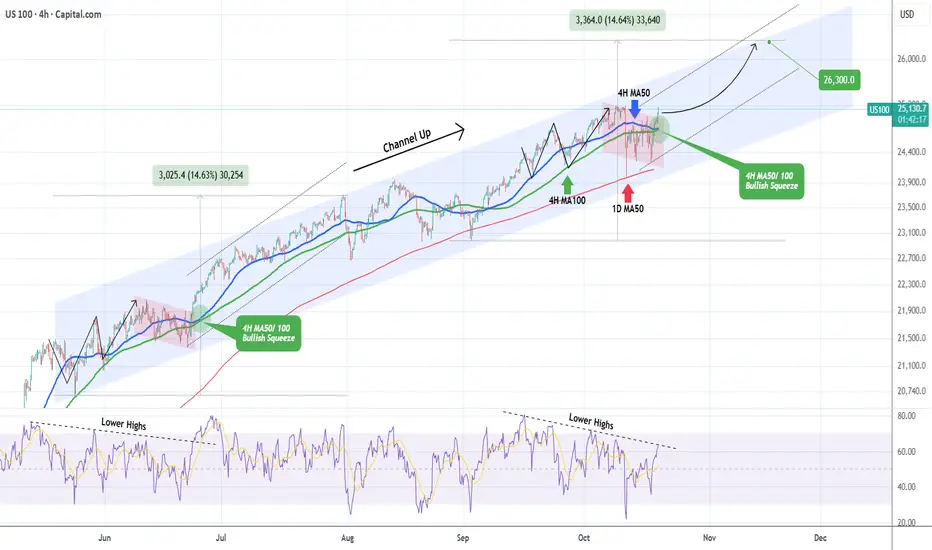
NASDAQ This bullish squeeze can push it to 26300.Nasdaq (NDX) has been trading within a Channel Up since the May 23 Low on its 4H MA100 (green trend-line). It appears that the index is getting out of the red Bearish Leg, which on the whole pattern serves as a Bull Flag for the next rally (Bullish Leg). Once the 4H RSI breaks above its Lower Highs trend-line, it will confirm the new Bullish Leg.
The last such RSI Lower Highs break-out was on June 23 when a similar 4H MA50/ 100 Bullish Squeeze took place. That was almost in the middle of a +14.63% rally in total before the index pulled back to its 1D MA50 (red trend-line).
As a result, once the 4H RSI break-out is finalized, we expect this run to reach at least 26300 (+14.63%).
-------------------------------------------------------------------------------
** Please LIKE 👍, FOLLOW ✅, SHARE 🙌 and COMMENT ✍ if you enjoy this idea! Also share your ideas and charts in the comments section below! This is best way to keep it relevant, support us, keep the content here free and allow the idea to reach as many people as possible. **
-------------------------------------------------------------------------------
💸💸💸💸💸💸
👇 👇 👇 👇 👇 👇
NASDAQ Did the 1D MA50 just save the day??Nasdaq (NDX) suffered a historically strong daily sell-off on Friday following President Trump's tariff threats and touched (and closed on) its 1D MA50 (blue trend-line).
Last time it hit that trend-line was on September 02 and that was a technical Higher Low on the 5-month Channel Up. Friday's Low was also very close to the bottom of this pattern. At the same time the 1D RSI hit and rebounded on its Lower Lows Support trend-line.
With the market rebounding and opening considerably higher today, it is more likely technically that we have started the pattern's new Bullish Leg. With the last two such sequences rising by at least +11.00%, we expect a new similar uptrend, which as long as the 1D MA50 holds, could hit at least 26000 within a 40 day horizon.
-------------------------------------------------------------------------------
** Please LIKE 👍, FOLLOW ✅, SHARE 🙌 and COMMENT ✍ if you enjoy this idea! Also share your ideas and charts in the comments section below! This is best way to keep it relevant, support us, keep the content here free and allow the idea to reach as many people as possible. **
-------------------------------------------------------------------------------
💸💸💸💸💸💸
👇 👇 👇 👇 👇 👇

NASDAQ Channel Up found support and aims for 25600.Nasdaq (NDX) has been trading within a Channel Up since the August 28 High and on Friday it tested its 1H MA100 (green trend-line) again and rebounded. That has been a bullish continuation signal within this pattern every time a 1H MA50/ 100 takes place.
On the previous Bullish Leg that confirmed the upside continuation all the way to the 2.382 Fibonacci extension before a 1H MA50/ 100 Bearish Cross and new Low.
As a result, the current short-term Target on Nasdaq is 25600.
-------------------------------------------------------------------------------
** Please LIKE 👍, FOLLOW ✅, SHARE 🙌 and COMMENT ✍ if you enjoy this idea! Also share your ideas and charts in the comments section below! This is best way to keep it relevant, support us, keep the content here free and allow the idea to reach as many people as possible. **
-------------------------------------------------------------------------------
💸💸💸💸💸💸
👇 👇 👇 👇 👇 👇

Futu Holdings a New ath or time for a correctionIn this video I go over the previous price action and develop a plan of where to look for a future entry if you are accumulating Futu .
I demonstrate using a standard fib pull how price may gravitate back to .786/.886 fib levels over time as well as what to look for in the event we push up for a new Ath .
20 Nov we have earnings and despite the past track record of earnings have surprised the market with positive results I question if the upcoming does the same or will it be the catalyst for the correction .

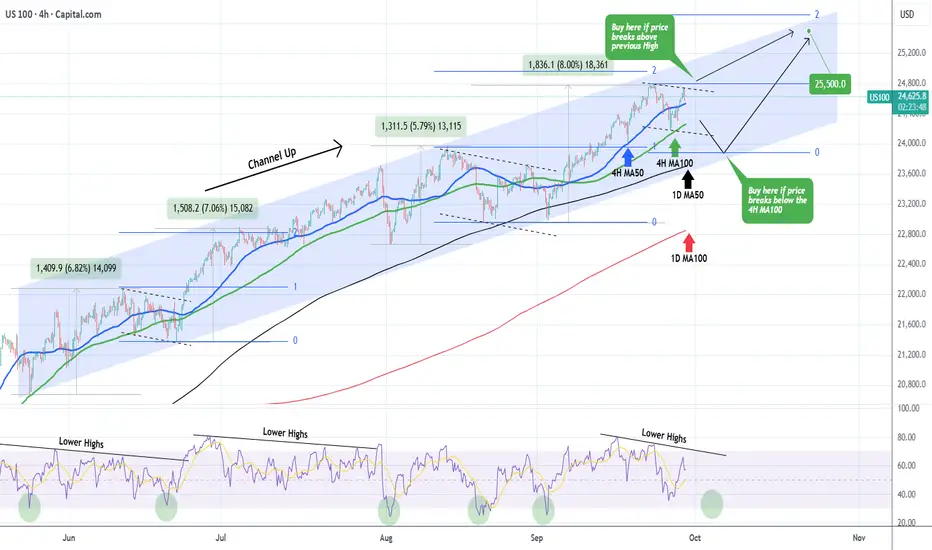
NASDAQ in no action zone. Buy break-out or pull-back.Nasdaq (NDX) has been trading within a 4-month Channel Up and its most recent low has been on its 4H MA100 (green trend-line) 2 days ago.
As long as it holds, it maintains the short-term bullish trend but a confirmed buy signal would be after the price breaks above its previous 24800 High.
Until it does, it might be within a technical Bearish Leg similar to late August's and mid June's that both broke below the 4H MA100 before bottoming on the Higher Lows trend-line of the Channel Up and rebounded. The 4H RSI Lower Highs structure shows that we might be on such a pull-back sequence, which turns into a buy below 33.00 (RSI).
As a result, we will either wait for a 24800 break-out or a 1D MA50 (black trend-line) pull-back before initiating a buy again. In both cases, our Target is 25500 (just below the 2.0 Fibonacci extension).
-------------------------------------------------------------------------------
** Please LIKE 👍, FOLLOW ✅, SHARE 🙌 and COMMENT ✍ if you enjoy this idea! Also share your ideas and charts in the comments section below! This is best way to keep it relevant, support us, keep the content here free and allow the idea to reach as many people as possible. **
-------------------------------------------------------------------------------
💸💸💸💸💸💸
👇 👇 👇 👇 👇 👇
NQ - Sub Dividing Elliott Wave CountIs this possible? Multiple 1st and 2nd wave sub divisions, a small 3rd wave, and then again multiple 4th and 5th wave sub divisions.

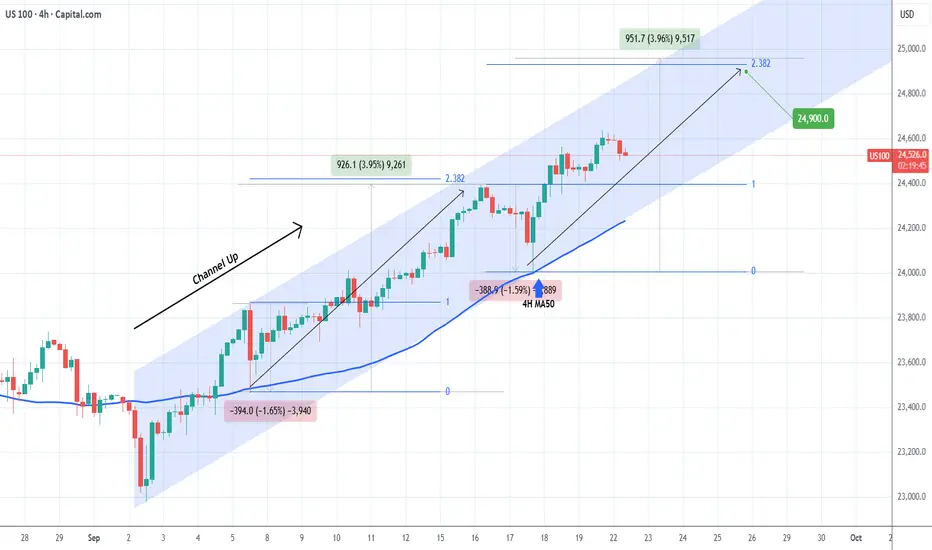
NASDAQ September's Channel Up targets 24900.Nasdaq (NDX) has been trading within a Channel Up since the September 02 Low and at the moment it is unfolding its 2nd Bullish Leg following the 4H MA50 (blue trend-line) bounce on September 17.
Based on the previous 4H MA50 Bullish Leg, the sequence should peak below the 2.382 Fibonacci extension at a maximum +3.96% rise. Our Target is slightly below those at 24900.
-------------------------------------------------------------------------------
** Please LIKE 👍, FOLLOW ✅, SHARE 🙌 and COMMENT ✍ if you enjoy this idea! Also share your ideas and charts in the comments section below! This is best way to keep it relevant, support us, keep the content here free and allow the idea to reach as many people as possible. **
-------------------------------------------------------------------------------
💸💸💸💸💸💸
👇 👇 👇 👇 👇 👇
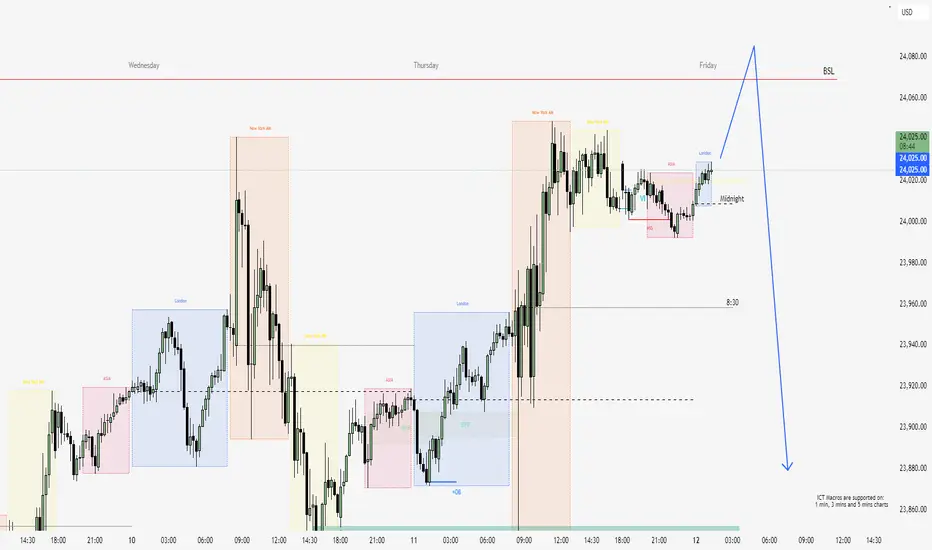
Friday Liquidity Sweep & Reversal Setup – NQNarrative:
Price action on NQ has swept the Buy Side Liquidity (BSL) on the daily timeframe around 24,060 during Thursday’s NY session. After the sweep, price consolidated just below the high, suggesting the potential for a Friday Reversal, in line with ICT’s classic "Reversal Friday" concept.
Today (Friday), I am watching for a potential Judas Swing to the upside during the New York AM session, aiming to lure breakout buyers above yesterday’s highs.
Once that buy-side liquidity is taken, I’ll look for:
A Market Structure Shift (MSS) on the 5M or 3M chart.
Entry on a Fair Value Gap (FVG) or a refined Order Block.
Stop Loss just above the Friday high (above the sweep).
Target 1: Return to the weekly open area or 1H OB.
Target 2: 23,880–23,900 → previous BPR zone and discount level.
Confluences:
✅ Daily BSL swept.
✅ Asian MSS already occurred.
✅ Price is sitting inside premium & consolidating.
🔍 Watching for SMT divergence between NQ and ES (S&P) – if ES breaks high and NQ doesn’t → bearish confirmation.
Execution:
Will wait for price to spike above the current range (Judas), then confirm BOS/MSS and enter short on the retracement.
NQ100 Intraday Outlook – Sept 8, 2025🧠 NQ100 Intraday Outlook – Sept 8, 2025
Bias: Intraday Bearish after NY Open
Price is currently trading within a well-defined premium zone, between the Sunday-Monday Order Block and the BPR M30 area.
🧩 Key Observations:
Price tapped into a minor M5 Order Block (OB) right after the 8:30 NY macro event.
We're seeing a reaction to a short-term OB, with a small push up likely to grab liquidity above the London session high.
Expecting liquidity run + rejection from the upper OB zone (23,810–23,830).
🔽 Bearish Scenario:
After the sweep of local highs, I anticipate a sell-off toward the Imbalance zone below (23,710 area).
Main targets are:
Imbalance fill
Possibly further down toward Weekly Open near 23,680
🔧 Confluence:
Midnight Open has already been reclaimed.
NY AM session is about to open – expecting expansion to provide confirmation.
Potential divergence between NQ (stronger) and ES (weaker) gives context for relative weakness later in the session.
📌 Idea Summary:
I expect one final push into the premium zone to grab liquidity before reversing down toward the Imbalance and possibly into the Weekly Open.
