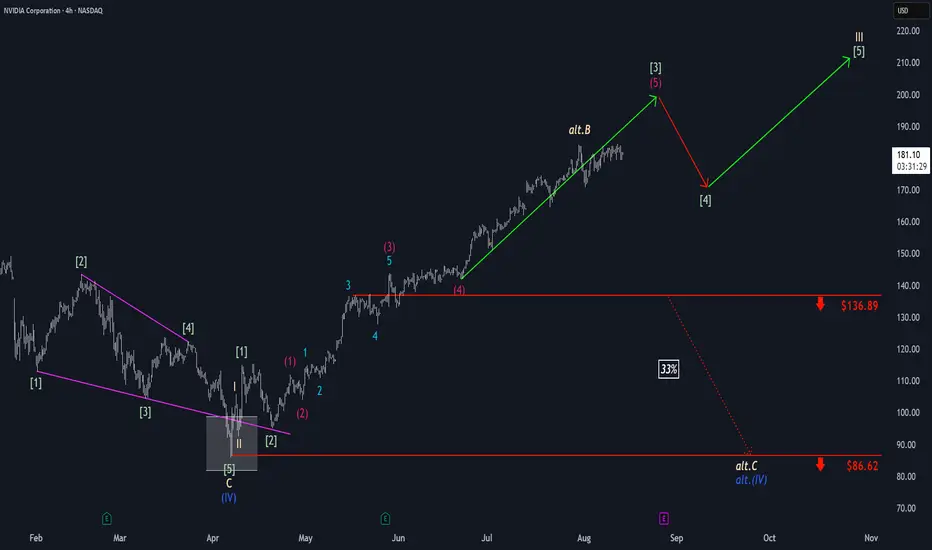
Nvidia: New Low ExpectedNvidia should soon develop further downward momentum to carve out the low of the beige wave IV. Nevertheless, price should pivot upward before dropping below the support at $145.50 and rise into our red Target Zone between $227.38 and $260.60. This is where the waves V in beige, (V) in blue, and in lime green are expected to find their common peak, followed by a new, significant correction phase. Consequently, we consider the red zone a suitable range to enter on the short side, with a stop set 1% above the zone's upper edge to aid in risk management. We also consider a 33% probability that the lime green wave alt. already completed at $212.16. This alternative scenario would be confirmed by direct sell-offs below the $145.50 support.
Nvdaanalysis

NVDA ALERT: Critical Drop AheadNvidia remains in a broader uptrend, but the chart shows a clear trendline breakout followed by the beginning of a pullback.
Using Fibonacci, a correction typically starts after a red candle forms following a sequence of green candles. In most cases, the pullback continues toward the 0.5 retracement level. In this setup, the 0.5 level aligns with a major key support, increasing its importance.
On the weekly timeframe, the 50 EMA is also converging at the same zone, which often acts like a magnet for price. This creates multiple confirmations pointing toward a potential move downward.
The weekly chart has printed a bearish engulfing , followed by three consecutive red candles, adding another strong confirmation for a continued correction.
Both MACD and RSI are sloping downward, supporting the bearish momentum.
If price reaches the expected zone, monitoring the reaction will be critical. A deeper decline into the global trendline is possible only if the key level is broken, though this scenario appears less likely.
Overall, NVDA shows several aligned signals indicating a move toward the correction zone before any potential recovery.
NVDA $182 Weekly CALL Setup – Cheap Premium, Big Upside?
# 🚀 NVDA Weekly Options Trade Idea (2025-09-03)
### 📊 Multi-Model Recap
* **Daily RSI**: 📉 34.3 (weak)
* **Weekly RSI**: 🔻 73.2 (falling)
* **Volume**: +1.3x → institutional distribution signs
* **Options Flow**: 🔥 C/P = 1.96 (bullish skew)
* **Gamma/Theta**: ⚡ High risk (2 DTE)
👉 Models Split:
* 🐻 Bearish: Claude, Gemini → favor \$165 PUT
* 🐂 Bullish: Llama, Grok → favor \$175 CALL
* 😶 Neutral/No Trade: Claude (low confidence)
---
### 🧭 Consensus Read
* Price & volume = bearish ⚠️
* Options flow & VIX = bullish 📈
* Net: **Mixed bias → tactical bullish bounce possible**
---
### ✅ Trade Setup (Viral Play)
```json
{
"instrument": "NVDA",
"direction": "CALL",
"strike": 175,
"expiry": "2025-09-05",
"entry_price": 0.68,
"profit_target": 1.36,
"stop_loss": 0.34,
"size": 1,
"confidence": 0.65,
"entry_timing": "market open"
}
```
---
### 🎯 Trade Details
* 📌 **Strike**: \$182 CALL
* 💵 **Entry**: 0.68 (ask, open)
* 🎯 **Target**: 1.36 (+100%)
* 🛑 **Stop**: 0.34 (-50%)
* 📅 **Expiry**: Sep 5 (2 DTE)
* 📈 **Confidence**: 65%
* ⏰ **Hold Policy**: Close by Thu EOD (don’t ride Friday gamma bomb)
---
⚠️ **Risks**:
* 2 DTE = 🔥 high gamma / fast theta decay
* Divergent signals → whipsaws possible
* Tight stop discipline required 🚨

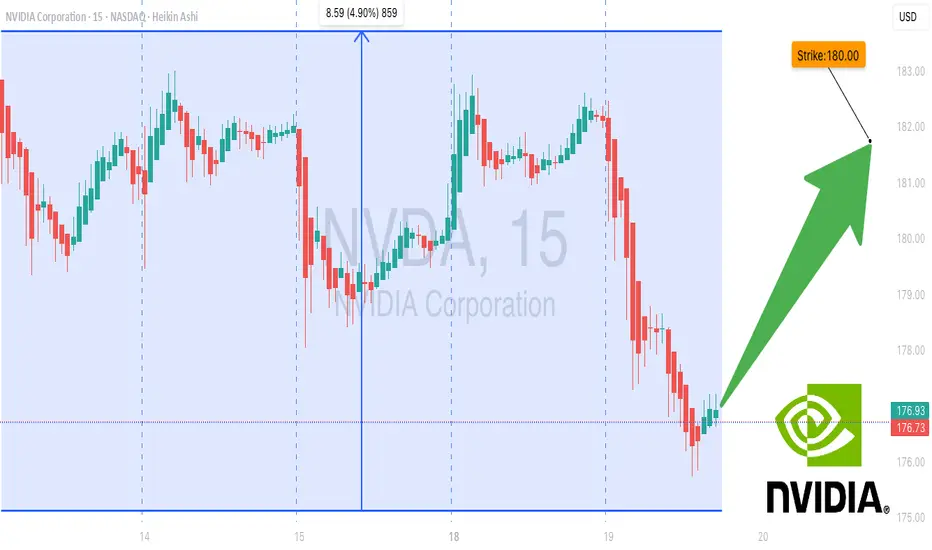
Strong Bullish Flow in NVDA: $180 Calls Primed for Breakout! 🚀 NVDA Weekly Options Bullish Flow – Aug 19, 2025
**Market Sentiment:**
📈 Total calls: **632,689** | Total puts: **334,721**
💥 **Call/Put Ratio: 1.89 → Strong Weekly Bullish Flow**
⚠️ Gamma Risk: Moderate – watch volatility closely.
**Technical Indicators:**
* **Daily RSI:** 63.3 → slight pullback signs
* **Weekly RSI:** 87.2 → 🚀 strong weekly momentum
* **Weekly Volume Ratio:** 0.9x → weak institutional activity, caution advised
**Options Highlights:**
* Key strikes: **\$180** (OI: 65,649), **\$187.50** (liquid and premium-friendly)
* Expiration in **3 days** → time decay accelerating
**Risks to Monitor:**
* Weak weekly volume
* Daily RSI trending down
* Price support at **\$175.90–\$176.00**
**Consensus & Trade Setup:**
* **Overall Bias:** Moderate Bullish
* **Recommended Trade:** **Single-leg Call**
* **Strike:** \$180.00
* **Entry:** \$3.60
* **Stop Loss:** \$1.80
* **Profit Target:** \$6.00–\$7.50 (80%-100% potential)
* **Confidence:** 65%
**Trade JSON Snapshot:**
```json
{
"instrument": "NVDA",
"direction": "call",
"strike": 180.0,
"expiry": "2025-08-22",
"confidence": 0.65,
"profit_target": 6.00,
"stop_loss": 1.80,
"size": 1,
"entry_price": 3.60,
"entry_timing": "open",
"signal_publish_time": "2025-08-19 13:15:57 EDT"
}
NVDA Ready to Break Higher – $187.50 Calls Flashing Opportunity!
# 🚀 NVDA Weekly Options Analysis (2025-08-17) – Don’t Miss Out!
### 🔎 Model Insights Recap
**Grok/xAI Report**
* 📊 RSI: Falling (daily & weekly → potential exhaustion)
* 📈 Call/Put Ratio: **2.00 (Bullish flow)**
* 🔊 Volume: Weak
* ✅ Decision: Moderate bullish → suggested **\$190 Call**
**Gemini/Google Report**
* 📊 RSI: Declining
* 📈 Options Flow: Strong, but weak trend & volume
* 🛑 Decision: **Pass** (low confidence)
**Claude/Anthropic Report**
* 📊 Technical: Overbought with negative divergence
* 🔊 Volume: Flat weekly
* 🛑 Decision: **No trade** (bearish momentum indicators)
**Llama/Meta Report**
* 📊 Bias: Neutral-bullish (options flow positive)
* 🔊 Volume: Weak
* ✅ Decision: **\$187.50 Call** with caution
**DeepSeek Report**
* 📊 Market: Bearish divergence despite bullish flow
* 🔊 Volume: Weak institutional support
* 🛑 Decision: **No trade**
---
### 📌 Key Agreements
✔️ Declining daily & weekly RSI = potential momentum exhaustion
✔️ Strong call/put ratio = bullish sentiment from options traders
✔️ Weak volume = lack of support for sustained upside
### 📌 Key Disagreements
⚖️ Grok/xAI & Llama/Meta → potential bullish calls
⚖️ Gemini/Claude/DeepSeek → caution/pass
⚖️ Bullishness varies depending on options flow vs volume
---
## 📊 Recommended Trade Setup
* **Direction:** CALL (Long)
* **Strike:** \$187.50
* **Expiry:** 2025-08-22
* **Entry Price:** \$0.85
* **Stop Loss:** \$0.34 – \$0.425 (40-50% of premium)
* **Profit Target:** \$1.50 (50-100% return)
* **Entry Timing:** Market Open
* **Confidence:** 65%
---
### ⚠️ Key Risks
* **Momentum Exhaustion:** Falling RSI could signal reversals
* **Weak Institutional Support:** Volume may limit upside
* **Event Risk:** Upcoming earnings may introduce volatility
---
📊 **TRADE DETAILS JSON**
```json
{
"instrument": "NVDA",
"direction": "call",
"strike": 187.50,
"expiry": "2025-08-22",
"confidence": 0.65,
"profit_target": 1.50,
"stop_loss": 0.34,
"size": 1,
"entry_price": 0.85,
"entry_timing": "open",
"signal_publish_time": "2025-08-17 09:26:30 EDT"
}
```

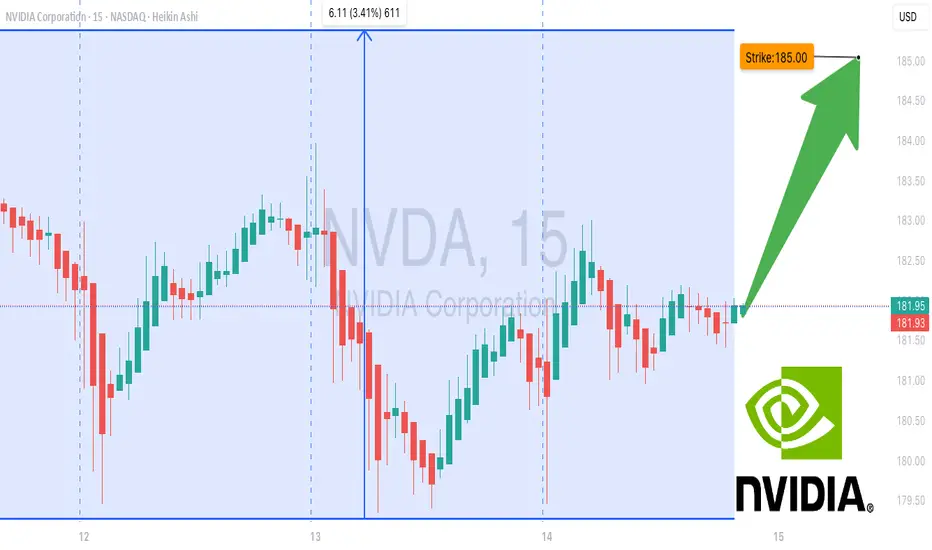
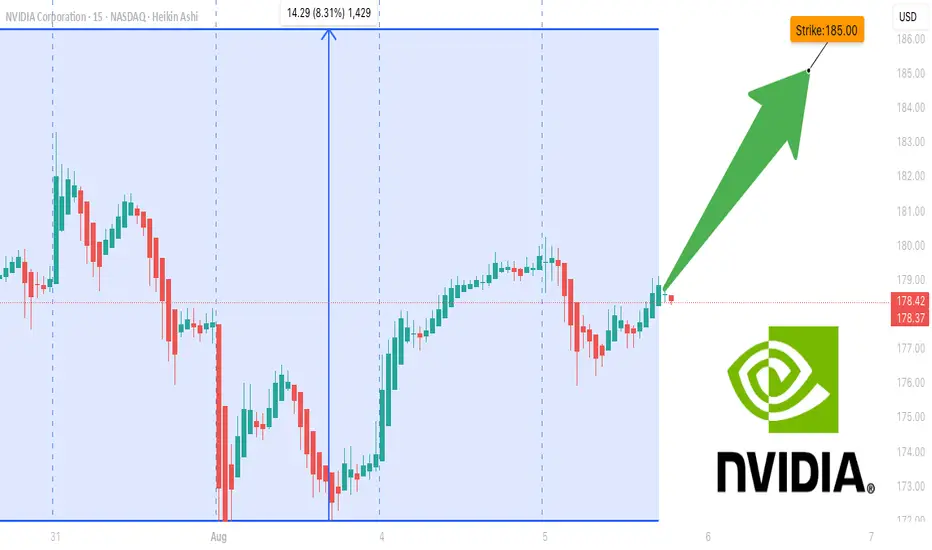
NVDA Gamma Showdown: Will Bulls Break $185 Before Time Runs Out? 🚀 NVDA Gamma Showdown: Will Bulls Break \$185 Before Time Runs Out?
**Sentiment:** ⚖️ *Moderate Bullish, High Risk*
* **Call/Put Ratio:** 1.78 📈
* **Daily RSI:** Mixed → Losing momentum
* **Weekly RSI:** Still bullish
* **Volume:** Weak → Low institutional conviction
* **Gamma Risk:** 🔥 HIGH — expiry in 1 day
* **Time Decay:** Accelerating ⚡
---
### 📊 **Consensus Highlights**
✅ Bullish options flow supports upside potential
⚠️ Weak volume + gamma risk = cautious sizing
💡 Tight stop loss and fast profit-taking advised
---
### 🎯 **Trade Setup**
* **Type:** CALL (Naked)
* **Strike:** \$185.00
* **Expiry:** 2025-08-15
* **Entry:** \$0.62
* **Profit Target:** \$0.86 (+30%)
* **Stop Loss:** \$0.31 (–50%)
* **Confidence:** 65%
* **Entry Timing:** Market open
---
💬 *This is a high-risk, high-reward expiry play — watch it like a hawk.*
📌 *Not financial advice. DYOR.*
---
**#NVDA #OptionsTrading #GammaSqueeze #DayTrading #StocksToWatch #OptionsFlow #TradingSignals #StockMarket**
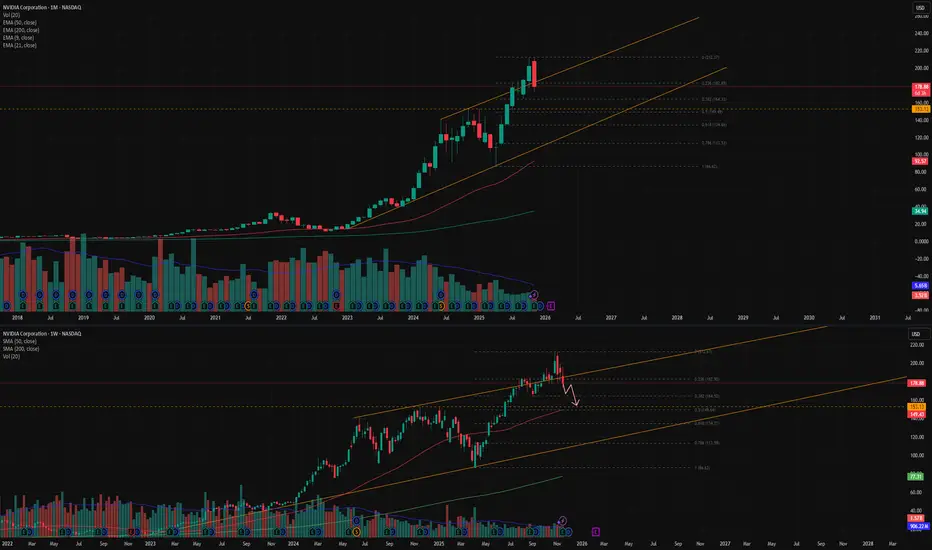
Nvidia: Extending the RallyThe bulls have maintained their momentum in Nvidia, effectively managing any interim pullbacks and allowing the stock to make further gains within the framework of green wave . We still see some additional upside potential at this stage before an interim correction of wave is likely. Well above support at $136.89, wave should then begin, pushing the stock even higher and completing the larger beige wave III. That said, we still see a 33% chance that NVDA has only recently marked the corrective top of beige wave alt.B and could soon fall below $136.89, setting a new correction low for blue wave alt.(IV) near the $86.62 level. Primarily, however, we believe wave (IV) has concluded.
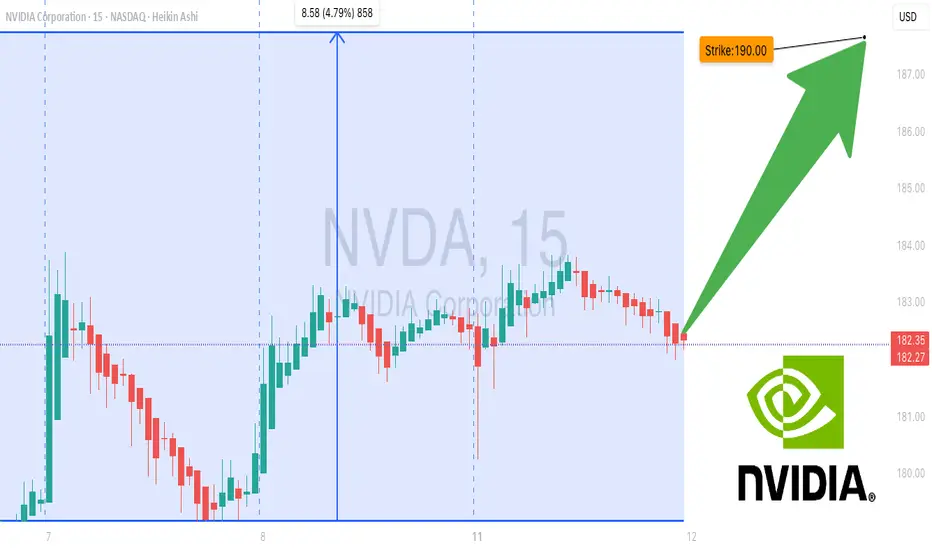
NVDA don’t Miss Out--$190 Call Target, Momentum on Fire## 🚀 NVDA Weekly Options Breakdown (Aug 11, 2025) 🚀
### 🔥 Market Sentiment: Bullish Bias Across Models
* **Grok/xAI**: Strong Bullish — rising RSI & bullish flow, but *watch weak volume*.
* **Claude/Anthropic**: Moderate Bullish but *no trade* due to policy risks & volume doubts.
* **Gemini/Google**: Moderate Bullish, recommends **\$192.5 calls** with stop loss — volume risk noted.
* **Llama/Meta**: Bullish — buy **\$190 calls**, manage volatility & premium decay.
### ✅ Consensus Trade Setup:
**Buy \$190 Calls** expiring Aug 15 @ \$0.70 premium
* 🎯 Profit Target: \$0.91
* 🛑 Stop Loss: \$0.35
* 📊 Confidence: 70%
* ⏰ Entry: Market Open Next Trading Day
### ⚠️ Key Risks:
* Policy/news impact on semiconductor sector
* Moderate gamma risk & possible volatility spikes near expiry
---
### 🔍 Model Insights Breakdown
| Model | Sentiment | Trade Idea | Confidence |
| ---------------- | ---------------- | ------------------------------ | ---------- |
| Grok/xAI | Strong Bullish | Buy \$190 Calls | 70% |
| Claude/Anthropic | Moderate Bullish | No trade (high news risk) | 45% |
| Gemini/Google | Moderate Bullish | Buy \$192.5 Calls w/ stop loss | 65% |
| Llama/Meta | Bullish | Buy \$190 Calls w/ risk mgmt | 70% |
---
### 💡 Why This Matters
* RSI and options flow point strongly bullish — calls dominate puts 1.2+ ratio
* Volume confirmation weak, so *manage risk tightly*
* Position best for aggressive traders ready to manage fast moves
---
📈 **NVDA Weekly Options Trade Summary**
```json
{
"instrument": "NVDA",
"direction": "call",
"strike": 190.0,
"expiry": "2025-08-15",
"confidence": 0.70,
"profit_target": 0.91,
"stop_loss": 0.35,
"size": 1,
"entry_price": 0.70,
"entry_timing": "open",
"signal_publish_time": "2025-08-11 10:33:48 UTC-04:00"
}
```
NVDA Don’t Miss Out## ⚡ NVDA Swing Setup (2025-08-08) ⚡
**Bias:** 📈 **Moderate Bullish** — RSI hot (67), trend up, low VIX, but volume still meh.
**🎯 Trade Plan**
* **Ticker:** \ NASDAQ:NVDA
* **Type:** CALL (LONG)
* **Strike:** \$185.00
* **Entry:** \$3.15 (near open)
* **Profit Target:** \$4.65 (+48%)
* **Stop Loss:** \$2.13 (-30%)
* **Expiry:** 2025-08-22 (14DTE)
* **Size:** 1 contract
* **Confidence:** 75%
**📊 Key Notes**
* RSI strong = momentum on your side ✅
* VIX favorable for calls ✅
* Weak volume & neutral flow = confirm before adding size ⚠️
* Watch breakout above **\$183.88** for momentum kick
**💡 Play Idea:**
Ride momentum to \$195+, take 50% profits at \$4.65, trail stops to lock gains.

NVDA Don't Miss Out !!!!
**NVDA \$185C Weekly Momentum Surge ⚡ All Models Aligned – 75% Confidence Setup 🔥**
---
### 📊 **Post Body (Optimized for TradingView):**
**NVDA Weekly Call Play — Aug 8 Expiry (3 DTE) 🔥**
📈 **Momentum Snapshot:**
* **Weekly RSI:** 🔼 Above 50 and climbing
* **Daily RSI:** 🔻 Falling — short-term caution
* **Volume:** 1.2x previous week (🟢 Institutional flow)
* **Volatility (VIX):** <22 — favorable setup
* **Gamma Risk:** 🟠 Moderate
---
🧠 **Model Scorecard Summary:**
* **Grok / xAI:** 4/5 Bullish 🟢
* **Gemini (Google):** 3/5 Bullish with 80% confidence 🟢
* **Claude (Anthropic):** 5/5 Bullish 💯
* **LLaMA (Meta):** 4/5 Bullish 💪
* **DeepSeek:** 5/5 Bullish 🚀
✅ **Consensus:** Strong Bullish 🔥
---
### 💡 **Trade Setup:**
* 🎯 **Strategy:** Long CALL
* 🟢 **Strike:** \$185
* 📅 **Expiry:** Aug 8, 2025
* 💵 **Entry Price:** \$0.96
* 📈 **Target Exit:** \$1.90 (100% gain)
* 🛑 **Stop Loss:** \$0.48 (50% risk cap)
* 📏 **Size:** 1 contract
* ⏰ **Timing:** Market Open
* 📊 **Confidence Level:** 75%
---
⚠️ **Key Risks to Watch:**
* Time decay – Only 3 DTE ⏳
* Daily RSI divergence 😬
* Gamma risk & market volatility (track \ TVC:VIX )
---
### 🧾 **Auto-Logger JSON (for tracking):**
```json
{
"instrument": "NVDA",
"direction": "call",
"strike": 185.00,
"expiry": "2025-08-08",
"confidence": 0.75,
"profit_target": 1.90,
"stop_loss": 0.48,
"size": 1,
"entry_price": 0.96,
"entry_timing": "open",
"signal_publish_time": "2025-08-05 09:43:22 UTC-04:00"
}
```
---
### 🏷️ **Suggested Hashtags (TradingView Style):**
`#NVDA #OptionsTrading #WeeklyOptions #CallOptions #MomentumStocks #AIStocks #TechLeaders #TradingSetup #RSISignal #GammaSqueeze #NVIDIA #OptionAlert #HighConviction #TradeIdeas #TechBreakout`
NVDA Bullish Weekly Trade Setup** – 2025-07-29
📈 **NVDA Bullish Weekly Trade Setup** – 2025-07-29
🚀 *"Momentum meets money flow!"*
### 🔍 Market Snapshot:
* 💥 **Call/Put Ratio**: 2.47 → Bullish sentiment confirmed
* 🧠 **RSI**: Rising on Daily & Weekly → Momentum building
* 🔕 **Low VIX**: Favors call strategies (cheap premiums)
* ⚠️ **Caution**: Light volume = soft institutional backing
---
### 🔧 Recommended Options Trade:
**🟢 NVDA \$182.50 CALL (Exp: Aug 1)**
💰 *Entry*: \~\$0.53 (Mid)
📈 *Profit Target*: \$0.69 – \$1.06
🛑 *Stop Loss*: \$0.32
📆 *DTE*: 3 days
🔄 *Entry Timing*: Market Open
✅ *Confidence*: 75%
🔥 *Theta & Gamma Risk*: Elevated — manage position size!
---
### 💡 Why This Trade?
✅ RSI Strength across timeframes
✅ Flow favors upside
✅ Cheap premium in a low-volatility regime
🟡 Just watch that volume…
---
📊 **TRADE SNAPSHOT (JSON):**
```json
{
"instrument": "NVDA",
"direction": "call",
"strike": 182.50,
"expiry": "2025-08-01",
"confidence": 0.75,
"profit_target": 1.06,
"stop_loss": 0.32,
"size": 10,
"entry_price": 0.53,
"entry_timing": "open",
"signal_publish_time": "2025-07-29 11:59:10 UTC-04:00"
}
```
---
📣 **Taglines for Sharing:**
* "NVDA setup is 🔥—momentum + flow = GO!"
* "Gamma risk is real—but so is this profit window 💸"
* "Short-term sprint or fade? This call has range."

NVDA 0DTE TRADE SIGNAL – JULY 25, 2025
⚡ NVDA 0DTE TRADE SIGNAL – JULY 25, 2025 ⚡
🚀 Strong Bullish Momentum – But Friday Expiration = Gamma Trap?
⸻
📊 Market Stats:
• 💰 Call Volume: Strong
• 🔻 Weak Volume Overall
• ⚖️ Call/Put Ratio: Bullish
• 📈 RSI: Overbought but still pushing
• ⏳ Time Decay: Accelerating
• ☠️ Gamma Risk: 🔥 MAX today (0DTE)
⸻
🧠 Model Summary:
• Grok/xAI: 🔒 NO TRADE today – wait for Monday
• Claude: 🛑 Caution – avoid entries today
• DeepSeek: ⏸️ 4/5 Bullish, wait for cleaner setup
• Gemini: 💡 Suggests $180C next week
• Llama: ✅ Bullish bias, but gamma risk = no go for Friday
⸻
📌 TRADE IDEA: Wait for Monday
📍 Strike: $175 Call
📆 Expiry: Today (0DTE)
💵 Entry Price: $0.56
🎯 Target: $0.95
🛑 Stop: $0.30
📈 Confidence: 65%
🕒 Entry Timing: Monday open IF support holds
⸻
⚠️ Key Warning:
Don’t get trapped by 0DTE gamma swings. Momentum says yes, time decay says no…
✅ Best move? Watch NVDA closely, then strike on Monday if volume confirms.
⸻
👍 Like & save if you’re tracking NVDA.
🔁 Repost if you’re waiting for the perfect Monday setup!
#NVDA #OptionsTrading #0DTE #GammaRisk #BullishSetup #TradingView #TechStocks #WeeklyOptions

Fundamental and technical analysis on NVDA (Chicken Nugget) soonFundamental Analysis
NVIDIA Corporation (NVDA) remains a key player in the tech sector, benefiting from the rise of artificial intelligence, data centers, and gaming. With sustained growth, constant innovation, and strong demand for its graphics chips, the company continues to deliver solid financial results.
Recent reports indicate revenue growth and expansion in key markets. Product diversification, particularly in supercomputers and embedded systems, strengthens NVDA’s position against competitors. Investor interest in the semiconductor industry helps maintain the stock’s positive momentum.
Technical Analysis
The chart analysis highlights key technical levels for investors:
- Key Resistance: $150 USD – This level must be broken to confirm a strong bullish trend. A breakout with volume could signal a gradual rise toward higher targets.
- Support Level: $131.50 USD – Strong demand and low supply are identified at this level, making it an excellent entry point for investors looking for buying opportunities before a potential rebound.
Targets & Strategy
- Short-term target (late June/early July): The target range of $170-$175 USD is possible if the bullish trend is confirmed. This level aligns with technical extensions and favorable market dynamics.
- July buyback (-5% to -10%): A moderate correction could occur, offering another buying opportunity before an upward recovery.
- Selling target (September to November): The next selling target is between $200-$240 USD, depending on market developments and investor sentiment.
Conclusion
NVDA stock presents interesting prospects, with well-defined technical levels and a strong fundamental outlook. Investors should monitor these thresholds to adjust their strategy based on market fluctuations.
If you want to refine this analysis or explore other scenarios, I'm here to dive deeper into key points! 🚀 Subscribe! TSXGanG
I hold a CCVM and MNC (Certificate of Competence to become a securities broker anywhere in Canada) and have been working as a trader for five years.
It’s a pleasure for me to help people optimize their trading strategies and make informed financial market decisions.

NVIDIA & xAI’s Grok 3: A Game-Changer or Overhyped AI Play?NVIDIA’s stock ( NASDAQ:NVDA ) has been on an unstoppable rally, driven by the AI boom. Now, with Elon Musk’s xAI set to launch Grok 3 —trained on an impressive 100,000 NVIDIA H100 GPUs —the market is buzzing with speculation. Could this be the catalyst that propels NVDA to the next level, or are we approaching an AI-driven valuation bubble?
Key Developments :
Massive GPU Demand : xAI’s Grok 3 will utilize a staggering 100,000 H100 GPUs, reinforcing NVIDIA’s dominance in AI hardware and boosting its market position.
Supercomputer Expansion : Musk’s team is building one of the most powerful AI training clusters in Memphis, Tennessee. This development could significantly increase NVIDIA’s long-term revenue streams, given its key role in powering these systems.
Release Date : Grok 3 is set to launch today, February 17, 2025(4 AM GMT) , with a live demonstration, which may influence sentiment around AI-related stocks, especially NVIDIA.
Market Sentiment & Risks : While these developments seem bullish for NVIDIA, some analysts, including hedge funds like Elliott Investment Management, have raised concerns over the potential for overvaluation as the AI euphoria spreads.
Conclusion: Grok 3’s launch will be a pivotal moment, with NVIDIA at the heart of the AI revolution. Whether this sparks a fresh rally or raises concerns about an AI bubble remains to be seen.
------------------------------------------------------------------------------
Now, let's use Technical Analysis to analyze NVIDIA stock(NVDA) .
In terms of technical analysis, the loss of an Ascending Channel is not good news for any asset and is a sign of weakness in the upward trend . This has happened to the NVIDIA stock(NVDA) .
From the point of view of Classical Technical Analysis , it seems that NVIDIA stock is completing the Rising Wedge Pattern .
Educational tip : The Rising Wedge Pattern is a bearish reversal or continuation pattern characterized by converging upward-sloping trendlines. It signals weakening bullish momentum, often leading to a breakdown below support. A confirmed breakout to the downside indicates a potential price decline.
I expect the launch of Grok 3 Artificial Intelligence(AI) can increase at least +10%+15% of NVIDIA stock(NVDA) . If the upper line of the Rising Wedge Pattern breaks , we can expect a further increase [ the next target can be Yearly Resistance(1=$175.68)(in case of breaking) ].
What’s your take? Drop your thoughts about NVIDIA in the comments! 👇
Be sure to follow the updated ideas.
NVIDIA Analyze (NVDAUSD), Daily time frame.
Do not forget to put Stop loss for your positions (For every position you want to open).
Please follow your strategy; this is just my idea, and I will gladly see your ideas in this post.
Please do not forget the ✅' like '✅ button 🙏😊 & Share it with your friends; thanks, and Trade safe.

NVDA making its way to retest a previous CHOCHHi Traders!
I'm waiting patiently on NVDA. It broke through a 4HR Bullish OB, and now It's making its way down to retest that breaker OB area. However, If it keeps breaking down past 136.00, then the 4HR CHOCH would become invalid. I have 2 alerts set- 1 at 140.50, and 136.50. These are potential areas where there could be a reversal. Price likes to test previous CHOCH patterns, so watching closely for the best possible entry if the chart presents itself that way.
If the reversal happens and continues to move up, I'm looking for price to break 150 since tapping that area a few times already. Lets see what we can get🤞
*DISCLAIMER: I am not a financial advisor. The ideas and trades I take on my page are for educational and entertainment purposes only. I'm just showing you guys how I trade. Remember, trading of any kind involves risk. Your investments are solely your responsibility and not mine.*

$NVDA NVIDIA AFTER CES: REALITY KICKS IN AFTER ATH | JAN08'25NASDAQ:NVDA NVIDIA AFTER CES: REALITY KICKS IN AFTER ATH | JAN08'25
NASDAQ:NVDA BUY/LONG ZONE (GREEN): $140.00 - $153.00
NASDAQ:NVDA DO NOT TRADE/DNT ZONE (WHITE): $136.00 - $140.00
NASDAQ:NVDA SELL/SHORT ZONE (RED): $127.00 - $136.00
NASDAQ:NVDA Trends:
NASDAQ:NVDA Weekly Trend: Bullish
NASDAQ:NVDA Daily Trend: Bullish
NASDAQ:NVDA 4H Trend: Bearish
NASDAQ:NVDA 1H Trend: Bearish
At CES 2025, NASDAQ:NVDA unveiled a series of groundbreaking announcements, including the RTX 50 series GPUs and the Cosmos AI platform, aimed at robotics and autonomous vehicles. This led to an immediate surge in NASDAQ:NVDA 's stock price, hitting new all-time highs and reaching the top of my previous bullish zone. However, the excitement didn't last, with the stock experiencing a significant pullback shortly after.
I will link below my previous NASDAQ:NVDA analyses, along with my NASDAQ:SMCI analysis and NASDAQ:AMD analysis!
This is what I would personally look at before entering trades, everything is subject to change on a daily basis and as I analyze different timeframes and ideas.
ENTERTAINMENT PURPOSES ONLY, NOT FINANCIAL ADVICE!
trendanalysis, trendtrading, priceaction, priceactiontrading, technicalindicators, supportandresistance, rangebreakout, rangebreakdown, rangetrading, chartpatterntrading, chartpatterns, spy, sp500, s&p, fed, federalreserve, fedrate, fedratecut, interestrate, jeromepowell, fedchair, 50bps, volatile, volatility, nvidia, nvidiapricetarget, nvdatrend, nvidiatrend, nvdasetup, nvidialongs, nvidiashorts, chipmakers, smci, amd, supermicro, advancedmicro, chipmakertrends, newchipmakers, trilliondollarchipmakers, nvidiaproducts, nvidiachips, nvdachips, nvdatrend, nvdaprice, nvidiaprice, nvidiaanalysis, nvidiasetups, nvdaideas, ces, cesevent, cesnvda, cesnvidia, ces2025, cesamd, cessmci, cesrtx50, rtx50, gpus, cosmosai, newai, aitrends, newaiindustries, nvdaproducts, nvdartx, jensenhuang, nvdaceo, nvdajensenhuang, nvdaoptions, amdsmcinvda,
