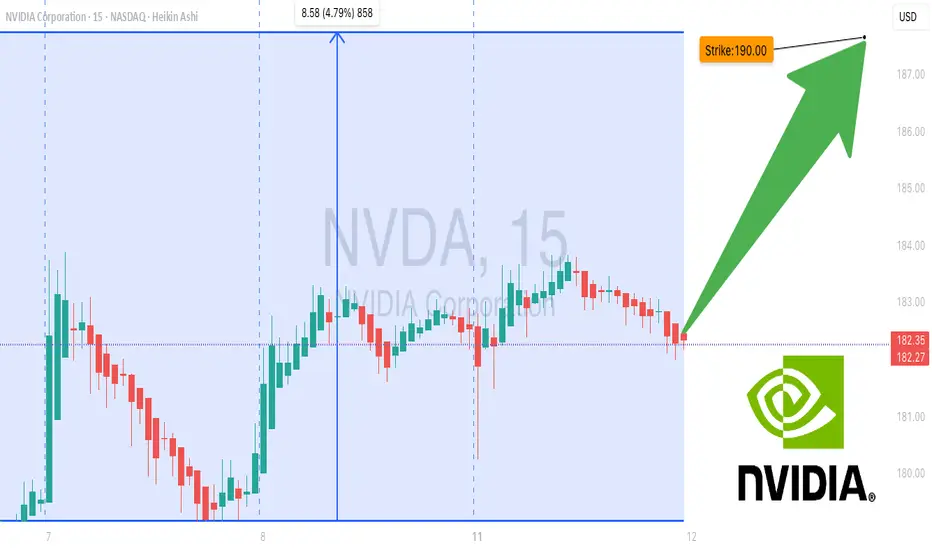
NVDA Bullish Setup | Structure, Momentum & Risk Defined🔥 NVDA Bullish Layered Accumulation Playbook (Swing Trade)
Asset:
NVDA – NVIDIA Corporation
NASDAQ Exchange | US Equities
🧭 Trade Thesis (Bullish Bias)
NVDA remains structurally strong within the broader AI, data-center, and semiconductor leadership cycle. Price action shows healthy pullback behavior within a dominant bullish trend, offering swing traders an opportunity to accumulate via layered entries instead of chasing breakouts.
This plan is designed using a layered limit-order approach (“thief-style accumulation”), allowing flexibility and improved average pricing during volatility.
🟢 Entry Strategy – Layered Accumulation (Thief Style)
Instead of a single entry, this plan uses multiple buy-limit layers to manage volatility and avoid emotional entries.
📌 Layered Buy Zones (example):
Buy Limit 1: $190.00
Buy Limit 2: $185.00
Buy Limit 3: $180.00
👉 Traders may add or adjust layers based on their own risk tolerance, timeframe, and volatility expectations.
👉 This structure allows participation from any price level, while improving cost basis if price dips.
🔴 Risk Management – Stop-Loss Zone
🛑 Protective Stop-Loss: $175.00
⚠️ Important Note (Risk Awareness):
Dear Ladies & Gentlemen (Thief OGs), this stop-loss level is not mandatory. Risk management is a personal decision — manage size responsibly and secure profits according to your own trading plan.
🎯 Target Zone – Profit Protection Area
🚧 Target: $205.00
This level aligns with:
Prior strong resistance (police barricade zone)
Signs of potential overbought conditions
Possible liquidity traps near highs
📌 The plan is to escape with profits, not to predict tops. Partial profit-taking is encouraged as price approaches resistance.
⚠️ TP Reminder:
This take-profit level is guidance only. Traders are free to secure gains based on their own strategy and market conditions.
📊 Technical Context (Clean & TradingView-Friendly)
Bullish higher-timeframe structure intact
Pullback within trend = accumulation opportunity
Layered entries reduce timing risk
Resistance overhead justifies disciplined exits
🌍 Fundamental & Economic Factors Supporting NVDA
Fundamental Drivers:
NVIDIA remains a core leader in AI chips, data centers, and accelerated computing
Strong demand from cloud providers, AI infrastructure, and enterprise compute
Ongoing investment in next-gen GPUs and AI platforms
Macro & Economic Considerations:
US tech sector strength tied to AI capex cycles
Market sensitivity to interest-rate expectations and inflation data
Risk-on sentiment generally benefits high-growth semiconductor leaders
📌 Watch upcoming:
US CPI / PPI inflation data
Federal Reserve rate guidance
Earnings or forward-looking statements impacting AI demand expectations
🔗 Related Symbols to Watch (Correlation Check)
NASDAQ:SOXX / NASDAQ:SMH – Semiconductor ETFs (sector health confirmation)
NASDAQ:QQQ / NASDAQ:NDX – Nasdaq strength supports NVDA momentum
NASDAQ:AMD – Peer comparison and sentiment gauge
NASDAQ:MSFT / NASDAQ:GOOGL – AI infrastructure demand correlation
📈 Strength in these symbols often confirms bullish continuation in NVDA.
🧠 Master Trader Note (Correction & Guidance)
You’re not “wrong” in asking for layered entries at any price level — this is a valid accumulation methodology. The key improvement is clarity, structure, and risk framing, which ensures the idea remains educational, compliant, and professional rather than promotional or misleading.
✨ “If you find value in my analysis, a 👍 and 🚀 boost is much appreciated — it helps me share more setups with the community!”
⚠️ Disclaimer: This is a thief-style trading strategy just for fun. This analysis is for educational purposes only and does not constitute financial advice. Trade responsibly.
Nvdabuy

Nvidia (NASDAQ: $NVDA) Eyes H200 Output Boost on China DemandNvidia (NASDAQ: NVDA) is weighing a major expansion of its H200 AI chip production after demand from Chinese companies exceeded current supply, according to Reuters sources. The surge in interest follows the U.S. government’s recent decision to allow Nvidia to export H200 processors to China under a 25% tariff, reigniting competition for access to high-performance computing hardware.
Chinese tech giants—including Alibaba and ByteDance—reportedly contacted Nvidia almost immediately after the announcement, eager to secure bulk orders of the H200. However, the situation remains fluid. The Chinese government has not yet approved inbound H200 shipments and held emergency meetings this week to determine whether to allow the chip into the country.
Limited supply is another complication. Nvidia is prioritizing production of its next-generation Blackwell and upcoming Rubin architectures, leaving only small quantities of H200 units available. This scarcity has intensified demand because the H200 is currently the most powerful AI chip legally accessible to Chinese companies—nearly six times stronger than the downgraded H20 version released in 2023.
Industry analysts warn that allowing the H200 into China could slow the growth of China’s domestic AI chip ecosystem. Chinese regulators are considering conditions such as requiring each H200 purchase to be bundled with locally produced chips to support homegrown semiconductor development.
Technical Analysis
The NVDA chart currently shows price consolidating below the recent high near $212. After a strong multi-month rally, the stock has pulled back into a key short-term support zone around $175–$185. Holding this range could position NVDA for a retest of its highs, supported by strong demand catalysts and ongoing AI infrastructure investment.
If price breaks below $175, a deeper correction toward the $150 demand zone becomes likely. Volume is stabilizing, and RSI sits mid-range, indicating a neutral momentum backdrop awaiting a directional catalyst. Traders should watch for reclaiming the $190–$195 area to confirm bullish continuation.

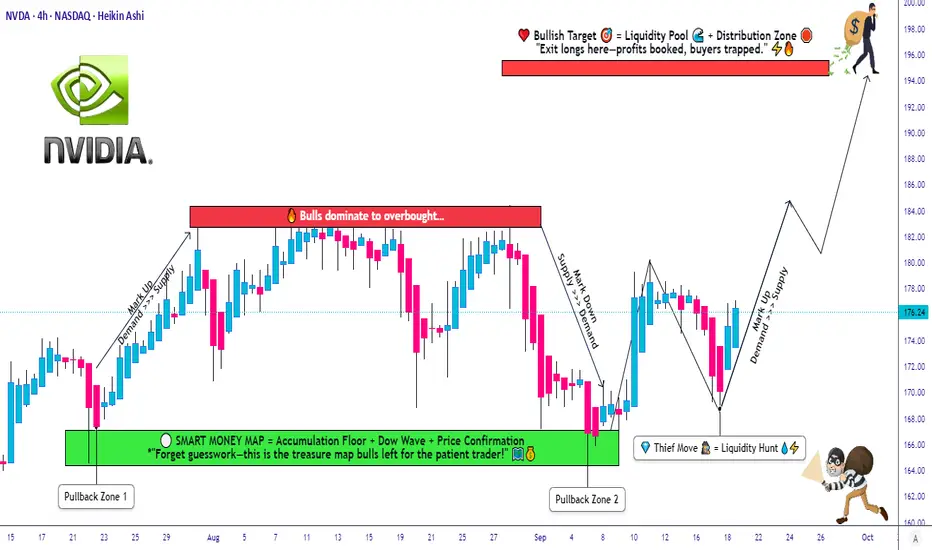
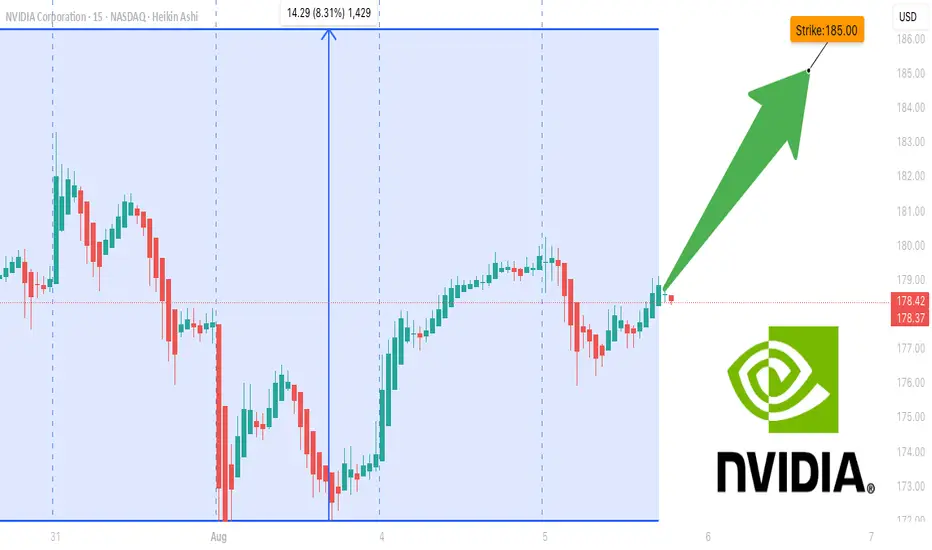
NVDA Setup Explained: Layered Entry + Clear SL/TP Levels😎 NVDA Thief’s Wealth Heist: Swing/Day Trade Blueprint 🚀
Asset: NVIDIA Corporation (NVDA) 📈Vibe: Bullish, sneaky, and ready to snatch profits with style! 💰
Welcome, ladies and gentlemen, to the Thief’s OG Wealth Strategy Map for NVDA!
This is a fun swing/day trading plan designed to grab liquidity like a master thief. Let’s break down this bullish setup with a double bottom pullback, layered entries, and a cheeky escape plan. Ready to outsmart the market? 🕵️♂️
📊 Market Analysis: Why NVDA?
NVDA is riding a bullish wave 🌊, confirmed by a double bottom pullback pattern and a sneaky liquidity grab at key support levels. The stock’s momentum is screaming “UP!” as buyers step in to defend the price. This setup is perfect for swing or day traders looking to capitalize on NVIDIA’s tech-fueled surge. 💻
🗺️ The Thief’s Plan: Bullish Heist Strategy
🎯 Entry Strategy:Deploy the Thief’s Layering Tactic with multiple buy limit orders to maximize your entry precision.
Suggested price levels:
$172.00
$174.00
$176.00
$178.00
Pro Tip: Feel free to add more layers based on your risk appetite and market conditions. The more, the merrier! 🧑💼
🛑 Stop Loss (SL):Set a Thief’s SL at $168.00 to protect your loot.
Note: Dear Thief OGs, this SL is my suggestion, but you’re the boss of your trades! Adjust based on your risk tolerance and let the profits roll. 💸
🎉 Take Profit (TP):Aim for the juicy $195.00 target, where we expect strong resistance, potential overbought conditions, and a possible trap for the unprepared. Lock in those hard-earned gains and escape like a pro! 🏃♂️
Note: This TP is my call, but you do you! Take profits at your own pace and keep the cash flowin’. 😎
🔗 Related Pairs to Watch (in USD)
To boost your market awareness, keep an eye on these correlated assets:
NASDAQ:AMD (Advanced Micro Devices): NVDA’s chipmaking cousin often moves in tandem. A bullish NVDA could signal strength in AMD. 📡
NASDAQ:SMH (VanEck Semiconductor ETF): This ETF tracks the semiconductor sector, including NVDA. Watch for sector-wide momentum. 📊
NASDAQ:QQQ (Invesco QQQ Trust): NVDA’s a heavy hitter in this tech-heavy ETF. QQQ’s trend can confirm NVDA’s direction. 🚀
Key Correlation Point: NVDA’s performance is tied to the broader semiconductor and tech sector. If AMD or SMH shows bullish patterns, it reinforces NVDA’s upside potential. Conversely, weakness in QQQ could signal caution. Stay sharp, thieves! 🕵️
🛠️ Why This Setup Rocks
Double Bottom Pullback: A textbook bullish reversal pattern, signaling strong buying interest. 📉➡️📈
Liquidity Grab: The market’s attempt to shake out weak hands before the real move up. We’re smarter than that! 😏
Layered Entries: Spread your risk across multiple price levels for a smoother ride. 🎢
Risk Management: Clear SL and TP levels keep your heist disciplined and profitable. 🧠
⚠️ Disclaimer
This Thief Style Trading Strategy is just for fun and educational purposes! I’m not a financial advisor, and trading involves risks. Make your own decisions, manage your risk, and trade responsibly. Let’s keep the vibes high and the losses low! 😜
✨ “If you find value in my analysis, a 👍 and 🚀 boost is much appreciated — it helps me share more setups with the community!”
#NVIDIA #NVDA #Trading #SwingTrading #DayTrading #ThiefStrategy #StockMarket #Bullish #TechnicalAnalysis
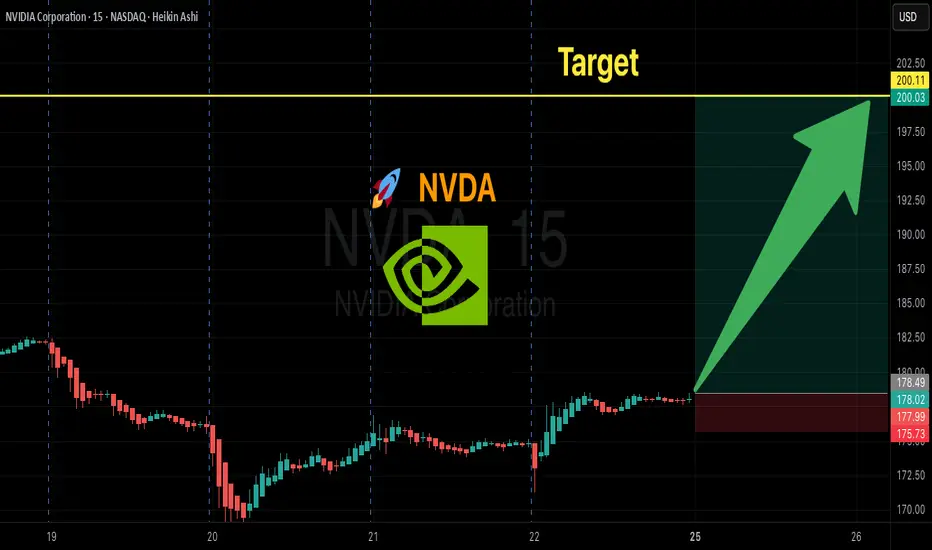
NVDA Earnings Play | \$190C– Don’t Miss Out
# 🚀 NVDA Earnings Play | \$190C @ 2.49 | 200–400% Target 🎯
### 📝 Quick Take (TL;DR)
* **Bias:** Moderate-Bullish (78% confidence).
* **Rationale:** Fundamentals 🔥 + Options flow skewed bullish 📈 + Technicals constructive.
* **Main Risk:** China export \~\$8B headwind in guidance.
---
### 🎯 Trade Idea
* **Buy** NVDA **2025-08-29 \$190 Call**
* 📌 Entry: \$2.49 (ask) — enter **pre-earnings close** (Aug 26 AMC).
* 🛑 Stop: \$1.25 (−50%).
* 🎯 Targets:
* +200% → \$7.47
* +300% → \$9.96
* ⏳ Exit Rule: If neither stop/target hit, **close within 2h post-earnings open**.
* ⚖️ Risk: \$249 per contract (max loss).
---
### 📊 Why This Setup?
**Fundamentals (9/10)**
* Revenue growth: +69% TTM 🚀
* Margins elite (gross 70%, net 52%) 💰
* Beat history: 8/8 last quarters ✅
* Balance sheet strong (cash \~\$54B).
**Options Flow (8/10)**
* Implied move ~~5.9% (~~\$10.5).
* Call OI heavy @ \$185–\$200 (gamma cluster).
* Liquidity excellent at \$190 strike (OI >64k).
**Technicals (8/10)**
* Price \$179.83, holding above 20/50/200 MAs.
* RSI neutral (53).
* Resistance: \$184.5 / \$190 / \$200.
* Coiling under highs 🔄.
**Macro (6/10)**
* AI/data center demand = secular tailwind.
* China ban risk headline.
* VIX \~15 → complacency = bigger gap risk.
---
### ⚠️ Risks
* Guidance may highlight China hit (\$8B) → bearish gap.
* IV crush 30–50% post-print.
* Gap risk may bypass stop.
* Single-leg naked = high variance → **size small (≤2% portfolio).**
---
### 📌 Execution Checklist
✅ Confirm ask = 2.49 @ close.
✅ Expiry = 2025-08-29 (weekly).
✅ Size ≤ 2% acct.
✅ Close within 2h post-earnings if no trigger.
---
### 📊 TRADE JSON
```json
{
"instrument": "NVDA",
"direction": "call",
"strike": 190.0,
"expiry": "2025-08-29",
"confidence": 78,
"entry_price": 2.49,
"stop_loss": 1.245,
"profit_target": 7.47,
"size": 1,
"entry_timing": "pre_earnings_close",
"earnings_date": "2025-08-26",
"earnings_time": "AMC",
"expected_move": 5.9,
"iv_rank": 0.75,
"signal_publish_time": "2025-08-26 14:00:37 UTC-04:00"
}
```
---
### 🔖 Hashtags
\#NVDA #EarningsPlay #OptionsTrading #CallOptions #StockMarket #AIStocks #Futures #SwingTrade #TradingSignals #RiskReward #OptionsFlow #SP500 #TechStocks

NVDA \$200C→ Big Move Loading?
# 🚀 NVDA Weekly Options Setup | \$200 Call 🎯 (High Risk / High Reward)
📊 **TRADE SNAPSHOT**
* **Ticker**: NVDA
* **Direction**: 📈 CALL (LONG)
* **Strike**: \$200
* **Entry Price**: \$1.44
* **Profit Target**: \$2.16 (50% gain)
* **Stop Loss**: \$0.58 (40% risk)
* **Expiry**: 2025-08-29
* **Confidence**: 65%
* **Timing**: Enter at Open
* **Signal Time**: 2025-08-23 11:11 EDT
---
### 🔎 Market Analysis
✅ **Weekly RSI**: 87.2 (RISING → Strong Bullish)
⚠️ **Daily RSI**: 63.3 (FALLING → Short-term caution)
📉 **Volume**: 0.9x last week (Weak confirmation)
🔥 **Options Flow**: Calls 617k vs. Puts 383k → **1.61 ratio (Bullish Bias)**
---
### 📈 Bias & Strategy
* **Overall Sentiment**: **Moderate Bullish** 🚀
* Bullish institutions loading Calls → supports upside.
* Weak daily momentum + low volume = ⚠️ caution.
* High gamma risk → manage tight with stop loss.
🏷 **Tags**:
\#NVDA #OptionsTrading #SwingTrade #WeeklyOptions #TradingView #StockMarket #EarningsPlay #MomentumTrading #OptionsFlow #GammaRisk
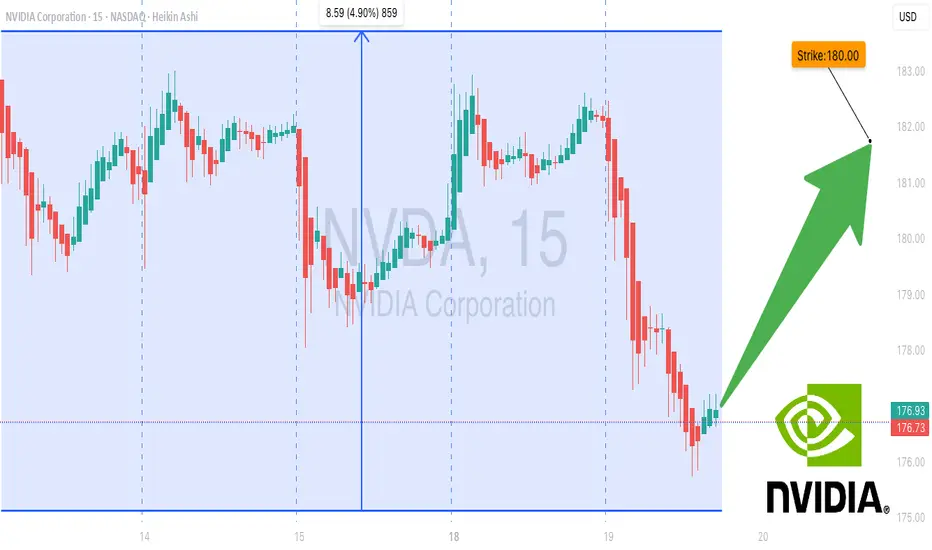
Strong Bullish Flow in NVDA: $180 Calls Primed for Breakout! 🚀 NVDA Weekly Options Bullish Flow – Aug 19, 2025
**Market Sentiment:**
📈 Total calls: **632,689** | Total puts: **334,721**
💥 **Call/Put Ratio: 1.89 → Strong Weekly Bullish Flow**
⚠️ Gamma Risk: Moderate – watch volatility closely.
**Technical Indicators:**
* **Daily RSI:** 63.3 → slight pullback signs
* **Weekly RSI:** 87.2 → 🚀 strong weekly momentum
* **Weekly Volume Ratio:** 0.9x → weak institutional activity, caution advised
**Options Highlights:**
* Key strikes: **\$180** (OI: 65,649), **\$187.50** (liquid and premium-friendly)
* Expiration in **3 days** → time decay accelerating
**Risks to Monitor:**
* Weak weekly volume
* Daily RSI trending down
* Price support at **\$175.90–\$176.00**
**Consensus & Trade Setup:**
* **Overall Bias:** Moderate Bullish
* **Recommended Trade:** **Single-leg Call**
* **Strike:** \$180.00
* **Entry:** \$3.60
* **Stop Loss:** \$1.80
* **Profit Target:** \$6.00–\$7.50 (80%-100% potential)
* **Confidence:** 65%
**Trade JSON Snapshot:**
```json
{
"instrument": "NVDA",
"direction": "call",
"strike": 180.0,
"expiry": "2025-08-22",
"confidence": 0.65,
"profit_target": 6.00,
"stop_loss": 1.80,
"size": 1,
"entry_price": 3.60,
"entry_timing": "open",
"signal_publish_time": "2025-08-19 13:15:57 EDT"
}
NVDA Ready to Break Higher – $187.50 Calls Flashing Opportunity!
# 🚀 NVDA Weekly Options Analysis (2025-08-17) – Don’t Miss Out!
### 🔎 Model Insights Recap
**Grok/xAI Report**
* 📊 RSI: Falling (daily & weekly → potential exhaustion)
* 📈 Call/Put Ratio: **2.00 (Bullish flow)**
* 🔊 Volume: Weak
* ✅ Decision: Moderate bullish → suggested **\$190 Call**
**Gemini/Google Report**
* 📊 RSI: Declining
* 📈 Options Flow: Strong, but weak trend & volume
* 🛑 Decision: **Pass** (low confidence)
**Claude/Anthropic Report**
* 📊 Technical: Overbought with negative divergence
* 🔊 Volume: Flat weekly
* 🛑 Decision: **No trade** (bearish momentum indicators)
**Llama/Meta Report**
* 📊 Bias: Neutral-bullish (options flow positive)
* 🔊 Volume: Weak
* ✅ Decision: **\$187.50 Call** with caution
**DeepSeek Report**
* 📊 Market: Bearish divergence despite bullish flow
* 🔊 Volume: Weak institutional support
* 🛑 Decision: **No trade**
---
### 📌 Key Agreements
✔️ Declining daily & weekly RSI = potential momentum exhaustion
✔️ Strong call/put ratio = bullish sentiment from options traders
✔️ Weak volume = lack of support for sustained upside
### 📌 Key Disagreements
⚖️ Grok/xAI & Llama/Meta → potential bullish calls
⚖️ Gemini/Claude/DeepSeek → caution/pass
⚖️ Bullishness varies depending on options flow vs volume
---
## 📊 Recommended Trade Setup
* **Direction:** CALL (Long)
* **Strike:** \$187.50
* **Expiry:** 2025-08-22
* **Entry Price:** \$0.85
* **Stop Loss:** \$0.34 – \$0.425 (40-50% of premium)
* **Profit Target:** \$1.50 (50-100% return)
* **Entry Timing:** Market Open
* **Confidence:** 65%
---
### ⚠️ Key Risks
* **Momentum Exhaustion:** Falling RSI could signal reversals
* **Weak Institutional Support:** Volume may limit upside
* **Event Risk:** Upcoming earnings may introduce volatility
---
📊 **TRADE DETAILS JSON**
```json
{
"instrument": "NVDA",
"direction": "call",
"strike": 187.50,
"expiry": "2025-08-22",
"confidence": 0.65,
"profit_target": 1.50,
"stop_loss": 0.34,
"size": 1,
"entry_price": 0.85,
"entry_timing": "open",
"signal_publish_time": "2025-08-17 09:26:30 EDT"
}
```

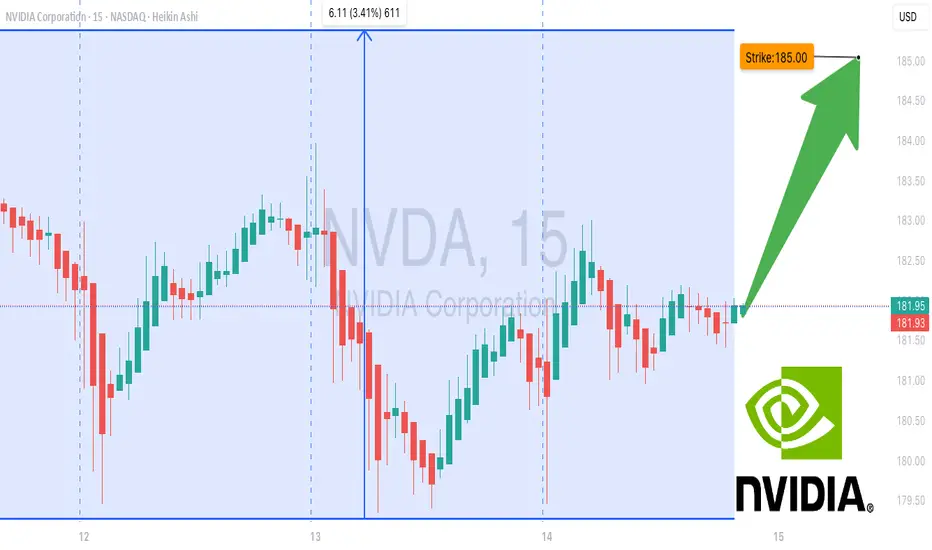
NVDA Gamma Showdown: Will Bulls Break $185 Before Time Runs Out? 🚀 NVDA Gamma Showdown: Will Bulls Break \$185 Before Time Runs Out?
**Sentiment:** ⚖️ *Moderate Bullish, High Risk*
* **Call/Put Ratio:** 1.78 📈
* **Daily RSI:** Mixed → Losing momentum
* **Weekly RSI:** Still bullish
* **Volume:** Weak → Low institutional conviction
* **Gamma Risk:** 🔥 HIGH — expiry in 1 day
* **Time Decay:** Accelerating ⚡
---
### 📊 **Consensus Highlights**
✅ Bullish options flow supports upside potential
⚠️ Weak volume + gamma risk = cautious sizing
💡 Tight stop loss and fast profit-taking advised
---
### 🎯 **Trade Setup**
* **Type:** CALL (Naked)
* **Strike:** \$185.00
* **Expiry:** 2025-08-15
* **Entry:** \$0.62
* **Profit Target:** \$0.86 (+30%)
* **Stop Loss:** \$0.31 (–50%)
* **Confidence:** 65%
* **Entry Timing:** Market open
---
💬 *This is a high-risk, high-reward expiry play — watch it like a hawk.*
📌 *Not financial advice. DYOR.*
---
**#NVDA #OptionsTrading #GammaSqueeze #DayTrading #StocksToWatch #OptionsFlow #TradingSignals #StockMarket**
NVDA don’t Miss Out--$190 Call Target, Momentum on Fire## 🚀 NVDA Weekly Options Breakdown (Aug 11, 2025) 🚀
### 🔥 Market Sentiment: Bullish Bias Across Models
* **Grok/xAI**: Strong Bullish — rising RSI & bullish flow, but *watch weak volume*.
* **Claude/Anthropic**: Moderate Bullish but *no trade* due to policy risks & volume doubts.
* **Gemini/Google**: Moderate Bullish, recommends **\$192.5 calls** with stop loss — volume risk noted.
* **Llama/Meta**: Bullish — buy **\$190 calls**, manage volatility & premium decay.
### ✅ Consensus Trade Setup:
**Buy \$190 Calls** expiring Aug 15 @ \$0.70 premium
* 🎯 Profit Target: \$0.91
* 🛑 Stop Loss: \$0.35
* 📊 Confidence: 70%
* ⏰ Entry: Market Open Next Trading Day
### ⚠️ Key Risks:
* Policy/news impact on semiconductor sector
* Moderate gamma risk & possible volatility spikes near expiry
---
### 🔍 Model Insights Breakdown
| Model | Sentiment | Trade Idea | Confidence |
| ---------------- | ---------------- | ------------------------------ | ---------- |
| Grok/xAI | Strong Bullish | Buy \$190 Calls | 70% |
| Claude/Anthropic | Moderate Bullish | No trade (high news risk) | 45% |
| Gemini/Google | Moderate Bullish | Buy \$192.5 Calls w/ stop loss | 65% |
| Llama/Meta | Bullish | Buy \$190 Calls w/ risk mgmt | 70% |
---
### 💡 Why This Matters
* RSI and options flow point strongly bullish — calls dominate puts 1.2+ ratio
* Volume confirmation weak, so *manage risk tightly*
* Position best for aggressive traders ready to manage fast moves
---
📈 **NVDA Weekly Options Trade Summary**
```json
{
"instrument": "NVDA",
"direction": "call",
"strike": 190.0,
"expiry": "2025-08-15",
"confidence": 0.70,
"profit_target": 0.91,
"stop_loss": 0.35,
"size": 1,
"entry_price": 0.70,
"entry_timing": "open",
"signal_publish_time": "2025-08-11 10:33:48 UTC-04:00"
}
```
NVDA Don’t Miss Out## ⚡ NVDA Swing Setup (2025-08-08) ⚡
**Bias:** 📈 **Moderate Bullish** — RSI hot (67), trend up, low VIX, but volume still meh.
**🎯 Trade Plan**
* **Ticker:** \ NASDAQ:NVDA
* **Type:** CALL (LONG)
* **Strike:** \$185.00
* **Entry:** \$3.15 (near open)
* **Profit Target:** \$4.65 (+48%)
* **Stop Loss:** \$2.13 (-30%)
* **Expiry:** 2025-08-22 (14DTE)
* **Size:** 1 contract
* **Confidence:** 75%
**📊 Key Notes**
* RSI strong = momentum on your side ✅
* VIX favorable for calls ✅
* Weak volume & neutral flow = confirm before adding size ⚠️
* Watch breakout above **\$183.88** for momentum kick
**💡 Play Idea:**
Ride momentum to \$195+, take 50% profits at \$4.65, trail stops to lock gains.

NVDA Don't Miss Out !!!!
**NVDA \$185C Weekly Momentum Surge ⚡ All Models Aligned – 75% Confidence Setup 🔥**
---
### 📊 **Post Body (Optimized for TradingView):**
**NVDA Weekly Call Play — Aug 8 Expiry (3 DTE) 🔥**
📈 **Momentum Snapshot:**
* **Weekly RSI:** 🔼 Above 50 and climbing
* **Daily RSI:** 🔻 Falling — short-term caution
* **Volume:** 1.2x previous week (🟢 Institutional flow)
* **Volatility (VIX):** <22 — favorable setup
* **Gamma Risk:** 🟠 Moderate
---
🧠 **Model Scorecard Summary:**
* **Grok / xAI:** 4/5 Bullish 🟢
* **Gemini (Google):** 3/5 Bullish with 80% confidence 🟢
* **Claude (Anthropic):** 5/5 Bullish 💯
* **LLaMA (Meta):** 4/5 Bullish 💪
* **DeepSeek:** 5/5 Bullish 🚀
✅ **Consensus:** Strong Bullish 🔥
---
### 💡 **Trade Setup:**
* 🎯 **Strategy:** Long CALL
* 🟢 **Strike:** \$185
* 📅 **Expiry:** Aug 8, 2025
* 💵 **Entry Price:** \$0.96
* 📈 **Target Exit:** \$1.90 (100% gain)
* 🛑 **Stop Loss:** \$0.48 (50% risk cap)
* 📏 **Size:** 1 contract
* ⏰ **Timing:** Market Open
* 📊 **Confidence Level:** 75%
---
⚠️ **Key Risks to Watch:**
* Time decay – Only 3 DTE ⏳
* Daily RSI divergence 😬
* Gamma risk & market volatility (track \ TVC:VIX )
---
### 🧾 **Auto-Logger JSON (for tracking):**
```json
{
"instrument": "NVDA",
"direction": "call",
"strike": 185.00,
"expiry": "2025-08-08",
"confidence": 0.75,
"profit_target": 1.90,
"stop_loss": 0.48,
"size": 1,
"entry_price": 0.96,
"entry_timing": "open",
"signal_publish_time": "2025-08-05 09:43:22 UTC-04:00"
}
```
---
### 🏷️ **Suggested Hashtags (TradingView Style):**
`#NVDA #OptionsTrading #WeeklyOptions #CallOptions #MomentumStocks #AIStocks #TechLeaders #TradingSetup #RSISignal #GammaSqueeze #NVIDIA #OptionAlert #HighConviction #TradeIdeas #TechBreakout`
NVDA Bullish Weekly Trade Setup** – 2025-07-29
📈 **NVDA Bullish Weekly Trade Setup** – 2025-07-29
🚀 *"Momentum meets money flow!"*
### 🔍 Market Snapshot:
* 💥 **Call/Put Ratio**: 2.47 → Bullish sentiment confirmed
* 🧠 **RSI**: Rising on Daily & Weekly → Momentum building
* 🔕 **Low VIX**: Favors call strategies (cheap premiums)
* ⚠️ **Caution**: Light volume = soft institutional backing
---
### 🔧 Recommended Options Trade:
**🟢 NVDA \$182.50 CALL (Exp: Aug 1)**
💰 *Entry*: \~\$0.53 (Mid)
📈 *Profit Target*: \$0.69 – \$1.06
🛑 *Stop Loss*: \$0.32
📆 *DTE*: 3 days
🔄 *Entry Timing*: Market Open
✅ *Confidence*: 75%
🔥 *Theta & Gamma Risk*: Elevated — manage position size!
---
### 💡 Why This Trade?
✅ RSI Strength across timeframes
✅ Flow favors upside
✅ Cheap premium in a low-volatility regime
🟡 Just watch that volume…
---
📊 **TRADE SNAPSHOT (JSON):**
```json
{
"instrument": "NVDA",
"direction": "call",
"strike": 182.50,
"expiry": "2025-08-01",
"confidence": 0.75,
"profit_target": 1.06,
"stop_loss": 0.32,
"size": 10,
"entry_price": 0.53,
"entry_timing": "open",
"signal_publish_time": "2025-07-29 11:59:10 UTC-04:00"
}
```
---
📣 **Taglines for Sharing:**
* "NVDA setup is 🔥—momentum + flow = GO!"
* "Gamma risk is real—but so is this profit window 💸"
* "Short-term sprint or fade? This call has range."

NVDA 0DTE TRADE SIGNAL – JULY 25, 2025
⚡ NVDA 0DTE TRADE SIGNAL – JULY 25, 2025 ⚡
🚀 Strong Bullish Momentum – But Friday Expiration = Gamma Trap?
⸻
📊 Market Stats:
• 💰 Call Volume: Strong
• 🔻 Weak Volume Overall
• ⚖️ Call/Put Ratio: Bullish
• 📈 RSI: Overbought but still pushing
• ⏳ Time Decay: Accelerating
• ☠️ Gamma Risk: 🔥 MAX today (0DTE)
⸻
🧠 Model Summary:
• Grok/xAI: 🔒 NO TRADE today – wait for Monday
• Claude: 🛑 Caution – avoid entries today
• DeepSeek: ⏸️ 4/5 Bullish, wait for cleaner setup
• Gemini: 💡 Suggests $180C next week
• Llama: ✅ Bullish bias, but gamma risk = no go for Friday
⸻
📌 TRADE IDEA: Wait for Monday
📍 Strike: $175 Call
📆 Expiry: Today (0DTE)
💵 Entry Price: $0.56
🎯 Target: $0.95
🛑 Stop: $0.30
📈 Confidence: 65%
🕒 Entry Timing: Monday open IF support holds
⸻
⚠️ Key Warning:
Don’t get trapped by 0DTE gamma swings. Momentum says yes, time decay says no…
✅ Best move? Watch NVDA closely, then strike on Monday if volume confirms.
⸻
👍 Like & save if you’re tracking NVDA.
🔁 Repost if you’re waiting for the perfect Monday setup!
#NVDA #OptionsTrading #0DTE #GammaRisk #BullishSetup #TradingView #TechStocks #WeeklyOptions

$NVDA WEEKLY TRADE IDEA – JULY 21, 2025
💥 NASDAQ:NVDA WEEKLY TRADE IDEA – JULY 21, 2025 💥
🔥 Bullish Options Flow + Weekly RSI Strength = Controlled Momentum Play
⸻
📊 Trade Details
🔹 Type: Long Call
🎯 Strike: $180.00
📆 Expiry: July 25, 2025 (4DTE)
💰 Entry: $0.51
🎯 Target: $1.02 (💯% Gain)
🛑 Stop: $0.20 (~40% Risk)
📈 Confidence: 65%
🕰️ Timing: Monday Open
📦 Size: 1 Contract (Adjust based on risk tolerance)
⸻
📈 Why This Trade?
✅ Call/Put Ratio = 1.48 → Bullish bias confirmed
📈 Weekly RSI = 77.0 → Strong momentum
🔻 Daily RSI = 80.8 (falling) → Short-term pullback risk
📉 Volume = flat (1.0x) → Weak confirmation = tighter risk mgmt
🧠 Strike Clustering: $177.50 & $180 = strong OI zones
🌬️ VIX = 16.7 → Favorable for long premium plays
⸻
⚠️ Risks & Strategy Notes
❗ Daily RSI = caution: short-term exhaustion possible
📉 Weak volume = lack of institutional chase
⏳ Exit before Friday – avoid IV crush and gamma slam
🔐 Set alerts at $178.75 and $179.80 – pre-breakout signals
⸻
🎯 Plan:
• Enter Monday open
• Scale partials if price hits +30–50%
• Full exit by Thursday unless price is breaking through $180 early with strong volume
⸻
🏁 Quick Verdict:
This is a momentum continuation setup, not a fresh breakout.
Play the trend, respect RSI signals, and cut fast if flow dries up.
NASDAQ:NVDA 180C — Risk $0.20 to Target $1.02
Let the call ride… just don’t overstay.
⸻
#NVDA #OptionsTrading #CallOption #WeeklyPlay #MomentumTrade #FlowBasedSetup #TradingViewIdeas #GammaPlay #BullishBias #NVIDIA

Fundamental and technical analysis on NVDA (Chicken Nugget) soonFundamental Analysis
NVIDIA Corporation (NVDA) remains a key player in the tech sector, benefiting from the rise of artificial intelligence, data centers, and gaming. With sustained growth, constant innovation, and strong demand for its graphics chips, the company continues to deliver solid financial results.
Recent reports indicate revenue growth and expansion in key markets. Product diversification, particularly in supercomputers and embedded systems, strengthens NVDA’s position against competitors. Investor interest in the semiconductor industry helps maintain the stock’s positive momentum.
Technical Analysis
The chart analysis highlights key technical levels for investors:
- Key Resistance: $150 USD – This level must be broken to confirm a strong bullish trend. A breakout with volume could signal a gradual rise toward higher targets.
- Support Level: $131.50 USD – Strong demand and low supply are identified at this level, making it an excellent entry point for investors looking for buying opportunities before a potential rebound.
Targets & Strategy
- Short-term target (late June/early July): The target range of $170-$175 USD is possible if the bullish trend is confirmed. This level aligns with technical extensions and favorable market dynamics.
- July buyback (-5% to -10%): A moderate correction could occur, offering another buying opportunity before an upward recovery.
- Selling target (September to November): The next selling target is between $200-$240 USD, depending on market developments and investor sentiment.
Conclusion
NVDA stock presents interesting prospects, with well-defined technical levels and a strong fundamental outlook. Investors should monitor these thresholds to adjust their strategy based on market fluctuations.
If you want to refine this analysis or explore other scenarios, I'm here to dive deeper into key points! 🚀 Subscribe! TSXGanG
I hold a CCVM and MNC (Certificate of Competence to become a securities broker anywhere in Canada) and have been working as a trader for five years.
It’s a pleasure for me to help people optimize their trading strategies and make informed financial market decisions.

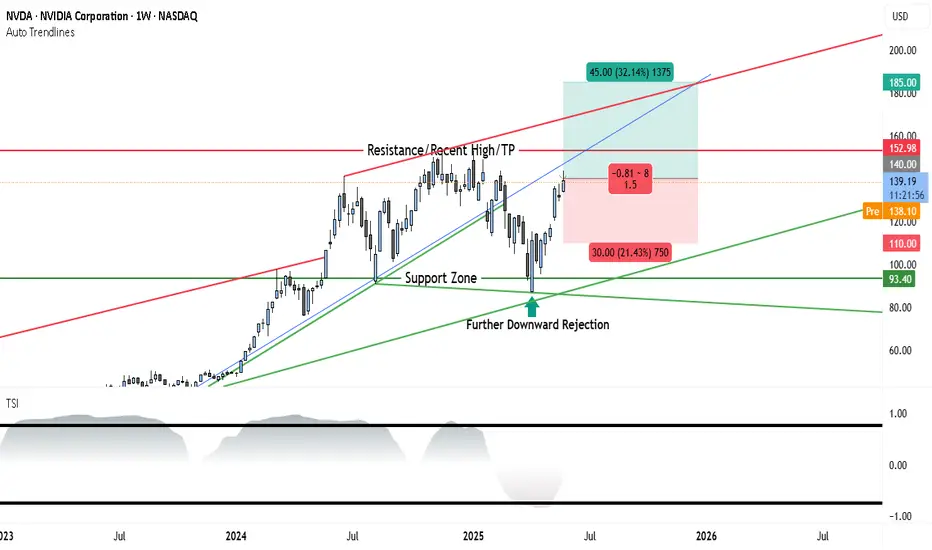
NVIDIA Stock Weekly Outlook: Support Holds Strong as $185 TargetThe weekly chart of NVDA shows a strong continuation pattern forming after a period of consolidation and a healthy pullback. The recent price action confirms a bullish stance, with a fresh bounce off support and momentum gradually shifting in favor of the bulls.
________________________________________
Long-Term Uptrend Confirmed
The blue ascending trendline drawn from early 2023 remains intact, showing that the overall trend is still bullish. NVDA has respected this trendline multiple times, with each touch followed by a renewed upward move. This week, the price rebounded once again near this trendline, confirming its role as dynamic support and signaling renewed buying interest.
________________________________________
Resistance and Breakout Potential
The key resistance level is marked at $152.98, which represents the recent weekly high and a psychological barrier. This level has acted as a ceiling in past attempts, but the current structure and momentum suggest a potential breakout if volume confirms. Above this level, there's clear air up to $185, where the next major resistance sits, and which also acts as the projected target in this trade setup.
________________________________________
Support Holding Strong
A strong support zone around $93.40 is clearly defined and has already triggered multiple rejections. NVDA recently saw a sharp bounce from this zone after a downward rejection, signaling that institutional buyers may be active here. This area is the foundation of the current bullish case.
________________________________________
Momentum Turning Favorably
The True Strength Index (TSI), shown at the bottom of the chart, is emerging from a low region. While not yet fully bullish, the indicator is starting to turn upward, suggesting early signs of momentum building. If TSI crosses above the midline in coming weeks, it could confirm the start of a sustained upward move.
________________________________________
Trade Setup
• Entry Zone: $138 to $140 (current price range)
• Stop-Loss: $110 (beneath the last significant swing low)
• Target: $185 (aligns with the next major resistance and top of risk-reward box)
• Risk-Reward Ratio: Approximately 1.5:1
• Setup Bias: Swing to mid-term bullish continuation
________________________________________
Conclusion
NVIDIA’s weekly chart is aligning in favor of the bulls after a healthy consolidation and support retest. The price remains within a strong uptrend channel, and momentum is gradually improving. A breakout above $152.98 would likely attract more volume and set the stage for a rally toward $185. The risk-reward setup is favorable, making this a strong candidate for bullish swing positioning heading into Q3 2025.
$NVDA: Full on Bull mode. 170 $ before end of Summer Happy Monday. A new week, new trade for you guys. How does the largest AI stock looks like today with US-China Tariff pause for 90 days behave? Today the stock NASDAQ:NVDA broke the 1.0 Upward sloping Fib retracement channel with which we have been working for months now. The stock opened @ 122 % which is the 1.0 Fib retracement level. If we extend the channel and extrapolate then we see the next levels and the resistance levels.
In our Fib Chart here the next level is 1.6 Level which is @ 137 $. In my opinion with RSI at 50 and NASDAQ:NVDA having some high level of short interest. 1.12 % of the float is short which is high going back to 2021 bear market. So, this helps have violent short covering rally in the short term. Bullish before we turn bearish. RSI may top out at 85 in this bull rally phase. This cycle bull r un can take it to 170$ before end of Summer 2025.
Verdict : NASDAQ:NVDA next levels : 135 $ ; cycle top @ 170 $.

NVDA TO $176 BY JUNE THEN $1000 END OF YEARNVDA to $176 by June Then $1000 End of Year: A Bold Thesis
Key Points
It seems likely that NVDA could reach $176 by June 2025, supported by strong AI market trends and upcoming earnings, but reaching $1000 by year-end is highly speculative and controversial.
Research suggests Elliott Wave analysis shows a potential bullish trend, but specific price targets like $1000 lack broad analyst support.
The evidence leans toward significant growth potential due to NVDA's leadership in AI and new product launches, yet such aggressive targets involve high uncertainty.
Current Price and Market Context
As of April 9, 2025, NVDA's closing price on April 8 was $96.30, with pre-market trading at $98.22. This reflects recent volatility, with a 52-week range from $75.61 to $153.13. The stock's performance is tied to its dominance in AI and GPU markets, which are experiencing robust growth.
Analysis for $176 by June
Reaching $176 by June 2025, an 83% increase from $96.30, is ambitious but plausible. Upcoming earnings on May 28, 2025, estimate an EPS of $0.93 and revenue of $43.34 billion, with potential beats driving price surges. Elliott Wave analysis suggests NVDA may be completing a corrective phase, with a falling wedge pattern indicating a possible upward breakout, supporting short-term targets around $176.
Analysis for $1000 by Year-End
The prediction of $1000 by December 2025, a 940% increase, is highly speculative. While some analyses, like a Forbes article, suggest NVDA could see a tenfold rise by 2026 due to the Blackwell architecture, most analyst targets range from $170 to $235. This target lacks broad support and involves significant market and fundamental risks.
Unexpected Detail: Stock Split Impact
An unexpected factor is NVDA's 10-for-1 stock split in June 2024, adjusting prices from over $1,000 to current levels, making historical comparisons complex. This split aligns the $1000 target with post-split valuations, but achieving it requires unprecedented growth.
Survey Note: Detailed Analysis of NVDA's Potential Price Surge to $176 by June and $1000 by Year-End
Introduction
NVIDIA Corporation (NVDA), a leader in graphics processing units (GPUs) and artificial intelligence (AI), is currently trading at approximately $96.30 as of April 9, 2025, based on the closing price from April 8, with pre-market activity showing a slight uptick to $98.22. This analysis explores the feasibility of NVDA reaching $176 by June 2025 and an ambitious $1000 by the end of the year, leveraging Elliott Wave theory and other validated analytical methods. Given the stock's recent performance and market context, we examine technical patterns, fundamental catalysts, and long-term growth potential.
Current Market Position and Historical Context
NVDA's stock has shown volatility, with a 52-week range from $75.61 to $153.13, and a year-to-date change of -11.36% over the past week and -12.23% over the past month, per recent data. The all-time high was $153.13 on January 6, 2025, indicating significant upside potential from current levels. The market capitalization stands at $2.35 trillion, with a beta of 2.40, reflecting high volatility. Key financial metrics include an EBITDA of $83.32 billion and an EBITDA margin of 63.85%, underscoring strong profitability.
A critical context is the 10-for-1 stock split in June 2024, which adjusted share prices from over $1,000 to current levels, making historical comparisons complex. This split, detailed in a CNBC article (Nvidia announces 10-for-1 stock split), was aimed at making ownership more accessible, aligning with the user's post-split price targets of $176 and $1000.
Metric Value
Closing Price (Apr 8) $96.30 USD
Pre-Market Price (Apr 9) $98.22 USD
52-Week Range $75.61 - $153.13 USD
Market Cap $2.35T USD
Beta (1Y) 2.40
Earnings Next Report May 28, 2025, EPS Estimate $0.93, Revenue Estimate $43.34B USD
Last Quarter EPS $0.89 (estimated $0.85, +4.96% surprise)
Dividend Yield (TTM) 0.04%
Elliott Wave Analysis: Technical Insights
Elliott Wave theory, a method identifying market psychology through wave patterns, suggests NVDA may be in a corrective phase, potentially completing wave (4) of a larger five-wave structure. Recent analyses, such as those on TradingView (NVIDIA Stock Chart), indicate a falling wedge or ending diagonal formation, often signaling a reversal and start of an upward trend. This could support a move to $176 by June, as wave (5) projections often extend to 1.618 times wave (1), potentially aligning with such targets.
Specific Elliott Wave analyses, like those from ElliottWave-Forecast (Elliott Wave Expects New All Time High), suggest NVDA has completed corrections and is resuming higher, with wave counts indicating impulsive rallies. However, these analyses lack explicit price targets reaching $1000, focusing more on trend continuations.
Short-Term Target: $176 by June 2025
Reaching $176 by June 2025, an 83% increase from $96.30, is ambitious but supported by several factors. The earnings report on May 28, 2025, is a critical catalyst, with estimates for EPS at $0.93 and revenue at $43.34 billion. Given NVDA's history of beating estimates, as seen in the last quarter with EPS of $0.89 against an estimate of $0.85, a strong report could drive significant price appreciation.
Technical indicators, such as a breakout from the falling wedge, align with this target. Analyst price targets, ranging from $125 to $220 with an average of $177.19 per Zacks (NVIDIA Price Target), also support the possibility, with some forecasts reaching $235.92 (NVDA Forecast). However, achieving this in two months requires sustained bullish momentum and favorable market conditions.
Long-Term Target: $1000 by Year-End 2025
The prediction of $1000 by December 2025, a 940% increase from current levels, is highly speculative. Most analyst forecasts, such as those from MarketBeat (NVIDIA Stock Forecast) and TipRanks (Nvidia Stock Forecast), range from $170 to $235, far below $1000. However, a Forbes article from May 25, 2024 (Nvidia Stock Tops $1,000), suggests NVDA could see a tenfold rise by 2026 due to the Blackwell architecture, potentially supporting a $1000 target by late 2025 if growth accelerates.
Blackwell, a new GPU architecture, is expected to enhance NVDA's AI and data center offerings, potentially driving revenue growth. CoinCodex forecasts a high of $260.32 by December 2025 (NVIDIA Stock Forecast), still below $1000, indicating the target is outlier and involves significant risk. Market volatility, competition, and macroeconomic factors, such as tariff impacts noted in CNN reports (NVDA Stock Quote), add uncertainty.
Fundamental Catalysts and Risks
NVDA's fundamentals are strong, with consistent revenue growth and high EBITDA margins. The company's expansion into AI, autonomous systems, and supercomputers, as noted in LiteFinance (Nvidia Stock Price Prediction), supports long-term growth. However, short-term corrections due to overvaluation or market sentiment, especially around tariff concerns, pose risks.
X posts, such as one from @1000xStocks (X post), highlight NVDA's EPS growth reflecting AI monetization, suggesting bullish sentiment, but lack specific $1000 targets. Another from @ravisRealm (X post) notes adding positions at lower prices, indicating confidence but not supporting the $1000 target.
Conclusion
While reaching $176 by June 2025 is plausible with strong earnings and technical breakouts, the $1000 target by year-end is highly speculative, lacking broad analyst support and requiring unprecedented growth. Investors should monitor earnings reports, product launches like Blackwell, and market trends, while employing risk management strategies given the high uncertainty.

Nvidia (NVDA) Bullish Opportunity – GTC 2025 & AI GrowthCurrent Price: $121.67
✅ TP1: $130 – (short-term resistance, +7%)
✅ TP2: $145 – (medium-term breakout target, +19%)
✅ TP3: $175 – (analyst target, +43%)
🔥 Why Bullish?
1️⃣ GTC 2025 Conference (March 17-21)
CEO Jensen Huang’s Keynote (March 18) is expected to unveil:
Blackwell Ultra (B300 series): Next-gen AI GPU with 288GB memory.
Rubin GPU Preview: NVIDIA’s roadmap beyond 2026.
Quantum Day (March 20): NVIDIA’s first quantum event, showcasing its role in quantum simulation despite earlier skepticism—potentially broadening its tech leadership.
Market Sentiment: High anticipation for AI & chip updates, with some seeing 30%-50% upside if AI demand is reaffirmed (e.g., new contracts, backlog growth).
2️⃣ Analyst Ratings & Price Targets
Strong Buy Consensus from analysts.
Average 12-Month Price Target: $174.79 → +43.59% upside.
Price Target Range: $120 (low) to $220 (high).
3️⃣ Technical Setup – Breakout Potential
Falling Channel Formation – Price is bouncing from strong support (~$115).
MACD Bullish Crossover – Momentum is shifting in favor of buyers.
Breakout Level: Above $130 would trigger stronger upside.

Nvidia’s Sharp Decline: Market Turbulence or Buy Opportunity?Nvidia ( NASDAQ:NVDA ) shares took a steep dive on Monday, falling nearly 9% after former President Donald Trump confirmed that tariffs on imports from Canada and Mexico will take effect on Tuesday. This sharp drop contributed to broader market weakness, with the Dow tumbling 800 points (-1.8%) and the Nasdaq Composite sliding over 3%.
Despite Nvidia’s recent earnings beat, its stock has fallen over 13% since last Wednesday, erasing its $3 trillion market cap and bringing its valuation down to $2.79 trillion. However, Tuesday’s trading session saw a notable rebound, with NASDAQ:NVDA gaining 3% as buying pressure returned. Given the technical setup and macroeconomic factors at play, is Nvidia poised for a comeback?
Tariff Fears and Supply Chain Scrutiny
Nvidia’s revenue surged 78% year-over-year to $39.33 billion in its latest earnings report, surpassing analysts’ expectations. However, investor sentiment remains cautious due to the uncertainty surrounding new trade tariffs.
Trump’s 25% tariff on imports from Mexico and Canada could impact Nvidia’s supply chain. While most of Nvidia’s chips are manufactured in Taiwan, other high-end components and full computing systems are assembled in Mexico and the U.S., making them subject to the new duties.
Technical Analysis
Despite Monday’s sharp sell-off, Tuesday’s market session saw a 4% bounce, signaling potential recovery. Key technical indicators suggest a possible shift in momentum. Nvidia’s relative strength index (RSI) has dipped close to oversold territory, suggesting the stock may be due for a reversal. NASDAQ:NVDA is trading at levels last seen in September, a historically strong support area that could trigger buying interest.
With traders digesting tariff implications and market conditions stabilizing, Nvidia could see a short-term bounce if momentum continues.

NVDA to 151? Morning Trading Fam
Currently this is what I am seeing with NVDA, looks like we have decent support around 118 if that level holds I can see us driving up to 144 then 151 from here. However if we break through the 118 support: we could possibly see a massive breakdown down to 87-88 dollar range.
Kris/ Mindbloome Exchange
Trade Smarter Live Better

NVDA : Good shopping pointshello friends
We have analyzed these stocks for you in a very simple way. In the long term...
We have identified good shopping points where you can shop.
Note that the price is at the ceiling of the channel and it is not logical to buy at the ceiling of the channel, so either we buy in case of correction or if the channel is broken and its failure is valid, we can buy.
*Trade safely with us*

Nvidia = 4T Market CapNASDAQ:NVDA : Largest Market Cap in the World?!
4 Trillion Market Cap Inbound 🎯
Ever since Nvidia flipped to green on the H5 indicator we have come back to retest it 5 times. In which we bounced and then rallied hard!
Support created and NASDAQ:NVDA is breaking out!
Not financial advice
