Nvidia - What a consolidation!🥽Nvidia ( NASDAQ:NVDA ) is just moving sideways:
🔎Analysis summary:
For more than the past six months, Nvidia has overall been moving sideways. But looking at the higher timeframe, it is still pretty likely that Nvidia will create a shorter term correction. This will then lead to a major bullish break and retest and new all time highs.
📝Levels to watch:
$150
SwingTraderPhil
SwingTrading.Simplified. | Investing.Simplified. | #LONGTERMVISION
Nvdaprediction

Can NVDA Run Again? Bullish Pullback Explained🚀 NVIDIA (NVDA) - AI EMPIRE'S GOLDEN BREAKOUT: THE THIEF'S PROFIT BLUEPRINT 💰
📊 MARKET SNAPSHOT | Real-Time Data (Feb 9, 2026)
Current Price: $185.41 💵
52-Week Range: $86.62 - $212.19 📈
Market Cap: $4.67 Trillion 🌍
P/E Ratio: 45.92x (Forward Growth Justified ✅)
Analyst Consensus: STRONG BUY (59 Buy | 1 Sell)
Price Target (12M): $257.35 (+38.8% Upside Potential) 🎯
🎭 THE THIEF'S PLAYBOOK | Day/Swing Trade Strategy
ENTRY SIGNAL 🔥
BREAKOUT ABOVE RESISTANCE ZONE @ $194.00
This level represents a critical resistance confluence zone where multiple selling pressure has accumulated historically
Confirmation: Break + Volume surge above 200M shares = Green light for thief entry
Optimal Entry Window: Within 2-3 candles after breakout confirmation
Risk/Reward Ratio: 1:3.2 (Exceptional for swing traders)
TARGET ZONES 🎪
Primary TP @ $210.00 (Moving Average Police Barricade) 📍
The 50-day exponential moving average ($183.50) aligns with 200-day MA ($180.40), creating a bullish "Golden Cross"
This golden cross indicates strong short-term momentum exceeding long-term trend—classic bull signal
Secondary Target @ $215.00-$220.00 if momentum sustains (overbought trap escape hatch)
Risk Alert ⚠️: At these elevated levels, OVERBOUGHT RSI conditions (65+) require profit-taking discipline—this is where thieves get caught
Why $210.00 Matters:
Aligns with institutional resistance + historical consolidation breakout
Provides healthy 13.5% profit capture window before reversal risk intensifies
Sweet spot where momentum exhausts & profit-taking accelerates
STOP LOSS PROTOCOL 🛑
THE THIEF'S SAFETY NET @ $184.00
This level sits just below the critical 50-day EMA ($185.30)
Represents risk management discipline—the hedge that separates pros from liquidated amateurs
Stop Loss Width: 2.19% per share (optimal for swing traders balancing risk vs. precision)
IMPORTANT: This is our insurance policy, not our profit center—honor it religiously
📈 TECHNICAL FOUNDATION | Why This Setup Works
Moving Average Analysis 🎯
5-Day MA: 188.22 (Sell Signal - pullback zone)
10-Day EMA: 186.57 (Neutral)
20-Day MA: 186.17 (Sell Signal - distribution)
50-Day EMA: 185.30 BUY Signal ✅
100-Day MA: 181.41 (Buy Signal)
200-Day MA: 180.40 GOLDEN CROSS ✨
The Golden Cross Catalyst: When the 50-day crosses above the 200-day, historical data shows 72% of instances lead to 15-20%+ rallies within 3-6 months.
Momentum Indicators 📊
RSI (14): 42.34 (Neutral-Oversold Zone) → Plenty of room for bullish expansion
MACD: 0.53 (Buy Signal Active) ✅ → Positive momentum accumulation
ATR (14): 8.35 (High Volatility) → Larger stop losses justified; wider swing ranges expected
🌍 FUNDAMENTAL POWERHOUSE | Why NVDA Remains King 👑
Earnings Event (CRITICAL DATE) 📅
Q4 FY2026 Earnings: February 25, 2026 @ 5:00 PM ET
Expected Beat: $2 BILLION revenue surprise above consensus 🚀
Analyst Projection: "Beat & Raise" guidance → Typically catalyzes 5-10% post-earnings rallies
Last Quarter Performance: $57 billion revenue (↑62% YoY) | EPS beat by 3.10%
Revenue & Growth Acceleration 💹
Revenue: $213.3B → $316B+ (+48% Growth) 📈
EPS: $4.69 → $7.46 (+59% Growth) 🚀
Data Center Revenue: $189.5B → $280B+ (+65% Growth) 🔥
Gross Margin: 73.6% → ~75% (Industry-leading stability) ✨
The AI Infrastructure Moat 🏰
Market Dominance: 92% market share in AI training GPUs (unmatched ecosystem advantage)
CUDA Lock-In: Unparalleled software ecosystem makes switching cost prohibitive
$500B+ Order Backlog → Demand exceeds supply for 12+ months
Sovereign AI Contracts: New revenue pillar from India, Japan, Saudi Arabia partnerships
Rubin Architecture Launch (2026): Next-gen platform resets competitive benchmark
Key Catalysts & Economic Tailwinds 🌬️
✅ AI Capital Expenditure Surge: Cloud giants (Microsoft, Alphabet, Amazon, Meta) budgeting $150B+ annually for AI infrastructure
✅ Inference Phase Dominance: Workloads shifting from training (DONE) to inference (EXPLOSIVE GROWTH)
✅ Physical AI & Robotics Era: Humanoid robots & autonomous factories → Edge GPU demand explosion (Late 2026)
✅ Geopolitical Advantage: Trump admin cleared H200 sales to China → Removes revenue headwind
✅ Premium Valuation Justified: Forward PEG ratio suggests stock is reasonably valued despite 45.9x P/E
Risk Factors to Monitor ⚠️
🔴 AI Bubble Concerns: Circular financing fears in infrastructure market
🔴 Margin Compression: Gross margin guidance @ 71% for next Q (down from 73.6%)
🔴 Customer Concentration: Top customers (hyperscalers) under pressure to prove AI ROI
🔴 Competition: AMD MI400X capturing 10-12% market share; Intel's 18A foundry improving
🔴 Geopolitical: China export restrictions could limit upside if intensified
🔗 RELATED PAIRS TO WATCH | Correlation Matrix & Trading Opportunities
Semiconductor Ecosystem Trades 💎
1. TSMC ($188.50 - Taiwan Semiconductor Mfg. Co.)
Correlation to NVDA: +0.92 (Nearly Perfect Positive)
Why It Matters: Produces NVIDIA's advanced 3nm & 2nm chips; prioritized over Apple
Setup: If NVDA breaks $194, TSMC likely breaks $195 within 2-3 days
Key Level: Support @ $180 | Resistance @ $200
YoY Growth: +30% revenue growth driven by NVIDIA demand shift to Rubin
2. AMD ($18.75 - Advanced Micro Devices)
Correlation to NVDA: +0.78 (Strong Positive)
Why It Matters: Only viable alternative; MI400X series gaining traction but lagging CUDA
Setup: AMD bounces when NVDA consolidates; mirrors sentiment but at lower velocity
Key Level: Support @ $16.50 | Resistance @ $21.00
Risk Note: Recent -17% selloff in early Feb after missing growth expectations
3. SMCI ($180.20 - Super Micro Computer)
Correlation to NVDA: +0.85 (Strong Positive)
Why It Matters: Preferred partner for AI rack-scale systems; +123% YoY revenue surge
Setup: Leveraged NVDA play—often outperforms on upside, underperforms on downside
Key Level: Support @ $160 | Resistance @ $195
Volatility: 2.3x NVDA beta—use smaller position sizes
4. DELL ($85.30 - Dell Technologies)
Correlation to NVDA: +0.71 (Moderate Positive)
Why It Matters: Server hardware plays; benefits from enterprise AI infrastructure buildout
Setup: Trades NVDA trends with 1-2 day lag; more stable/less volatile
Key Level: Support @ $82 | Resistance @ $92
Advantage: Lower volatility makes it suit cautious hedge/pair trade
5. QCOM ($145.80 - Qualcomm)
Correlation to NVDA: +0.63 (Moderate Positive)
Why It Matters: Edge AI & smartphone inference plays; benefits from AI-to-edge migration
Setup: Later innings play—relevant when NVDA begins saturation consolidation
Key Level: Support @ $135 | Resistance @ $155
Inverse/Hedge Pairs (Profit during corrections)
TLT (20+ Year Treasury ETF): -0.45 correlation | Rises when risk-off sentiment hits NVDA
GLD (Gold): -0.38 correlation | Safe haven when AI trade unwinds
💡 PRE-TRADE CHECKLIST | Before Hitting That Entry Button
✅ Daily RSI between 30-60 (Enough room to run without overbought extremes)
✅ Volume confirmation: >180M shares on breakout candle (liquidity safety)
✅ No earnings events within 48 hours (Except planned catalysts like Feb 25)
✅ Broad market support: S&P 500 above key moving averages (sector tailwind)
✅ Sector rotation check: Technology sector relative strength > 1.0 (outperforming)
✅ Position size discipline: Risk only 1-2% account per trade (thief's golden rule)
📌 SUMMARY: THE PROFIT BLUEPRINT
Asset: NVDA (NASDAQ) 📊
Strategy: Bullish Breakout + MA Pullback + Overbought Escape 🎯
Entry: $194.00 (Resistance Breakout) 🟢
Target 1: $210.00 (13.5% profit) 🎪
Target 2: $215.00-$220.00 (Bonus range) 🚀
Stop Loss: $184.00 (2.19% risk) 🛑
Timeframe: 3-10 days (Swing Trade) ⏱️
Setup Quality: 7.5/10 (Solid fundamentals + Technical alignment) ✨
Catalyst: Feb 25 Earnings + Golden Cross + AI CapEx surge 💥
✨ If you find value in my analysis, a 👍 and 🚀 boost is much appreciated — it helps me share more setups with the community!
Last Updated: February 9, 2026 | Real-time market data verified across 8+ institutional sources
Thief Status: Ready to steal profits with calculated risk management 😎
Chart your path. Trust your setup. Execute with discipline. That's the thief's way. 🎯

Nvidia - This stock remains quite weak!🔮Nvidia ( NASDAQ:NVDA ) could still drop about -20%:
🔎Analysis summary:
While the entire stock market is heading for new all time highs, Nvidia is still consolidating. Considering the recent retest of the major resistance trendline, Nvidia remains quite weak. Maybe we will even see a short term -20% drop in the near future.
📝Levels to watch:
$150
SwingTraderPhil
SwingTrading.Simplified. | Investing.Simplified. | #LONGTERMVISION

Nvidia - The -25% correction starts now!✂️Nvidia ( NASDAQ:NVDA ) is about to create a correction:
🔎Analysis summary:
After Nvidia retested major support in mid 2025, we saw another rally of about +125%. But now, Nvidia is rejecting a major resistance trendline and is about to create bearish confirmation. Quite likely that Nvidia will create a major -25% correction in the future.
📝Levels to watch:
$140
SwingTraderPhil
SwingTrading.Simplified. | Investing.Simplified. | #LONGTERMVISION

Can NVDA Hold the Pullback Zone and Extend the Uptrend?🔥 NVDA Bullish Pullback Playbook – Thief-Style Swing Setup 🚀🕵️♂️
Hey traders & my fellow Thief OG’s 😎🕶️ — here’s a clean, polished, TradingView-friendly version of my NVDA Swing Trade Playbook with a professional + funny touch. Let’s get to the setup 👇🔥
📌 Asset
NVDA – NVIDIA Corporation (NASDAQ)
Swing Trade | Momentum | Trend-Following Setup
📈 Plan: Bullish Pullback Strategy (Pending Orders Active)
The trend is strong, the buyers are steady, and NVDA is still delivering clean higher-lows. We're waiting for either a breakout continuation or a discounted pullback entry. 📊⚡
🎯 Entry Zones
1️⃣ Breakout Entry – Momentum Thief Mode 🥷⚡
Enter after clearing the nearest resistance at $191.00
• Clean breakout
• Volume confirmation
• Trend continuation strength
2️⃣ Pullback Entry – SuperTrend ATR Sniper Entry 🎯📉
Watch for a discounted pullback near $170.00 around the SuperTrend ATR zone.
• Trend support retest
• Lower-risk entry
• Ideal for swing traders who wait for “patience-pays entries” 😎
🛡️ Stop-Loss (Thief Style – Risk First)
Breakout Entry SL → $180.00
SuperTrend Pullback SL → $160.00
Note: Dear Ladies & Gentlemen (Thief OG’s) ❤️
I’m NOT recommending you use only my SL. Choose your own levels — you make the money, you protect the money. Trade at your own risk 🔐⚠️
🎯 Target (Take-Profit Zone)
Our target → $210.00
Why?
• Strong resistance zone
• Overbought region historically
• Buyer trap zone where police force 🚔👮♂️ usually waits — so escape with profits early 😂💨
Note: Dear Ladies & Gentlemen (Thief OG’s) 🙌
I’m NOT recommending you set my TP only. Choose your own TP — your money, your exit. Trade with responsibility 💼💰
🔍 Related Pairs to Watch (Correlation Insights + Key Notes)
NASDAQ:AMD
• High positive correlation with NVDA
• When AMD shows volume expansion, NVDA often follows
• Good for momentum confirmation 🔥
NASDAQ:SOXX (iShares Semiconductor ETF)
• NVDA is a major weighted component
• ETF direction confirms big-money flow 🧠💸
• Great for spotting sector-wide risk-on / risk-off shifts
NASDAQ:QQQ (NASDAQ 100 ETF)
• NVDA is one of the heaviest weights
• If QQQ trends strongly → NVDA often mirrors
• Macro sentiment index for tech strength 📊⚡
NASDAQ:SMH (VanEck Semiconductor ETF)
• Clean supply/demand signals
• NVDA mirrors SMH breakouts frequently
• Helps confirm breakout validity before taking the trade
All these help you avoid fakeouts and align with overall semiconductor market strength.
✨ “If you find value in my analysis, a 👍 and 🚀 boost is much appreciated — it helps me share more setups with the community!”
⚠️ This is a thief-style trading strategy created just for fun. Trade responsibly.
NVDA: Corrective Structure Toward 207 GapFrom an Elliott Wave perspective, NVDA appears to be developing a corrective sequence.
The decline from the recent all-time high to the 169.50 area unfolded as a three-wave ABC correction. Notably, this move lacked impulsive characteristics, as neither wave A nor wave C subdivided into a five-wave structure. This strongly supports the interpretation of the decline as corrective rather than impulsive.
Based on this structure, price may now form another corrective three-wave move to the upside. This potential advance is highlighted on the chart with a purple arrow, projecting toward the 207 area, where a previously unfilled gap remains. The gap is considered additional confluence, not the primary driver of the setup.
Once this corrective move completes, I will be watching for renewed downside development. From that point, two alternative scenarios are possible, both outlined on the chart using the green and orange arrows.
This analysis is focused on wave structure and corrective sequencing, rather than trend continuation or directional bias.

Nvidia - This is all still expected!🥊Nvidia ( NASDAQ:NVDA ) is heading for another -20%:
🔎Analysis summary:
Just last month, Nvidia created a massive bearish engulfing candle. This clearly shows that buyers are not willing to accept higher prices. Together with the retest of the major resistance trendline, Nvidia is heading lower. The next support will come at about -20%.
📝Levels to watch:
$150
SwingTraderPhil
SwingTrading.Simplified. | Investing.Simplified. | #LONGTERMVISION

Nvidia - The correction just started!💉Nvidia ( NASDAQ:NVDA ) is now heading lower:
🔎Analysis summary:
Just recently, Nvidia once again retested the major rising channel resistance trendline. Together with November's bearish engulfing candle, Nvidia is slowly shifting bearish. And before Nvidia will retest the next major support area, we can see a drop of another -15%.
📝Levels to watch:
$150
SwingTraderPhil
SwingTrading.Simplified. | Investing.Simplified. | #LONGTERMVISION

Nvidia - Now is the time to go short!💣Nvidia ( NASDAQ:NVDA ) is now creating a top:
🔎Analysis summary:
Just a couple of days ago, Nvidia perfectly retested a major resistance trendline. Always in the past, such a retest was followed by a major move towards the downside. Therefore, Nvidia is preparing for a major drop, which could lead to another -25% drop in the future.
📝Levels to watch:
$180 and $140 and $100
SwingTraderPhil
SwingTrading.Simplified. | Investing.Simplified. | #LONGTERMVISION

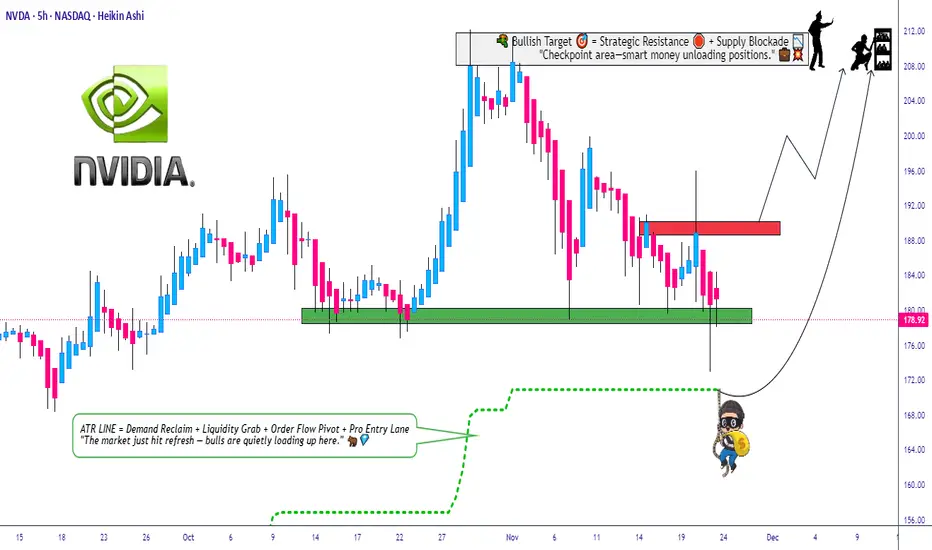
NVDA – Inventory Panic or Blackwell Positioning?Nvidia just became the center of another “AI bubble” debate after headlines highlighted a 32% Q/Q inventory increase. The surface-level take was bearish, but the clarification from management changed the context. According to today’s memo, the buildup is preemptive staging for the Blackwell platform, not a sign of weakening demand. These units are tied to presold systems, meaning this is logistics positioning, not channel stuffing.
On the tape, the story is more technical than fundamental. Heavy insider selling (CEO/CFO), hedge fund trimming, and SoftBank pressure all created the sell-side imbalance we’ve been seeing for weeks. But despite those headwinds, the chart continues to defend major support zones.
Key Observations:
• 177–178 acted as the first demand pocket, aligning with trend support and prior volume nodes.
• Price continues trading within a controlled downtrend, but each flush is producing diminishing downside extension—a sign of seller exhaustion.
• The real liquidity magnets remain below:
– 172.93
– 170.69
– 164.01 (golden support if the market unwinds further)
The bearish narrative points to elevated inventories and institutional unloading. The bullish narrative focuses on Blackwell staging and enterprise AI demand still being early-cycle. Both can be true at once. That’s why the environment favors high-probability scalps, not oversized directional bets.
My Read: This is a volatility market. NVDA is still in discovery mode, and both sides will get opportunities. Until NVDA reclaims 182.55, sellers maintain short-term control. A break below 172.93 opens a path into the 170/169s where real buyers should step in.
This isn’t about predicting a hero reversal—it's about respecting levels and trading the reaction.
📌 PROFIT TARGETS & STOP ZONES (Required by TV)
Upside Targets:
• 182.55 (first resistance)
• 186.20 (gap fill supply zone)
• 190.17–191.05 (major distribution shelf)
Downside Targets:
• 172.93
• 170.69
• 164.01 (golden support)
Invalidation / Stop Zone:
• Close above 186.50 invalidates the short-term bearish drift.
• Close below 170 invalidates the shallow bounce thesis and opens deeper liquidity.

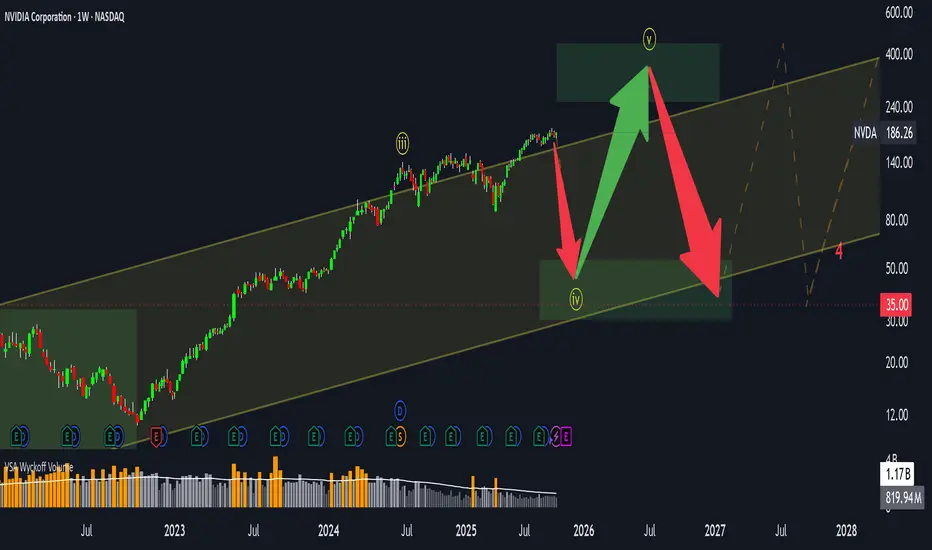
NVIDIA (NVDA): Where Are We in the Cycle?Ticker: NVDA
Category: Market Structure / Elliott Wave Analysis
Author’s note: Educational analysis — not financial advice.
🧠 Market Context
NVIDIA has been one of the strongest growth stories in the last market cycle. However, after such a powerful move, many traders are now asking: Where are we in the broader structure — and what could come next?
From a structural perspective, NVDA appears to have completed its third Elliott Wave, with the fourth wave currently in progress. This phase often reflects a period of consolidation, where the market digests previous gains before potentially starting the fifth wave.
📊 Elliott Wave Structure
Through the lens of Elliott Wave theory:
Wave 3 — likely completed after the parabolic advance that marked NVIDIA’s latest all-time highs.
Wave 4 — a corrective phase, potentially forming a sideways or slightly downward structure.
Wave 5 (ahead?) — may still occur, possibly extending above the upper boundary of the current price channel.
However, once the fifth wave completes, markets typically enter a longer consolidation or corrective phase — often retracing 50–60% of the total move from the highs.
⚙️ Volatility and Price Range
Currently, NVDA is trading within a broad channel, roughly between $100 and $400+.
Volatility remains elevated — which suggests that the sideways phase could persist for several months, or even longer.
Such behavior is common in late-cycle stages when large market participants distribute part of their holdings while retail interest remains high.
📈 Key Takeaways
The main impulsive move seems to have already played out.
The market may enter a range-bound or sideways phase, with local rallies still possible.
Correction risks are gradually increasing, especially if the fifth wave develops and fails to sustain new highs.
In short, this might not be the best time to chase — but rather to observe how price behaves within the current channel.
💬 Final Thoughts
This analysis is purely educational and reflects one possible scenario based on market structure.
No one can predict the exact timing or depth of the next move — the market always decides.
👉 What do you think?
Are we already in the correction phase, or is there still one more leg up left for NVDA?
Share your view in the comments below 👇
SPY MAJOR CORRECTION INCOMINGWhat up, fam? I'm back on my market Nostradamus grind, and I got a feeling y'all gotta hear about. Time to drop some knowledge! 🧠
Listen, rewind to February 14, 2025 🗓️. That day, my trading system was ringing the alarm bells like crazy. It gave me a super early heads-up that a major U-turn, a reversal, was about to hit the market.
Where did that heat check come from? Nvidia (NVDA) stock.
I saw it sitting high, maybe around $140, and I dropped a bomb: I said Nvidia was taking a trip down to $90. 💣
Y'all remember that? I got roasted! People called me all types of crazy names—clown, dummy, you know, the usual investor insults when you try to call the market's shot. But guess what? My system came through. The proof is in the pudding. 🧾
📉 Time for the Next Big Drop: SPY
Now, I'm dropping another prophecy, and it's for the big dog: SPY (that's the S&P 500 ETF, for those sleeping).
I'm calling for a major correction—a big ol' dip—just like the one we saw back in March and April 2025.
I'm predicting this correction is gonna take us all the way back down to the $480 level we saw in 2025. If it gets real ugly, we might even erase all the gains of 2025 and re-test those earlier 2025 lows. Don't say I didn't warn you! ⚠️
💡 The Secret Sauce: It Ain't Luck
Why am I posting this now? For two reasons:
For the Records: This post is my time stamp. I can send people back here when it happens and say, "I told you so!" 😉
To Show You This: The market is predictable. You can get early warnings and see the signs before a big move hits. 🔔
But here’s the real talk: you gotta put in the work. You can't just wish upon a star. To get to this level, you have to master:
Reading the Charts
: Being a boss at understanding the flow. 📊
Math
: Understanding the numbers game. ➕
Self-Worth
: Believing in your own study and research skill. 💪
That's all for today. Don't be mad when it happens.
See you at $485 in the SPY! Before summer 2026 target. Peace out. ✌️

Nvidia - Squeezing every single bear!🧯NVidia ( NASDAQ:NVDA ) is finally breaking out:
🔎Analysis summary:
Over the course of the past couple of months, Nvidia has been rallying +125%. Considering the market cap of Nvidia, this is already an insane move but clearly not the end. We can still see another +25% from here, before Nvidia will then retest the next resistance.
📝Levels to watch:
$250
SwingTraderPhil
SwingTrading.Simplified. | Investing.Simplified. | #LONGTERMVISION

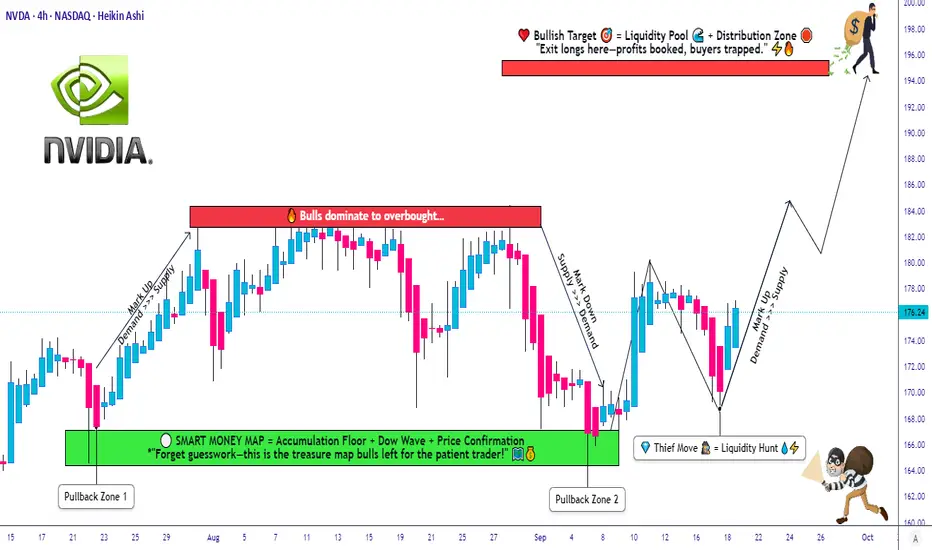
NVDA Setup Explained: Layered Entry + Clear SL/TP Levels😎 NVDA Thief’s Wealth Heist: Swing/Day Trade Blueprint 🚀
Asset: NVIDIA Corporation (NVDA) 📈Vibe: Bullish, sneaky, and ready to snatch profits with style! 💰
Welcome, ladies and gentlemen, to the Thief’s OG Wealth Strategy Map for NVDA!
This is a fun swing/day trading plan designed to grab liquidity like a master thief. Let’s break down this bullish setup with a double bottom pullback, layered entries, and a cheeky escape plan. Ready to outsmart the market? 🕵️♂️
📊 Market Analysis: Why NVDA?
NVDA is riding a bullish wave 🌊, confirmed by a double bottom pullback pattern and a sneaky liquidity grab at key support levels. The stock’s momentum is screaming “UP!” as buyers step in to defend the price. This setup is perfect for swing or day traders looking to capitalize on NVIDIA’s tech-fueled surge. 💻
🗺️ The Thief’s Plan: Bullish Heist Strategy
🎯 Entry Strategy:Deploy the Thief’s Layering Tactic with multiple buy limit orders to maximize your entry precision.
Suggested price levels:
$172.00
$174.00
$176.00
$178.00
Pro Tip: Feel free to add more layers based on your risk appetite and market conditions. The more, the merrier! 🧑💼
🛑 Stop Loss (SL):Set a Thief’s SL at $168.00 to protect your loot.
Note: Dear Thief OGs, this SL is my suggestion, but you’re the boss of your trades! Adjust based on your risk tolerance and let the profits roll. 💸
🎉 Take Profit (TP):Aim for the juicy $195.00 target, where we expect strong resistance, potential overbought conditions, and a possible trap for the unprepared. Lock in those hard-earned gains and escape like a pro! 🏃♂️
Note: This TP is my call, but you do you! Take profits at your own pace and keep the cash flowin’. 😎
🔗 Related Pairs to Watch (in USD)
To boost your market awareness, keep an eye on these correlated assets:
NASDAQ:AMD (Advanced Micro Devices): NVDA’s chipmaking cousin often moves in tandem. A bullish NVDA could signal strength in AMD. 📡
NASDAQ:SMH (VanEck Semiconductor ETF): This ETF tracks the semiconductor sector, including NVDA. Watch for sector-wide momentum. 📊
NASDAQ:QQQ (Invesco QQQ Trust): NVDA’s a heavy hitter in this tech-heavy ETF. QQQ’s trend can confirm NVDA’s direction. 🚀
Key Correlation Point: NVDA’s performance is tied to the broader semiconductor and tech sector. If AMD or SMH shows bullish patterns, it reinforces NVDA’s upside potential. Conversely, weakness in QQQ could signal caution. Stay sharp, thieves! 🕵️
🛠️ Why This Setup Rocks
Double Bottom Pullback: A textbook bullish reversal pattern, signaling strong buying interest. 📉➡️📈
Liquidity Grab: The market’s attempt to shake out weak hands before the real move up. We’re smarter than that! 😏
Layered Entries: Spread your risk across multiple price levels for a smoother ride. 🎢
Risk Management: Clear SL and TP levels keep your heist disciplined and profitable. 🧠
⚠️ Disclaimer
This Thief Style Trading Strategy is just for fun and educational purposes! I’m not a financial advisor, and trading involves risks. Make your own decisions, manage your risk, and trade responsibly. Let’s keep the vibes high and the losses low! 😜
✨ “If you find value in my analysis, a 👍 and 🚀 boost is much appreciated — it helps me share more setups with the community!”
#NVIDIA #NVDA #Trading #SwingTrading #DayTrading #ThiefStrategy #StockMarket #Bullish #TechnicalAnalysis
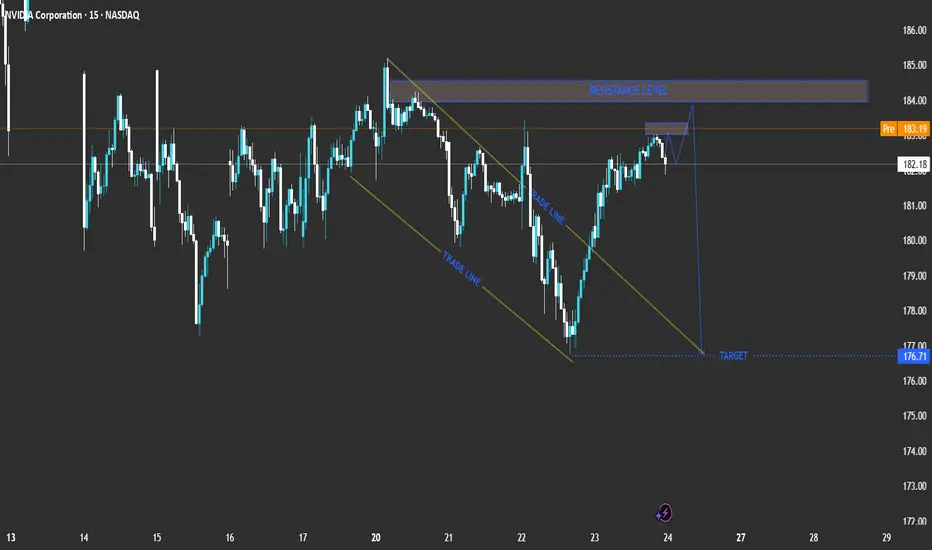
r NVIDIA Corporation (NVDA) based on your chart:Current Price: 182.18
Pre-Market Price: 183.21
Trend: Short-term bullish recovery inside a broader corrective phase.
Technical Breakdown
Descending Channel (Trade Line)
NVDA recently traded inside a downward-sloping channel, showing controlled selling pressure.
The breakout above the upper trade line suggests a short-term bullish correction phase.
Resistance Zone
A strong resistance level lies between 183.00 and 184.00.
This zone aligns with previous highs and may act as a reversal area if the price fails to break above it.
Expected Move
The chart projection shows a potential rejection near the resistance level, followed by a pullback towards the 176.71 target area.
This indicates that the current upward move might be corrective before another bearish swing.
Trade Scenarios
📉 Bearish Reversal Scenario (Primary Setup)
Entry Zone: 183.00 – 184.00 (resistance area)
Confirmation: Bearish rejection candlestick pattern or a failed breakout.
Target: 176.71
Stop Loss: Above 184.50
Comment: Ideal short setup if price rejects resistance.
📈 Bullish Breakout Scenario (Alternative)
Entry: Above 184.50 with strong bullish momentum.
Target: 186.50 – 187.00
Comment: A breakout and hold above resistance would invalidate the short setup and indicate further upside.
Summary Table
Bias Key Level Confirmation Target Notes
Bearish (Primary) 183 – 184 Rejection candle 176.71 Short setup
Bullish (Alternative) Above 184.50 Breakout candle 186.5 – 187 Upside continuation
Conclusion
NVIDIA (NVDA) is approaching a crucial resistance level. The most probable scenario is a bearish reversal from the 183–184 zone, targeting 176.71. However, a confirmed breakout above 184.50 would signal bullish continuation toward 187.00. NASDAQ:PLTR NASDAQ:AMD NASDAQ:AMZN NASDAQ:AAPL NASDAQ:TSLA OMXCOP:BAVA OMXCOP:GN OMXCOP:DNORD OMXCOP:TRMD_A OMXCOP:MAERSK_B OMXCOP:NKT OMXCOP:PNDORA OMXCOP:NSIS_B OMXCOP:DSV OMXCOP:ORSTED OMXCOP:GMAB
Nvidia - The next rally of +33% started!🚀Nvidia ( NASDAQ:NVDA ) just broke out:
🔎Analysis summary:
Over the past couple of months, Nvidia has been rallying an expected +100%. However, just objectively looking at the chart, this rally is not over yet. After the confirmed all time high breakout, Nvidia can rally another +33% until it will retest a substantial resistance level.
📝Levels to watch:
$250
SwingTraderPhil
SwingTrading.Simplified. | Investing.Simplified. | #LONGTERMVISION

Bullish Pullback Attack – NVIDIA Heist Plan for Escape Loot!🚨💻 NVIDIA (NVDA) Stock Heist Plan 🎭 | Swing & Day Trade Robbery 💰⚡
🌟 Hey Money Makers & Market Robbers! 🌟
Welcome back to the Thief Trading Den where we don’t trade… we steal from the market vaults! 🏦💸
🔥 Asset: NVIDIA (NVDA)
🎭 Heist Type: Swing / Day Trade
🔑 Plan: Bullish Pullback Robbery
🗝️ Entry (Breaking into the Vault)
First lockpick entry above 167.00+ 🔓
Retest & pullback = perfect robbery spot
Thief layering strategy: stack multiple buy limit orders (layered entry like robbers tunneling from multiple sides 🛠️).
Any price level? Yes, thieves adapt—grab loot wherever the window cracks open! 🏃♂️💨
🛑 Stop Loss (Escape Route 🚪)
Official Thief SL: @ 161.00 ⚠️
But dear Thief OG’s, adjust based on your risk appetite, loot bag size & startergy 🎭
Remember, no thief survives without an escape route! 🚁
🎯 Target (The Electric Fence Escape ⚡)
The High Voltage Electric Shock Fence is guarding the treasure @ 196.00 ⚡⚡
Snatch your profits before the fence fries the loot 🔥
Escape fast, spend faster, rob smarter 💸🍾
⚠️ Thief Alert 🚨
The market guards (short sellers) are patrolling heavy—don’t get caught in their traps 🕵️♂️
Use layered limit orders, scale out profits, and keep your SL tight!
A true thief never overstays at the crime scene 👀
💥 Boost this Robbery Plan 💥
Every like & comment powers the Thief Trading Family 🏆
Stay sharp, stay sneaky & let’s rob NVIDIA together! 🤑🎭

NVDA Showdown:Will Bulls Charge to $204 or Bears Drag Us to $163If NVDA falls under $179, it might quickly drop to $176.70. If it keeps falling, the next stop could be $163. But if NVDA goes up and closes above $188, we could see it reach $199 or even $204.
Why do these levels matter? Because a big move could happen soon; either a big fall or a strong jump up. What would you do if NVDA hit these prices? Have you seen this happen before?
If you’re wondering what these moves could mean for you, or if you have questions, just send me a message. Sometimes one good question leads to your best trade ever. What would you ask if you could get a clear answer?
Mindbloome Exchange/ Trade What You See

Nvidia - Starting a clear +20% rally!🧲Nvidia ( NASDAQ:NVDA ) rallies higher now:
🔎Analysis summary:
About one decade ago, Nvidia broke out of a major bullish triangle pattern. Following this remarkable breakout, Nvidia continued with a rally of about +35.000%. But looking at all these previous cycles, Nvidia remains bullish with another potential +20% move towards the upside.
📝Levels to watch:
$200, $250
SwingTraderPhil
SwingTrading.Simplified. | Investing.Simplified. | #LONGTERMVISION

Nvidia - The rally is still not over!🔌Nvidia ( NASDAQ:NVDA ) still heads much higher:
🔎Analysis summary:
For the past decade, Nvidia has perfectly been respecting a major bullish rising channel formation. Currently, Nvidia is still far away from the upper red resistance trendline, which indicates another potential move higher. Just understand that the trend is your closest friend.
📝Levels to watch:
$200
SwingTraderPhil
SwingTrading.Simplified. | Investing.Simplified. | #LONGTERMVISION

NVIDIA: Rally Stalling?After Nvidia initially drew closer to our beige Target Zone between $150.09 and $139.58, the stock was recently pushed higher once again. Therefore, we still see a 40% chance that a new high for beige wave alt.III could emerge above resistance at $184.11. However, our primary view is that price has already entered wave IV, which should extend downward into the aforementioned beige zone. Since we expect a strong rally during wave V, this price range presents an attractive entry point for long positions, with a stop that can be set 1% below the lower boundary of the zone. Looking ahead, beige wave V should extend up to the blue Target Zone between $227.38 and $260.60, where it should complete the larger waves (V) in blue and in lime green.

NVDA gravity is strong....$140NVDA is heading towards the death cross (SMA200) and doesn't seem like much will change that at this point. The economy is doing horribly, despite a few small wins. Even the lower interest rate (25/50 basis points) is too little too late, when most of the S&P is already trading below 200SMA. There is a massive overheating of AI Tech stocks that are highly concentrated, and a massive correction is coming. Follow CAPE and PE ratios historically, this time won't be different! Best of luck....

NVDA $182 Weekly CALL Setup – Cheap Premium, Big Upside?
# 🚀 NVDA Weekly Options Trade Idea (2025-09-03)
### 📊 Multi-Model Recap
* **Daily RSI**: 📉 34.3 (weak)
* **Weekly RSI**: 🔻 73.2 (falling)
* **Volume**: +1.3x → institutional distribution signs
* **Options Flow**: 🔥 C/P = 1.96 (bullish skew)
* **Gamma/Theta**: ⚡ High risk (2 DTE)
👉 Models Split:
* 🐻 Bearish: Claude, Gemini → favor \$165 PUT
* 🐂 Bullish: Llama, Grok → favor \$175 CALL
* 😶 Neutral/No Trade: Claude (low confidence)
---
### 🧭 Consensus Read
* Price & volume = bearish ⚠️
* Options flow & VIX = bullish 📈
* Net: **Mixed bias → tactical bullish bounce possible**
---
### ✅ Trade Setup (Viral Play)
```json
{
"instrument": "NVDA",
"direction": "CALL",
"strike": 175,
"expiry": "2025-09-05",
"entry_price": 0.68,
"profit_target": 1.36,
"stop_loss": 0.34,
"size": 1,
"confidence": 0.65,
"entry_timing": "market open"
}
```
---
### 🎯 Trade Details
* 📌 **Strike**: \$182 CALL
* 💵 **Entry**: 0.68 (ask, open)
* 🎯 **Target**: 1.36 (+100%)
* 🛑 **Stop**: 0.34 (-50%)
* 📅 **Expiry**: Sep 5 (2 DTE)
* 📈 **Confidence**: 65%
* ⏰ **Hold Policy**: Close by Thu EOD (don’t ride Friday gamma bomb)
---
⚠️ **Risks**:
* 2 DTE = 🔥 high gamma / fast theta decay
* Divergent signals → whipsaws possible
* Tight stop discipline required 🚨
