NVDA: Corrective Structure Toward 207 GapFrom an Elliott Wave perspective, NVDA appears to be developing a corrective sequence.
The decline from the recent all-time high to the 169.50 area unfolded as a three-wave ABC correction. Notably, this move lacked impulsive characteristics, as neither wave A nor wave C subdivided into a five-wave structure. This strongly supports the interpretation of the decline as corrective rather than impulsive.
Based on this structure, price may now form another corrective three-wave move to the upside. This potential advance is highlighted on the chart with a purple arrow, projecting toward the 207 area, where a previously unfilled gap remains. The gap is considered additional confluence, not the primary driver of the setup.
Once this corrective move completes, I will be watching for renewed downside development. From that point, two alternative scenarios are possible, both outlined on the chart using the green and orange arrows.
This analysis is focused on wave structure and corrective sequencing, rather than trend continuation or directional bias.
Nvidia

NVDA mid-term TANvidia is in consolidation phase, the long-term uptrend is still intact, this could be a great area to buy, though the indicators are still struggling to turn around and continue the uptrend but they are not strictly bearish as some of the other stocks in this sector but rather lightly bullish. Weekly volumes remain bullish, let's keep an eye on Nvidia.

Unfilled Gap = Final Trap? NVIDIA Trade Idea📊 NVIDIA — TRADE IDEA
Hey traders! 👋🔥
I’ve been closely watching NVIDIA, and honestly… the chart is giving me strong Bitcoin-in-October vibes 👀
Back then, BTC looked strong — right before it started a proper corrective move down.
From current levels, I believe NVIDIA can still squeeze higher 🚀
Why? Because we have an unfilled gap in the $200–206 area, and as we all know:
👉 Gaps don’t stay open forever. They get filled.
My base scenario is simple:
📈 NVIDIA pushes into $200–206,
💧 grabs liquidity,
🐻 adds shorts,
➡️ and only then we see a real reversal and a healthy correction.
🎯 DOWNSIDE TARGETS
📉 Target 1: $160
📉 Target 2: $150
📉 Target 3: $140
And honestly… I wouldn’t be surprised to see even lower levels, because on a macro scale I’m expecting a major correction in the S&P 500, and most equities should follow.
⚠️ For now, I’m watching how price behaves near the gap zone.
Let’s see how the chart unfolds 👀📊

China holds the key on Nvidia’s H200 approvalThe U.S. has cleared Nvidia to sell its H200 chips into China under strict conditions — prioritising domestic supply and tighter security checks — but deliveries are paused as Beijing decides whether to allow them in. Chinese customs officials have reportedly cautioned against purchases, leaving roughly $30 bn of estimated demand in limbo. Nvidia would surrender a 25% revenue cut to Washington under the deal. Markets barely reacted, waiting for clarity from China.
For the setup to improve, the RSI needs to move above 50 and Nvidia’s EMAs need to establish a bullish crossover. Achieving this soon would confirm a higher trough and create a base for the next leg up. A break above the $194 resistance would then confirm a higher peak and establish the foundations of a new uptrend.

Eli Lilly & NVIDIA: A $1B AI Pharma RevolutionEli Lilly’s $1 billion partnership with NVIDIA signals a seismic shift in pharmaceutical valuation and strategy.
The convergence of biology and silicon is no longer theoretical; it is the new standard for industry leadership. By integrating NVIDIA’s AI supercomputing into its core operations, Eli Lilly (NYSE: LLY) is transitioning from a traditional drug maker to a bio-computation giant. This move secures its dominance not just in medicine, but in the high-growth data economy.
Technology & Science: The "Loop" Advantage
The core of this growth thesis is the new "loop-style" discovery system. Traditional drug discovery is linear, slow, and prone to failure. Lilly’s new model utilizes an AI supercomputer to generate molecular candidates, which physicians then test. Crucially, the biological data from these tests immediately feeds back into the AI, refining the model in real-time. This recursive learning cycle drastically reduces the time-to-market for new therapies. Science is now software-defined, and Lilly controls the source code.
Industry Trends & Economics: Capturing the $105B Market
The financial implications are staggering. The drug discovery market hit $105 billion in 2025, growing at a steady 10% annually. However, the real explosion lies in AI-enabled discovery, currently under 20% of the sector but projected to expand sixfold by 2034. Lilly is not just participating in this growth; they are engineering it. By dominating AI-driven discovery, they unlock inroads to the $550 million U.S. production market, effectively vertically integrating intelligence with manufacturing.
Geopolitics & Geostrategy: Health Security
Pharmaceutical dominance is a pillar of modern national security. Nations that control the fastest drug discovery platforms possess a distinct geostrategic advantage. By onshoring this supercomputing capacity, Eli Lilly aligns itself with U.S. interests in biological resilience. This reduces reliance on foreign research supply chains and positions the company as a strategic asset. Investors should view this as a government-aligned moat that insulates the stock from standard market volatility.
Cyber & High-Tech: The Data Fortress
Integrating NVIDIA’s Thor IGX platform transforms Lilly’s cyber profile. The company is no longer just protecting formulas; it is guarding proprietary training data. This shift demands a "Zero Trust" cyber architecture. As Lilly digitizes biological experimentation, its database becomes one of the most valuable intellectual properties on earth. Management’s foresight to secure industrial-grade AI infrastructure proactively mitigates the risks of IP theft in an era of digital espionage.
Management & Leadership: A Culture of Disruption
Corporate leadership is abandoning the "siloed" R&D model. Lilly’s executives are aggressively fostering a culture where data scientists sit equal to biologists. This cross-pollination drives innovation speed. While competitors hesitate to disrupt legacy workflows, Lilly’s management is betting the balance sheet on generative AI. This decisiveness commands a valuation premium. It signals to shareholders that leadership prioritizes long-term structural dominance over short-term quarterly safety.
Conclusion
Eli Lilly is redefining the pharmaceutical business model. Through its partnership with NVIDIA, it has effectively operationalized the future of medicine. For investors, LLY is no longer just a healthcare play; it is a high-tech growth stock backed by biological assets.

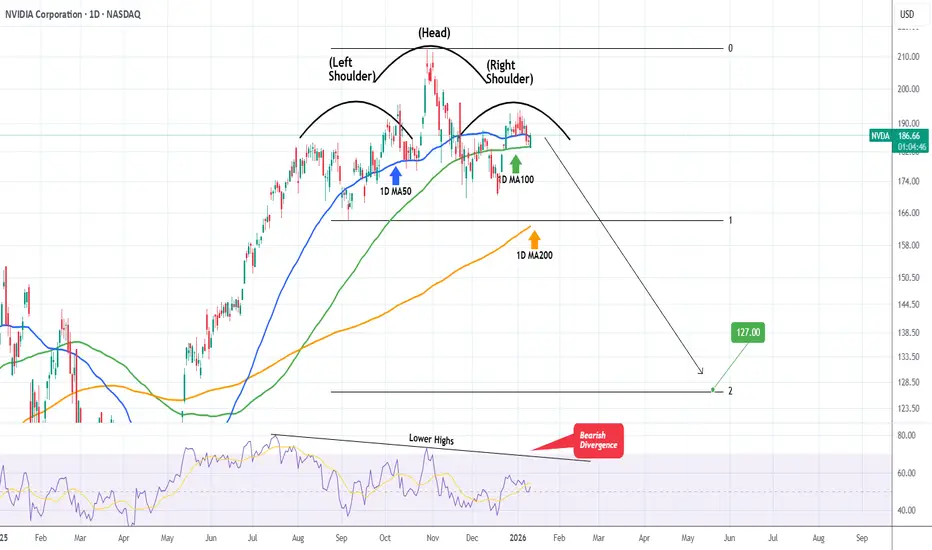
NVIDIA Huge Head & Shoulders forming. $127 technical Target.NVIDIA Corporation (NVDA) is in the process of completing the Right Shoulder of a Head and Shoulders (H&S) pattern, having turned sideways since the October 29 2025 High (ATH).
With the 1D RSI on Lower Highs, i.e. a Bearish Divergence since July 17 2025, it is possible that within a month's time max, the stock will break its Support and the H&S will target its technical extension, the 2.0 Fibonacci at $127.00.
---
** Please LIKE 👍, FOLLOW ✅, SHARE 🙌 and COMMENT ✍ if you enjoy this idea! Also share your ideas and charts in the comments section below! This is best way to keep it relevant, support us, keep the content here free and allow the idea to reach as many people as possible. **
---
💸💸💸💸💸💸
👇 👇 👇 👇 👇 👇
COREWAEVE WAS A SCAM IPOSo expect it to make all time lows.
The company was only IPO'd based on a fake order by #NVIDIA.
INSIDERS are dumping.
oN yOu.
This is a roundtripooor.

Nvidia - The -25% correction starts now!✂️Nvidia ( NASDAQ:NVDA ) is about to create a correction:
🔎Analysis summary:
After Nvidia retested major support in mid 2025, we saw another rally of about +125%. But now, Nvidia is rejecting a major resistance trendline and is about to create bearish confirmation. Quite likely that Nvidia will create a major -25% correction in the future.
📝Levels to watch:
$140
SwingTraderPhil
SwingTrading.Simplified. | Investing.Simplified. | #LONGTERMVISION

Nvidia - This is all still expected!🥊Nvidia ( NASDAQ:NVDA ) is heading for another -20%:
🔎Analysis summary:
Just last month, Nvidia created a massive bearish engulfing candle. This clearly shows that buyers are not willing to accept higher prices. Together with the retest of the major resistance trendline, Nvidia is heading lower. The next support will come at about -20%.
📝Levels to watch:
$150
SwingTraderPhil
SwingTrading.Simplified. | Investing.Simplified. | #LONGTERMVISION

NVIDIA’s $20B Groq Move: A Masterclass in AI DominanceNVIDIA recently shocked the tech world with a massive strategic play. The company announced a $20 billion cash deal to license Groq’s technology. This "acqui-hire" secures elite engineering talent, including Groq founder Jonathan Ross. NVIDIA is aggressively reinvesting its massive cash pile to secure total future dominance. The market responded instantly, pushing NVIDIA’s valuation past the $4.6 trillion milestone.
Industry Trends: Navigating the Inference Flip
The AI market shifted fundamentally in late 2025. For years, the industry focused on training massive models. NVIDIA’s Blackwell and Hopper GPUs led that charge. However, revenue from AI Inference (running models) has now surpassed training revenue. This shift, known as the "Inference Flip," demands a new hardware approach.
Training is a one-time event, but inference is a 24/7 utility. Every chatbot response or robotic movement requires high-speed inference. NVIDIA’s move ensures it leads this continuous, high-volume segment of the global economy.
Technology & Science: GPUs vs. LPUs
NVIDIA’s GPUs are powerful "freight trains" built for massive data volume. They excel at throughput but often face latency issues. Conversely, Groq’s Language Processing Units (LPUs) function like Formula 1 cars. They prioritize instant acceleration and real-time speed.
Groq’s chips process up to 500 tokens per second. Standard GPU setups often struggle to reach 100 tokens. By absorbing this technology, NVIDIA bridges its only significant performance gap. This integration provides the low-latency infrastructure required for future agentic AI.
Business Models & Regulatory Strategy
The Federal Trade Commission (FTC) remains a major hurdle for big tech. A traditional merger would likely face a direct block from regulators. NVIDIA’s management navigated this risk with an innovative "reverse acqui-hire" model.
NVIDIA pays for intellectual property and hires core staff. However, the Groq corporate entity technically remains independent. This structure avoids the mandatory waiting periods of the Hart-Scott-Rodino Act. NVIDIA gains the technology today without years of litigation or regulatory delays.
Management & Leadership: Neutralizing the Competition
Human capital is the most valuable asset in this transaction. Jonathan Ross, the creator of Google’s TPU, now joins NVIDIA. This move effectively strips Google of a key architectural visionary.
NVIDIA is not just buying chips; it is absorbing the brains behind them. This leadership transition neutralizes a potent rival. It also deprives competitors of the talent needed to build custom silicon alternatives.
Macroeconomics & Financial Power
NVIDIA’s financials are essentially flawless. The company generated $22.1 billion in free cash flow in just one quarter. Effectively, NVIDIA paid for this expansion with only three months of profit.
The stock trades at a forward P/E of 23x, suggesting strong growth. High interest rates often pressure tech companies, but NVIDIA remains immune. Its cash reserves allow for aggressive expansion while still rewarding shareholders with dividends.
Innovation & Patent Analysis
Intellectual property is the bedrock of NVIDIA’s long-term moat. The company will integrate Groq’s low-latency IP into its upcoming Rubin architecture . This ensures its "AI Factory" platform remains the industry standard.
NVIDIA is evolving from a hardware vendor into a comprehensive AI Operating System . Every patent and strategic hire reinforces this ecosystem. Competitors find it increasingly difficult to offer a viable alternative to the NVIDIA stack.

NVDA which direction?Im saying the area 195-203 is critical what happen when tested could be clear the next direction, if breakthrough to the ascending channel then bullish, if rejected could be bearish to test lower levels than 170 to possible 140 for solid support.
lets see next 2 weeks

NVIDIA – When the Same Setup Appears Twice!NVDA - CURRENT PRICE : 188.61
NVDA – Technical BUY Call 📈
Price previously rallied steadily after breaking a minor downtrend line (refer orange circle).
Similar technical setup is forming again, suggesting a potential repeat of the prior upswing.
In both occurrences, price stayed above EMA50 , confirming the broader bullish trend remains intact.
RSI remains in bullish territory (>50) and is not overbought, indicating healthy momentum with further upside potential.
No major distribution signal observed, pullback appears corrective rather than trend-reversing.
Notes : According to Moomoo, broker house targets range from USD 200 (lowest) to USD 352 (highest), with an average target of USD 260.
ENTRY PRICE : 186.00 - 188.61
FIRST TARGET : 206.00
SECOND TARGET : 224.00
SUPPORT : 170.00

Nvidia (NVDA) Shares Rise On Potential Chip Shipments to ChinaNvidia (NVDA) Shares Rise On Potential Chip Shipments to China
According to Reuters sources, Nvidia has informed Chinese clients of plans to begin shipments of its H200 chips by mid-February 2026. This has been made possible by a recent change in US export policy, which allows the sale of advanced technologies provided a special 25% duty is paid.
NVDA shares reacted positively to the news, as the ability to legally sell high-performance chips — which are roughly six times more powerful than the previously approved, cut-down H20 versions — to major players such as Alibaba and ByteDance could significantly boost Nvidia’s revenues.
Technical Analysis of Nvidia (NVDA)
In November, we identified an ascending price channel, which remains intact.
Today, the NVDA chart shows clear signs of demand dominance:
→ the price reversed higher (as indicated by the arrow) before reaching the lower boundary of the channel, with the $170 level acting as support;
→ bullish gaps were formed at the open of the last two sessions.
Particular attention should be paid to the candle of 19 December:
→ trading volumes were exceptionally high;
→ the candle body was wide, with the session opening at the low and closing at the high.
If the decline from the all-time high is viewed as a corrective “bull flag” pattern (marked in red), it is notable that the price is now testing the upper boundary of that flag. In this context, it is reasonable to assume that if buying pressure remains strong, the price could break out of the correction and move towards the median of the long-term uptrend that has been in place throughout 2025.
This article represents the opinion of the Companies operating under the FXOpen brand only. It is not to be construed as an offer, solicitation, or recommendation with respect to products and services provided by the Companies operating under the FXOpen brand, nor is it to be considered financial advice.

NVDIA ANALYSISFirst of all, my main focus in trading is Crypto but I also examine US stocks once in a time.
As I can understand from the chart in here, there is a high possibility that Nvdia is about to face a crash.
For the ones who comes to my profile for the first time, please here me out for a bit.
Technical outlook:
I'm an Elliott analysist and I always use waves to gauge the price and as I can see by my calculations, Nvdia has already finished its short term 5 wave impulsive upward move.
Low volume and shift in market structure supports this thought as well.
Moreover, if you want a simpler explanation; there is also a head and shoulders pattern formed right in here as well which also signaling a contuniuation thorugh downwards.
What I believe is that there is a high chance for a double Zig-Zag corrective pattern to form for the long run. For now, let's focus on the demand zone. I believe that zone will be the first A point of A-B-C corrective Zig-Zag move.
Fundemental factors:
Today we have witnessed that US has announced its inflation is way lower than expectation (%2.7). Expectation was way too much (%3.1) and it means that FED will not be willing to cut the interest rates for the new quarter of the new year which is going to be very bearish.
Moreover, Tomorrow Bank of Japan (BOJ) will announce its interest rate hike. The problematic thing is that some officials and bank menagers from Japan pointed out that Japan may actually want to increase its intertest rates even more next year by March 2026.
The biggest problem about the news lies just in here.
Yes, FED is pumping more money to people and Trump is going to be doing tax refunds and all but we can't ignore the macro news and other events.
I believe that 2026 will start very bad for the markets like Crypto or Nasdaq but I also see a very green light in the end of the tunnel as well. Second quarter might be way more profitable if you play this carefully.
Thanks for reading.

$NVDA IS GOING DOWN TO $150 - Bearish Pattern and weakness NASDAQ:NVDA IS GOING DOWN TO $150 - Bearish Pattern and weakness Continues
The supports/demand are $170 THEN $164 and lastly $150 .
Khalaf,

Nvidia: New Low ExpectedNvidia should soon develop further downward momentum to carve out the low of the beige wave IV. Nevertheless, price should pivot upward before dropping below the support at $145.50 and rise into our red Target Zone between $227.38 and $260.60. This is where the waves V in beige, (V) in blue, and in lime green are expected to find their common peak, followed by a new, significant correction phase. Consequently, we consider the red zone a suitable range to enter on the short side, with a stop set 1% above the zone's upper edge to aid in risk management. We also consider a 33% probability that the lime green wave alt. already completed at $212.16. This alternative scenario would be confirmed by direct sell-offs below the $145.50 support.

Nvidia - The correction just started!💉Nvidia ( NASDAQ:NVDA ) is now heading lower:
🔎Analysis summary:
Just recently, Nvidia once again retested the major rising channel resistance trendline. Together with November's bearish engulfing candle, Nvidia is slowly shifting bearish. And before Nvidia will retest the next major support area, we can see a drop of another -15%.
📝Levels to watch:
$150
SwingTraderPhil
SwingTrading.Simplified. | Investing.Simplified. | #LONGTERMVISION

$NQ NASDAQ/US100 Bearish W Pattern Target Hit, Next Quick UpdateHi
The W pattern completed as expected and after that it fell. It reached the first bearish target. I personally am not looking for any more bearishness. I an bullish from the current levels. However I trade what I see and will plan after seeing the latest price action.
There was a big gap let. All these gaps may or may not get filled but they are important levels. So if the markets becomes bullish again, it may try to go higher from the current levels o fill that gap to the upside.
These is a previous gap level which can also provide support if the market falls from the current levels.
Trade what you see, wait for the confirmations and manage the risk as always.
Follow for more. Please support this analysis by liking, commenting, and sharing with friends, colleagues, traders, and trading communities. Thanks👍🙂

NVIDIA must hold $169A clear line in the sand is evident (in my eyes)
Closing beneath $169 could beget further selloffs and trigger a Head and shoulders pattern.
Which projects down to $135.
Around a -36% Haircut
At which point it could represent really good value to the long side.

DeepSeek Smuggles Nvidia (NASDAQ: $NVDA) Chips for AI ModelChinese AI startup DeepSeek is reportedly building its next major artificial intelligence model using thousands of Nvidia (NASDAQ: NVDA) Blackwell-generation GPUs that were smuggled into China, according to a detailed investigation by The Information. These chips, among Nvidia’s most advanced AI accelerators, are restricted under U.S. export controls, making them unavailable to Chinese buyers through legal channels.
The report highlights a sophisticated smuggling operation in which servers equipped with Blackwell chips were initially shipped to data centers in countries not affected by U.S. restrictions. The servers were then dismantled, and their components imported into China in pieces, bypassing regulatory scrutiny. Most Nvidia chips are produced in Taiwan and distributed globally through a network of intermediaries, creating gaps that can be exploited.
For DeepSeek, access to the Blackwell architecture provides a significant performance advantage. It enables faster training times, larger models, and superior inference efficiency—critical factors in the global AI race. Despite Beijing’s aggressive support for domestic semiconductor advancement, Chinese-made AI chips still trail Nvidia’s top-tier performance, according to executives from Chinese AI companies.
Nvidia, responding to the allegations, stated that it has not seen evidence of “phantom data centers” being constructed and dismantled to disguise smuggling routes, though the company emphasized that it investigates any credible tip it receives.
Technical Analysis
NVDA’s price action remains in a broad structural uptrend, despite recent volatility. The stock is currently trading near $185, just below its shorter-term moving average. A critical resistance zone lies around $212, marked by the previous swing high. A breakout above this level could resume the macro uptrend, potentially targeting new all-time highs.
If price fails to reclaim momentum, downside support sits around $170, where significant demand previously pushed price higher. A deeper correction could revisit the $145 liquidity zone, aligning with historical consolidation. Overall, NVDA remains technically strong, but sensitive to geopolitical and regulatory headlines.

Costco Levels with TAPretty clear recapture red and youll grind to the upside if you don't you have your red to the downside which is a magent.
NIKE SHORT TRADING PLANI am shorting Nike because its long-term trend is downward, and the lower line represents a support level. I’m also basing my short position on RSI signals.

NVIDIA This is how it can reach $100 and the Supports involved.NVIDIA Corporation (NVDA) had a strong red 1M candle last month, the first one after a rally of 7 straight green months. This is not the first time we present you this 12-year Channel Up, in fact we used this in late October to give a sell signal.
The reason is that Nvidia almost reached the top of that pattern, a technical Higher High, successive if you count the late 2024 one. Such Double Tops have been previously consistent with the start of strong corrections (Bearish Legs) which in both cases (2018 and 2022) bottomed on the 1W MA200 (orange trend-line).
The key element that we added on the chart this time is the (green) Support Zone, which stemmed every time from the last consolidation (blue circle) before the Top.
It is no surprise that this time it also falls on the 1W MA200 and a potential contact with the price towards Q3 2026 and beyond. Even then, it will still be above the 0.382 Fibonacci retracement level as in December 2018 and quite close to the bottom of the Channel Up for the first time since October 2022.
Our long-term Target and thus next long-term Buy Signal, remains $100.
---
** Please LIKE 👍, FOLLOW ✅, SHARE 🙌 and COMMENT ✍ if you enjoy this idea! Also share your ideas and charts in the comments section below! This is best way to keep it relevant, support us, keep the content here free and allow the idea to reach as many people as possible. **
---
💸💸💸💸💸💸
👇 👇 👇 👇 👇 👇
