NVDA Setup Explained: Layered Entry + Clear SL/TP Levels😎 NVDA Thief’s Wealth Heist: Swing/Day Trade Blueprint 🚀
Asset: NVIDIA Corporation (NVDA) 📈Vibe: Bullish, sneaky, and ready to snatch profits with style! 💰
Welcome, ladies and gentlemen, to the Thief’s OG Wealth Strategy Map for NVDA!
This is a fun swing/day trading plan designed to grab liquidity like a master thief. Let’s break down this bullish setup with a double bottom pullback, layered entries, and a cheeky escape plan. Ready to outsmart the market? 🕵️♂️
📊 Market Analysis: Why NVDA?
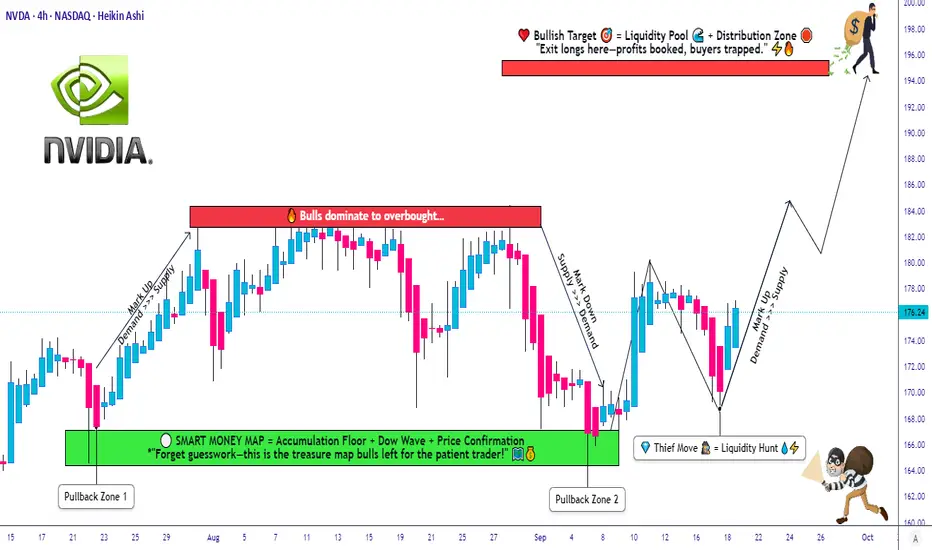
NVDA is riding a bullish wave 🌊, confirmed by a double bottom pullback pattern and a sneaky liquidity grab at key support levels. The stock’s momentum is screaming “UP!” as buyers step in to defend the price. This setup is perfect for swing or day traders looking to capitalize on NVIDIA’s tech-fueled surge. 💻
🗺️ The Thief’s Plan: Bullish Heist Strategy
🎯 Entry Strategy:Deploy the Thief’s Layering Tactic with multiple buy limit orders to maximize your entry precision.
Suggested price levels:
$172.00
$174.00
$176.00
$178.00
Pro Tip: Feel free to add more layers based on your risk appetite and market conditions. The more, the merrier! 🧑💼
🛑 Stop Loss (SL):Set a Thief’s SL at $168.00 to protect your loot.
Note: Dear Thief OGs, this SL is my suggestion, but you’re the boss of your trades! Adjust based on your risk tolerance and let the profits roll. 💸
🎉 Take Profit (TP):Aim for the juicy $195.00 target, where we expect strong resistance, potential overbought conditions, and a possible trap for the unprepared. Lock in those hard-earned gains and escape like a pro! 🏃♂️
Note: This TP is my call, but you do you! Take profits at your own pace and keep the cash flowin’. 😎
🔗 Related Pairs to Watch (in USD)
To boost your market awareness, keep an eye on these correlated assets:
NASDAQ:AMD (Advanced Micro Devices): NVDA’s chipmaking cousin often moves in tandem. A bullish NVDA could signal strength in AMD. 📡
NASDAQ:SMH (VanEck Semiconductor ETF): This ETF tracks the semiconductor sector, including NVDA. Watch for sector-wide momentum. 📊
NASDAQ:QQQ (Invesco QQQ Trust): NVDA’s a heavy hitter in this tech-heavy ETF. QQQ’s trend can confirm NVDA’s direction. 🚀
Key Correlation Point: NVDA’s performance is tied to the broader semiconductor and tech sector. If AMD or SMH shows bullish patterns, it reinforces NVDA’s upside potential. Conversely, weakness in QQQ could signal caution. Stay sharp, thieves! 🕵️
🛠️ Why This Setup Rocks
Double Bottom Pullback: A textbook bullish reversal pattern, signaling strong buying interest. 📉➡️📈
Liquidity Grab: The market’s attempt to shake out weak hands before the real move up. We’re smarter than that! 😏
Layered Entries: Spread your risk across multiple price levels for a smoother ride. 🎢
Risk Management: Clear SL and TP levels keep your heist disciplined and profitable. 🧠
⚠️ Disclaimer
This Thief Style Trading Strategy is just for fun and educational purposes! I’m not a financial advisor, and trading involves risks. Make your own decisions, manage your risk, and trade responsibly. Let’s keep the vibes high and the losses low! 😜
✨ “If you find value in my analysis, a 👍 and 🚀 boost is much appreciated — it helps me share more setups with the community!”
#NVIDIA #NVDA #Trading #SwingTrading #DayTrading #ThiefStrategy #StockMarket #Bullish #TechnicalAnalysis
Nvidiabuysignal
Bullish Pullback Attack – NVIDIA Heist Plan for Escape Loot!🚨💻 NVIDIA (NVDA) Stock Heist Plan 🎭 | Swing & Day Trade Robbery 💰⚡
🌟 Hey Money Makers & Market Robbers! 🌟
Welcome back to the Thief Trading Den where we don’t trade… we steal from the market vaults! 🏦💸
🔥 Asset: NVIDIA (NVDA)
🎭 Heist Type: Swing / Day Trade
🔑 Plan: Bullish Pullback Robbery
🗝️ Entry (Breaking into the Vault)
First lockpick entry above 167.00+ 🔓
Retest & pullback = perfect robbery spot
Thief layering strategy: stack multiple buy limit orders (layered entry like robbers tunneling from multiple sides 🛠️).
Any price level? Yes, thieves adapt—grab loot wherever the window cracks open! 🏃♂️💨
🛑 Stop Loss (Escape Route 🚪)
Official Thief SL: @ 161.00 ⚠️
But dear Thief OG’s, adjust based on your risk appetite, loot bag size & startergy 🎭
Remember, no thief survives without an escape route! 🚁
🎯 Target (The Electric Fence Escape ⚡)
The High Voltage Electric Shock Fence is guarding the treasure @ 196.00 ⚡⚡
Snatch your profits before the fence fries the loot 🔥
Escape fast, spend faster, rob smarter 💸🍾
⚠️ Thief Alert 🚨
The market guards (short sellers) are patrolling heavy—don’t get caught in their traps 🕵️♂️
Use layered limit orders, scale out profits, and keep your SL tight!
A true thief never overstays at the crime scene 👀
💥 Boost this Robbery Plan 💥
Every like & comment powers the Thief Trading Family 🏆
Stay sharp, stay sneaky & let’s rob NVIDIA together! 🤑🎭

Is Nvidia preparing for another reversal?Is Nvidia preparing for another reversal? It would makes sense at this level. Could it continue up from here? Of course! But I only buy when it's red and retracing. I never jump on a moving train, so lets hope this train slows down so we can jump back in.
May the trends be with you.
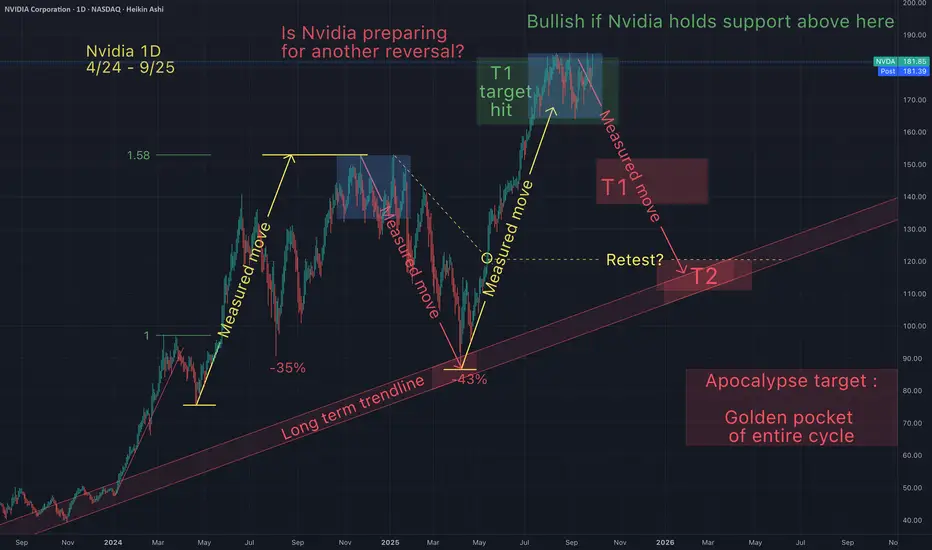
Is Nvidia preparing for a retracement?On July 23rd I posted a chart suggesting that Nvidia had topped (at my green T1). Since then Nvidia has stalled at my T1 range for the past 2 months.
Question remains, will Nvidia retrance from here as anticipated? What do you think, I'd like to hear from you, to gauge sentiment.
May the trends be witht you.

Long entry in NVIDIA! Fibonacci Analysis and Strategy¡Hi traders! Today, I’m sharing a long trade setup in NVIDIA (NVDA) that I’ve been watching closely. Let me walk you through my analysis and the plan I have for this entry.
Take a look at this: the Fibonacci retracement is perfectly drawn, from the recent low to the high, and now the price is reacting right at the key 0.618 level—a super important zone for potential buy entries! On top of that, the RSI is holding above 50, signaling bullish momentum with room to grow before hitting overbought conditions.
Here’s my plan:
- Entry: I’m entering now, taking advantage of the breakout and support confirmation at the 0.618 level.
- Stop Loss: I’ve set my stop slightly below the 130 level, just in case the price makes a deeper pullback.
- Take Profit:
- My first target is 154.67, which is the 1.0 Fibonacci level.
- If the bullish momentum continues, I’ll aim for 194.51 at the 1.618 extension.
What I love about this setup is that the volume doesn’t show any major weakness, and the overall trend is still intact. Of course, always remember to manage your risk—trading is all about probabilities, not guarantees.
What do you think of this trade? Would you take this long entry with me? Let me know in the comments, and don’t forget to subscribe to the channel for more analysis like this. See you in the next idea, traders! 🚀📈
Disclaimer:
This content is for educational and informational purposes only. It does not constitute financial advice or investment recommendations. Remember, trading involves risks, and every trade should be analyzed based on your own risk profile. Always consult a professional before making financial decisions. Trade responsibly and manage your risk!

Nvidia Multi-Timeframe Analysis 29.01Hello Traders,
welcome to this free and educational technical analysis .
Nvidia is looking very bullish on the weekly timeframe, considering that we are creating a massively bullish inverted head and shoulders.
On the daily timeframe I am now just looking for a retest of the neckline of the head and shoulders and some bullish confirmation on the lower timeframes to enter a long
to capitalize on the next massive move towards the upside.
Thank you for watching and I will see you tomorrow!
You can also check out my previous analysis of this asset:

NVDA COMPLETION OF ABC CORRECTIONMarket finished 1-5 Elliot Wave Theory, broke the down trend and is on a verge to complete ABC correction, we are expecting this to be a flat ABC correction, because it is a 88.6 fib zone, the top of down trend line line, which also can be counted as a retrace, sop we expect a bounce off of a trendline and price to rise up to at least B point of a ABC correction.
Target: 290.56 (61.8 fib zone)
Entry: 215.5
Invalidation: 190.5
