NZDCAD LONG IDEAHey guys, This pair previously formed a double top and was bearish till it got to that lower trendline which shows lower highs forming.
I'm bullish on this pair. Incase it breaks that lower trendline, my bias will change.
Happy trading
Nzdcadlong

NzdcadNzdcad start with up trend, because one hour time frame candle form of higher high formation and then day chart candle tough trend line

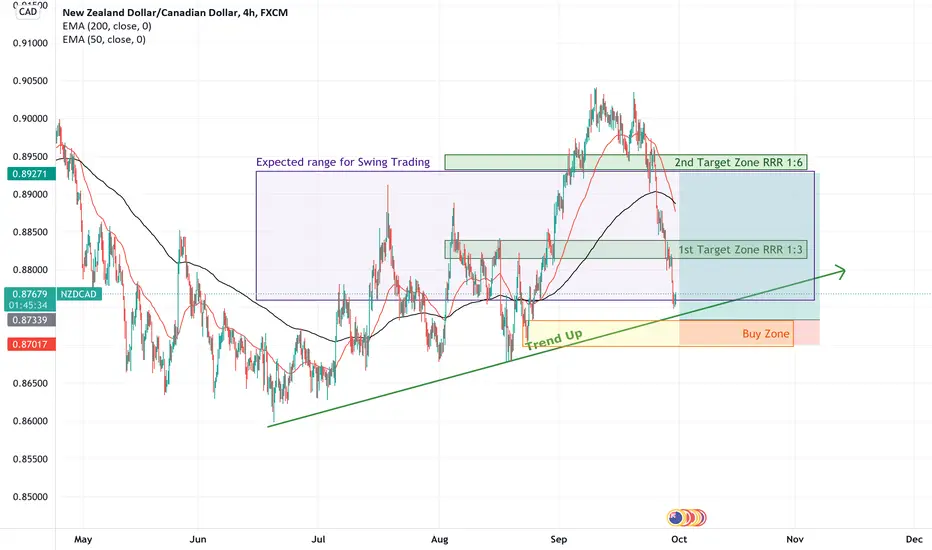
NzdCad H4 Trading Idea RRR 1:3-6Buy Zone 0.87346 - 0.86981
1st Target (RRR 1:3) 0.88170
2nd Target (RRR 1:6) 0.89307 at Top Expected Range
Move the stop loss to breakeven after 2% profit
FOREX ANALYSIS : NZDCADFX:NZDCAD
The blue and red lines mean: I think prices can return in these areas.
Green lines mean: I think the price can reach these areas. They are therefore known as transaction targets.
If you want to use this deal, please risk only one percent of your account balance.

NZDCAD Looking for Long PositionsHi Everyone,
After the rotation in the channel we arrive to the supor level & Base of the Bullish Channel with the indicator in the area of Overbuy Time Frames => M5&H1&H4.
1) First, I want to see a Breakout of the bearish Channel.
2) Second, I want to see any signal, Chartist, Candles or in the indicators to get in.
Then I trade as usual 1% Risk. 0.5% for the entry and another 0.5% to get in at the lowess, with a Stoploss ATR Daily.
Goodbye & Good Trading!!!

H1-H4 NZD/CAD LONGBASED on Daily chart NZD/CAD at strong support level. Possible pullback to 88.15 price range.
Not a trading advice.
Trade wisely.

NZDCAD: Catch The Ride DownI would expect the price to come back to the equal low liquidity before we see any signs of bulls.
I would want to enter sells on a slight pullback.
If we see a pullback with signs of rejection I will be scaling in sells for a juicy drop to the downside.
Do you agree with me?

NZDCADprice already broke the uptrend channel and already make an retest to, waiting the candle confirmation and we ready for short trade. But price maybe broke the retest and going uptrend. remember always waiting for the breakout + retest + candle confirmation + money management + psychology. GOOD LUCK

NZDCAD ANALYSISOn this pair we see a potential sell, if this uptrend break is confirmed and we break this support we can enter on a sell with really great chance to see the 0.5 levels on this impulse, we could see further correction to 618 but we need to check the strenght of the correction. If this support resist we can see this uptrend being continued and testing the 0.91 resistance. Wait for the market and react! Good Luck on the market!

NZDCAD SWING TRADEHigh probability trade
The analysis begins from the Daily timeframe to the 4-hour timeframe execution zone .
5 wave structure complete with multiple wave structures currently in a 3 wave pattern internal structure (3-3- ((with a possibility of 5 to follow)))
Considering where wave B has ended we should consider a high probability that wave C might only go back to the previous high in the wave structure or point A

Short NZDCAD NZDCAD after touching Weekly and daily resistance is moving down , once TL and support is broken to the downside we can go short on the retest with the Stop loss previous high and take profit as indicated for good risk reward

NZD CAD LongWait for break of Key Daily Level before entry.
Key Weekly price level is the Target.
Oscillators looking strong as we approach this Daily level.

NZDCAD Looking For A Buy IdeaIn this we are looking at the Bat Pattern Harmonic as you can see we watching the trend up
Now we wait for the pull back into the logical area ready to push up from the logical area and its also a nice 50% area of this Bat pattern B area looking left
see how we have HL trend forming beautifully on its way up to the D point this is where we wait for the pull back you possibly could sell from this area but im waiting for the pattern 50% retrace then take it on the up to continue trend
What is your thoughts........?

NZDCAD Hello Friends, I am looking for great long opportunity in this pair. As price has broken Descending wedge and started bullish corrections in range. I will be looking for structure areas where I will wait for rejections or Will wait for breakout and retest. Range structure levels are both in long favor we just need to see confirmations for good risk to reward ratio.

NZDCAD BUY AND SELL SETUP The pair is expected to buy to complete the gartley pattern
at point D. buy all dips on lower time frame to point D

NZD / JPYIf you reach our support range, be ready to buy
The price has reached the bottom of the channel

NZDCAD LongIt's pure price action and easy to understand.
Disclaimer: It's not a signal it's an idea, open positions by your own responsibility.

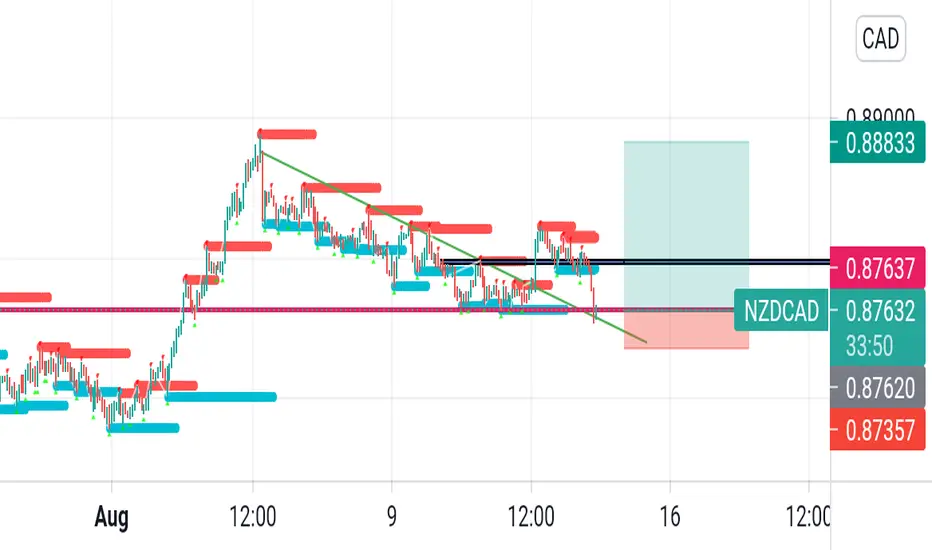
10 August: NZDCAD could see a reversal here Hi everyone, NZDCAD is seeing limited upside before it reaches resistance at 0.88390, in line with the 61.8% retracement. A reversal below this level could see a further downside to our next support target, in line with the 127.2% extension.

Update on NZDCADgood day boys and girls. Previously on my NZDCAD analysis i state that price broke out of our descending structure and we were looking to enter on a buy if it gave us a flag on either the 1HR or 15M timeframe. Instead price failed to do that and we saw a strong impusive sell on NZDCAD .
I am still bullish on NZDCAD ,even though we did not get that correction ,price is still inside our descending channel ,our structure has evolved to a descending channel as we do not marry our analysis but evolved with the market.
I am currently looking for a strong bullish reversal from where price is now which is the third touch on the descending channel followed by a continuation correction on the 15M timeframe and a buy entry on break of correction.

Wait for confirm and buy signal with NZDCADH1 time frame.
Structure: Break downtrend.
Break Key level and downtrend - retracement.
Wait for retest at Key level 0.88000 and buy signal.
Target is next resistance at 0.88800.
-----------------------------------------------------------------------------------------------
Wish you all have a good trading day!

NZDCAD TO CONTINUE WITH THE BULLSAs we have seen, price has broken above this key level with bullish pressure.
We also see a break outside the corrective downtrend.
We could see further upside on NZDCAD after a pullback.
We'll be watching for early retracements, pullbacks at key levels, any trend continuation techniques to get us in.

NZDCAD TO KEEP PUSHING LOWER?Since the deep fall from the level of 0.88700, we have seen price continue to create lower lows and lower highs to continue the downtrend.
We just recently broke below a support level at 0.87800. Until we see a break above, we remain bearish and will look for sell opportunities.
If we find a break above then we could switch out bias from bearish to bullish. New targets on this sell would be a new low along the trend.
