NZDUSD Breakout Incoming or Another Lower High Trap?NZDUSD has rallied straight back into a well-defined resistance and trendline compression zone, and this is exactly where clean trends either continue — or fail loudly. The bounce off support was strong, but the pair is still trading under descending structure, and the macro backdrop hasn’t really flipped in favor of sustained NZD strength yet. From my perspective, this is a decision area, not a momentum chase. Either we see acceptance above the ceiling and a squeeze higher, or this turns into a classic lower-high rejection with a rotation back into deeper demand.
Current Bias
Neutral to bearish
Short-term momentum is up, but price is testing a resistance cluster and descending structure. Unless price can break and hold above the upper resistance zone, the broader bias still favors rejection and another leg lower.
Key Fundamental Drivers
US side: US services PMI remains in expansion and policy is still restrictive. Even with softer ADP job growth, the Fed is not signaling fast easing — keeping USD supported on dips.
Fed expectations: Rate cuts are expected later, but timing is data-sensitive, especially inflation.
New Zealand side: NZ growth momentum remains soft relative to peers, with higher sensitivity to global risk and China-linked demand.
Risk sensitivity: NZD is one of the highest beta G10 currencies and struggles to outperform when global risk is mixed rather than trending.
Macro Context
Interest rate expectations: Fed on hold at restrictive levels; RBNZ tight but not shifting more hawkishly. Forward spread does not strongly favor NZD.
Economic growth trends: US activity is slowing but still expanding in services. China and Asia-linked demand signals are uneven — a headwind for NZD.
Commodity flows: No strong surge in soft commodities or global trade demand signals that would materially boost NZD.
Geopolitical themes: Elevated geopolitical tension keeps periodic safe-haven demand alive, indirectly favoring USD over high-beta currencies like NZD.
Primary Risk to the Trend
The biggest risk to the bearish bias is a broad USD selloff triggered by soft US CPI or weak labor data, which would compress yield expectations and fuel a breakout above resistance.
A strong global equity rally is the secondary upside risk for NZDUSD.
Most Critical Upcoming News/Event
US CPI
US labor market releases
China inflation and activity data
RBNZ communication
These will drive rate spread expectations and risk appetite — both critical for NZD.
Leader/Lagger Dynamics
NZDUSD is a clear lagger pair.
It typically follows:
AUDUSD direction
Equity indices and global risk tone
Broad USD moves led by EURUSD
It can influence:
NZD crosses like NZDJPY and EURNZD after the move is already underway.
It reacts more than it leads.
Key Levels
Support Levels:
0.5950 zone — near-term structure support
0.5850 area — secondary support band
0.5710–0.5720 major lower demand zone
Resistance Levels:
0.6060–0.6090 resistance zone (trendline + prior highs)
Above 0.6090 opens room for a squeeze leg higher
Stop Loss (SL):
Above 0.6090 for bearish setup invalidation
Take Profit (TP):
TP1: 0.5950
TP2: 0.5850
TP3: 0.5710 area
Summary: Bias and Watchpoints
NZDUSD is pressing into a heavy resistance and descending structure zone, and my bias stays neutral to bearish unless we see clean acceptance above 0.6090. The macro backdrop still leans USD-supportive with the Fed on hold and US services holding up, while NZD remains growth- and risk-sensitive. The key invalidation for the bearish view sits above the 0.6090 breakout area. Downside targets sit at 0.5950, then 0.5850 and potentially 0.5710 if risk sentiment weakens. The main event risk is US CPI — that print likely decides whether this becomes a breakout continuation or a lower-high rejection.
Nzdusdforecast

#NZD/USD Sell Trade Scenario.Here’s an up-to-date NZD/USD Sell trade outlook (technical + fundamental) to help you assess whether positioning for a Downside makes sense right now.
Thank You......

NZDUSD Buy Trading Opportunity SpottedH4 - Strong bullish move.
Currently it looks like a pullback is happening.
Until the two support zones hold I expect bullish continuation.
👉 If you enjoy this analysis, please Like, Follow, and Support the profile! Your engagement motivates us to share more quality setups.

NZDUSD - Looking To Buy PullbacksH4 - Strong bullish move.
Currently it looks like a pullback is happening.
Until the two Fibonacci support zones hold I expect the price to move higher further.
If you enjoy this idea, don’t forget to LIKE 👍, FOLLOW ✅, SHARE 🙌, and COMMENT ✍! Drop your thoughts and charts below to keep the discussion going. Your support helps keep this content free and reach more people! 🚀
--------------------------------------------------------------------------------------------------------

NZDUSD - Time To BuyNZDUSD was in a recent downtrend for the last few weeks and was struggling to stay bullish, but recently it has just broken a strong resistance trend line which it tested several times and failed to break through. NZDUSD is very likely to hit the next major resistance zone which is market as the "TAKE PROFIT" LEVEL. There are many clear signs of new bullish movements. BUY NZDUSD now.

NZDUSD: First Drop Around 150+ Pips Then 800+ Pips BuyDear traders,
I hope you’re all doing well. We have a great opportunity where we expect the price to drop around our target area. This area looks promising and safer than selling at the current price. We recommend waiting for the price to touch our target before considering a buy. Remember the market has been very volatile and risky. Consider all possibilities and whether you can afford to risk trading in this environment. Always maintain strong risk management to protect your accounts.
If you like our trading ideas, please like and comment. Also, follow us for up-to-date updates.
Team Setupsfx_
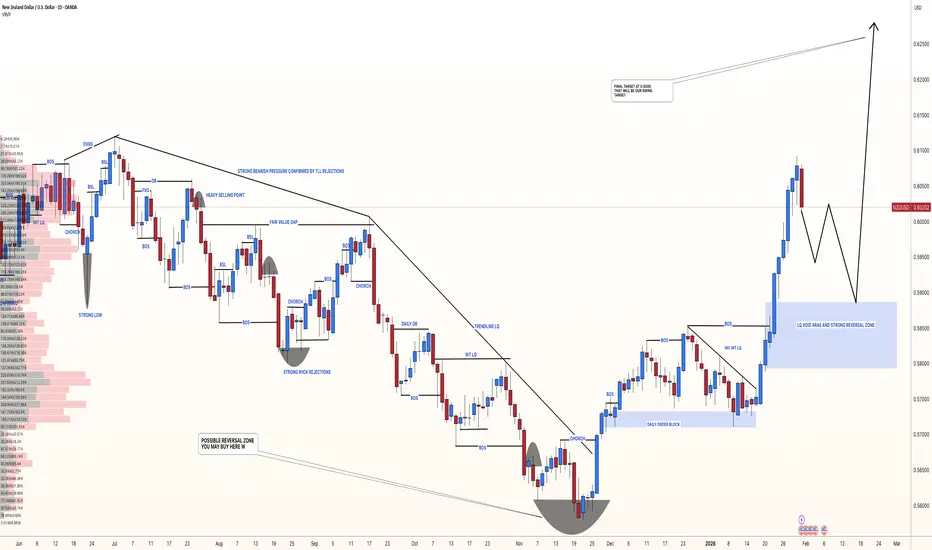
#NZDUSD: Final Drop Before Swing Bullish ReversalThe NZDUSD has dropped significantly in recent months without any proper bullish correction. Currently, the price is approaching a key level from which we believe it could finally reverse. However, as this is a swing setup, it might take months to complete. We wish you the best in trading and stay careful tomorrow.
Good luck,
Team Setupsfx_

#NZDUSD: 400+ Pips Trading Setup, Intraday+Swing TradeDear Traders,
I hope you enjoyed your weekend. We now have a fantastic opportunity to buy NZDUSD. The price is likely to continue its bullish momentum, allowing us to see a sustained uptrend from the current level. This is highly probable given the DXY’s potential further decline and NZD’s strong bullish trend over the past few weeks or months. We’ve identified two potential targets: an 400+ pip trading setup.
If you like our work, please consider liking and commenting on the idea for more.
Team Setupsfx_

NZD/USD Price Outlook – Trade Setup📊 Technical Structure
OANDA:NZDUSD NZD/USD has surged into the 0.5964–0.5975 resistance zone after a sharp impulsive rally from the prior support base. Price is now stalling and consolidating beneath this key supply area, showing signs of bullish exhaustion.
The current structure suggests a potential mean-reversion pullback after an extended upside move. Failure to break and hold above the resistance zone increases the probability of a corrective decline toward the 0.5912–0.5900 support zone, which previously acted as a demand area and now aligns with a logical retracement target.
As long as price remains capped below the resistance band, the near-term bias favors a bearish continuation.
🎯 Trade Setup (Bearish Bias)
Entry Zone: 0.5964 – 0.5975
Stop Loss: 0.5985
Take Profit 1: 0.5912
Take Profit 2: 0.5900
Risk–Reward Ratio: Approx. 1 : 2.62
📌 Invalidation
A sustained break and close above 0.5985 would invalidate the bearish setup and signal a continuation of the broader bullish trend.
🌐 Macro Background
NZD/USD has been supported by broad US Dollar weakness ahead of the Federal Reserve’s policy meeting, with the DXY slipping to a four-month low near 97.00. At the same time, stronger-than-expected New Zealand Q4 CPI at 3.1% YoY has opened the door for a potential RBNZ rate hike, further fueling the Kiwi’s upside.
However, with the Fed expected to hold rates steady this week and recent geopolitical tensions easing after President Trump softened his tariff stance, the US Dollar could stabilize in the near term. This macro backdrop supports the case for a technical pullback in NZD/USD after its steep rally into resistance.
🔑 Key Technical Levels
Resistance Zone: 0.5964 – 0.5975
Support Zone: 0.5912 – 0.5900
Bearish Invalidation: Above 0.5985
📌 Trade Summary
NZD/USD has rallied aggressively into a well-defined resistance zone and is showing signs of short-term distribution. As long as price remains below 0.5964–0.5975, the setup favours a sell-on-rallies approach, targeting a corrective move toward 0.5912–0.5900.
⚠️ Disclaimer
This analysis is for reference only and does not constitute trading advice. Financial markets involve significant risk; proper risk and position management are essential.

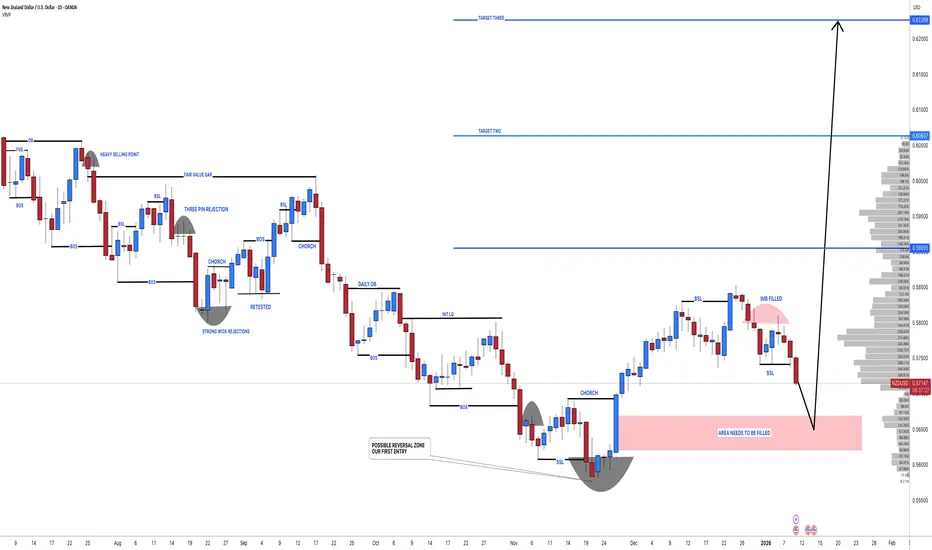
NZDUSD: Latest Chart Analysis 07/01/2026 🔺As per our previous analysis, the price was expected to maintain a bullish trend until all our targets were met. However, we have observed a shift in price behavior, and the price has now reversed, initiating a bearish trend. This presents a favorable opportunity for us, as the price decline is attributed to a previously unaddressed liquidity void.
🔺The entry zone has been clearly indicated by a red box labeled "area needs to be filled." Given the current strong bearish momentum, our entry is anticipated to become active by Monday. Once the entry is activated, the stop loss can be positioned below the designated entry zone.
🔺We have identified three target points that we believe are likely to be achieved within the next couple of months. Kindly utilize this analysis for educational purposes exclusively, and we recommend setting your take-profit levels based on your own informed judgment.
🔺If you appreciate our efforts, please consider liking and commenting for more analyses of these type.
Team SetupsFX❤️🏆
NZDUSD - Time To Buy NowNZDUSD was in a recent downtrend for the last few weeks and was struggling to stay bullish, but recently it has just broken a strong resistance trend line which it tested several times and failed to break through. NZDUSD is very likely to hit the next major resistance zone which is market as the "TAKE PROFIT" LEVEL. There are many clear signs of new bullish movements. TIME TO BUY NZDUSD now.

NZD/USD Bearish Play — Trend Reversal + Structured Sell Zones🐻 BEARISH SWING TRADE SETUP | NZD/USD "The Kiwi"
Hey Traders! 👋 Here's a detailed swing trade analysis for the NZD/USD pair, focusing on a high-probability bearish continuation play. We're using a strategic layered entry method to optimize our risk.
📈 Trade Thesis & Market Context
A bearish structure is confirmed, and price is currently exhibiting a classic pullback towards a key dynamic resistance (Moving Average). This setup aims to capture the next leg down in line with the prevailing downtrend.
⚡ The "Thief" Layered Entry Strategy
This plan uses multiple limit orders to "scale in" to the position, averaging your entry price as the pullback unfolds.
🎯 Entry Zone (Sell Limit Orders):
Layer 1: 0.56500
Layer 2: 0.56400
Layer 3: 0.56300
💡 Pro Tip: You can increase or decrease the number of layers and adjust prices based on your own capital and risk management.
🚨 Risk Management (Your Responsibility!)
Stop Loss (SL): A suggested stop loss is above the recent structure at 0.56700.
⚠️ IMPORTANT NOTE: I am NOT recommending you use only my SL. You MUST adjust your stop loss based on your personal risk tolerance, account size, and strategy. The market is unpredictable; protect your capital first!
🎯 Profit Targets (Take Profit - TP)
Primary Target (TP): 0.55900
Rationale: This target aligns with a strong support zone, oversold conditions, and a potential liquidity pool ("trap"). The goal is to "escape" with profits before any significant bounce.
⚠️ REMINDER: Just like the SL, this is a suggested target. You are free to take profits earlier or adjust based on how price action develops. Manage your own trade!
🔍 Key Correlations & Pairs to Watch
Understanding the Kiwi's relationships is crucial for this trade's context.
AUD/USD ( OANDA:AUDUSD ): 🦘 The "Aussie" and "Kiwi" are highly correlated commodity brothers. A strong downtrend in AUD/USD often reinforces bearish momentum in NZD/USD.
USD/CNH ( FX:USDCNH ): 🇨🇳 China's economy is a major driver for New Zealand's exports (especially dairy). A stronger USD/CNH (weaker Yuan) can signal risk-off sentiment and pressure the NZD.
TVC:DXY (US Dollar Index): 🇺🇸 A strong overall US Dollar, as shown by a rising DXY, provides a strong tailwind for this bearish NZD/USD setup.

NZDUSD - Buy nowNZDUSD was in a recent downtrend for the last few weeks and was struggling to stay bullish, but recently it has just broken a strong resistance trend line which it tested several times and failed to break through. NZDUSD is very likely to hit the next major resistance zone which is market as the "TAKE PROFIT" LEVEL. There are many clear signs of new bullish movements. BUY NZDUSD now.

NZDUSD - buy nowNZDUSD was in a recent downtrend for the last few weeks and was struggling to stay bullish, but recently it has just broken a strong resistance trend line which it tested several times and failed to break through. NZDUSD is very likely to hit the next major resistance zone which is market as the "TAKE PROFIT" LEVEL. There are many clear signs of new bullish movements. BUY NZDUSD now

Growth is gaining momentum: an upward wave in developmentIn its current phase, USDJPY is showing signs of gradual strengthening. After a period of consolidation, the upward movement is becoming more pronounced, and the wave structure points to the formation of a bullish scenario. Buyers maintain the initiative, limiting the depth of pullbacks.
The chart shows that the price is consolidating above local support zones, while the sequence of waves is taking on a clearer upward character. This dynamic creates the foundation for a new impulse and confirms interest in continued growth.
The fundamental backdrop also favors strengthening: demand for the dollar remains supported by expectations of a dovish Bank of Japan policy, which reinforces buyer positions and sustains upward movement.
As a result, the pair remains in a recovery phase, where the market’s next steps may confirm the formation of a sustainable bullish trend.

Is NZD/USD Ready for a Bullish Drive? WMA Breakout Validated🎯 EUR/USD "THE FIBRE" BREAKOUT SETUP | Multi-Layer Entry Strategy 📊
📈 MARKET ANALYSIS | EUR/USD SWING/DAY TRADE
Asset: EUR/USD (The Fibre)
Bias: BULLISH ✅
Setup: Triangular Moving Average Breakout + Retest Confirmed
Strategy Type: Swing/Day Trade | Multi-Layer Entry (Thief Method)
🎯 TRADE PLAN BREAKDOWN
Entry Strategy: "THIEF LAYERING METHOD" 💰
This strategy uses multiple limit orders to scale into position:
📍 Multi-Layer Buy Limit Entries:
Layer 1: 1.16400
Layer 2: 1.16600
Layer 3: 1.16800
Note: You can add more layers based on your capital allocation and risk tolerance
🛑 Stop Loss:
Thief SL: 1.16200
⚠️ Adjust based on YOUR strategy and risk management plan
🎯 Take Profit Target:
Primary TP: 1.17600 (Strong resistance + potential overbought zone)
💡 Exit Strategy: Watch for trap patterns near resistance—secure profits wisely!
⚡ KEY TECHNICAL LEVELS
Entry Zone: 1.16400-1.16800 (Multi-layer accumulation)
Stop Loss: 1.16200 (Risk management level)
Target: 1.17600 (Resistance + overbought zone)
🔗 RELATED PAIRS TO WATCH (USD CORRELATION)
Monitor these pairs for confirmation and correlation analysis:
Direct USD Pairs:
GBP/USD (Cable) 📉 - Positive correlation with EUR/USD approximately 70-80%. When Cable moves higher, it typically confirms USD weakness across the board and supports EUR/USD bullish momentum.
USD/JPY 📊 - Inverse correlation, acts as a USD strength indicator. If USD/JPY drops below 150.00, it signals USD selling pressure which benefits EUR/USD longs.
USD/CHF 🇨🇭 - Inverse correlation, serves as a risk-off sentiment gauge. When USD/CHF falls, it indicates USD weakness and supports EUR/USD upside.
EUR Cross Pairs:
EUR/GBP 🇪🇺🇬🇧 - Measures EUR strength versus GBP. Rising EUR/GBP shows Euro outperformance and confirms EUR/USD bullish bias.
EUR/JPY 📈 - Risk appetite indicator. When EUR/JPY climbs, it signals risk-on sentiment which typically supports EUR/USD gains.
EUR/CHF - Euro zone stability measure. Stable or rising EUR/CHF indicates confidence in the Eurozone economy.
💡 Correlation Key Points:
USD Index (DXY) - Watch for weakness below 106.00 for EUR/USD bullish continuation. A breaking DXY confirms broad USD selling.
GBP/USD alignment - If Cable breaks higher simultaneously, this confirms USD weakness is widespread, not just EUR strength.
USD/JPY divergence - A drop below 150.00 signals significant USD selling pressure across all pairs.
Risk Sentiment - EUR/JPY rising equals risk-on environment which generally supports EUR/USD bullish moves.
⚠️ RISK DISCLAIMER
Dear Traders (OG Thief Gang),
This is NOT financial advice—educational analysis only
ADJUST YOUR SL/TP based on YOUR risk tolerance
Money management is YOUR responsibility
Take profits at YOUR comfort zone
Never risk more than you can afford to lose
Markets can be unpredictable—trade smart! 🧠
📊 WHY THIS SETUP WORKS
✅ Triangular MA breakout confirmed
✅ Retest of breakout level completed
✅ Multi-layer entry reduces timing risk
✅ Clear risk/reward ratio defined
✅ Correlation analysis supports directional bias
📌 Remember: The market rewards patience and discipline. Trade your plan, not your emotions! 🎯💪

NZDUSD: Bullish Push to 0.593?FX:NZDUSD is eyeing a bullish rebound on the daily chart , with price approaching a key support zone near cumulative sell liquidation, converging with downward short-term and long-term trendlines that could spark upside momentum if buyers defend the level amid recent consolidation. This setup hints at a reversal opportunity after the downtrend, targeting higher levels with strong risk-reward.🔥
Entry between 0.56060–0.56780 for a long position (entry at current levels with proper risk management is recommended). Target at 0.59300 . Set a stop loss at a close below 0.55680 , yielding a risk-reward ratio of approximately 1:2.5 . Monitor for confirmation via a bullish candle close above entry with rising volume, leveraging the pair's potential recovery post-pullback.🌟
Fundamentally , NZDUSD is holding near 0.5723 as of November 28, 2025, after surging to 0.5715 following the RBNZ's 25 bps rate cut to 2.25% on November 27, with signals of no further easing ahead amid resilient labor markets and inflation concerns. The pair has risen about 2.65% since late last week from a low of 0.55910 on November 20, driven by renewed NZD strength and rising US rate cut bets that could weaken the USD further, though forecasts suggest testing support near 0.5675 with volatility persisting due to diverging central bank policies. 💡
📝 Trade Setup
🎯 Entry (Long):
0.56060 – 0.56780
🎯 Target:
• 0.59300
❌ Stop Loss:
• Daily close below 0.55680
⚖️ Risk-to-Reward:
• ~1:2.5 overall
👇 Share your thoughts below! 👇

NZDUSD - buy nowNZDUSD was in a recent downtrend for the last few weeks and was struggling to stay bullish, but recently it has just broken a strong resistance trend line which it tested several times and failed to break through. NZDUSD is very likely to hit the next major resistance zone which is market as the "TAKE PROFIT" LEVEL. There are many clear signs of new bullish movements. BUY NZDUSD Now

NZD/USD Price Outlook – Trade Setup📊 Technical Structure
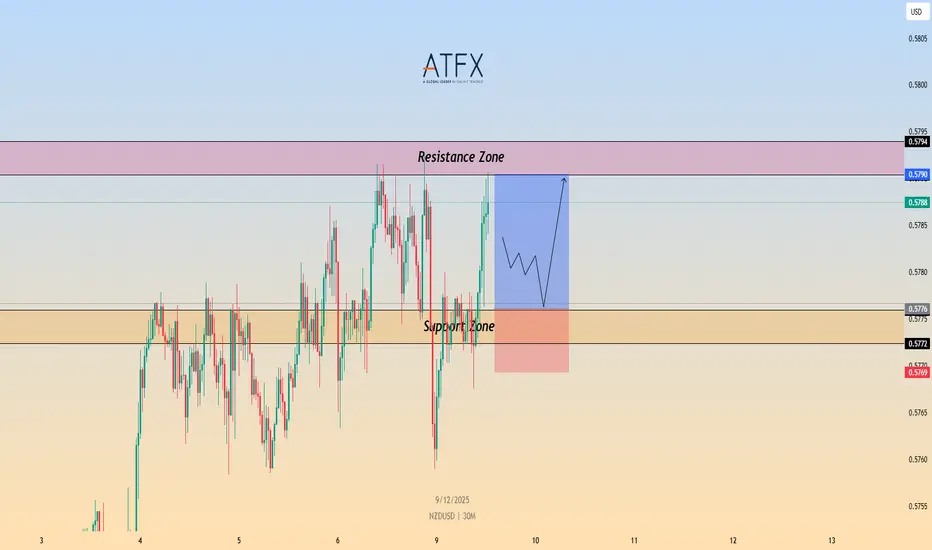
OANDA:NZDUSD NZD/USD is trading slightly softer around 0.5775, holding above the 0.5772–0.5776 support zone while repeatedly failing to sustain a break above the 0.5790–0.5794 resistance area. The pair remains range-bound ahead of major US employment data and the FOMC rate decision, with price action showing a tightening consolidation pattern.
As long as NZD/USD holds above the support band, dips may continue to attract buyers for another attempt toward the resistance zone. A clean break below 0.5769 would invalidate the bullish scenario and expose deeper downside. Conversely, a breakout above 0.5794 could trigger short-covering momentum toward higher levels.
🎯 Trade Setup
Idea: Buy dips near support and target a retest of the resistance zone.
Entry: 0.5772 – 0.5776
Stop Loss: 0.5769
Take Profit 1: 0.5790
Take Profit 2: 0.5794
Risk–Reward Ratio: ~1 : 2.12
Bullish bias remains valid as long as price holds above 0.5772–0.5776 A 30M/1H close below 0.5769 invalidates the setup.
🌐 Macro Background
Markets expect the Fed to cut rates by 25 bps on Wednesday, but traders fear a hawkish cut — meaning the Fed cuts once but signals fewer cuts ahead. This supports the USD in the short term, weighing on NZD/USD.
China, New Zealand’s largest trading partner, posted its largest trade surplus since June, reflecting stronger export performance. A strong China surplus is generally positive for the Kiwi, but this effect is being overshadowed by Fed-related USD strength.
Later today, traders will focus on the delayed US ADP four-week average and JOLTS job openings data. Stronger-than-expected numbers could further support the USD, while softer data may help NZD/USD stabilize near support.
🔑 Key Technical Levels
Resistance Zone: 0.5790 – 0.5794
Support Zone: 0.5776 – 0.5772
Invalidation Level: 0.5769 (30M/1H close below)
📌 Trade Summary
NZD/USD is consolidating below 0.5800 as markets await US employment data and the Fed decision. The technical structure supports buying dips into the support zone, targeting a move toward 0.5790–0.5794. A break below 0.5769 invalidates the bullish setup and suggests a shift in momentum.
⚠️ Disclaimer
This analysis is for reference only and does not constitute trading advice. Trading involves significant risk, and proper risk management is essential.
NZDUSD - great time to buy nowNZDUSD was in a recent downtrend for the last few weeks and was struggling to stay bullish, but recently it has just broken a strong resistance trend line which it tested several times and failed to break through. NZDUSD is very likely to hit the next major resistance zone which is market as the "TAKE PROFIT" LEVEL. There are many clear signs of new bullish movements. Time to buy NZDUSD..

NZD/USD Price Outlook – Trade Setup📊 Technical Structure
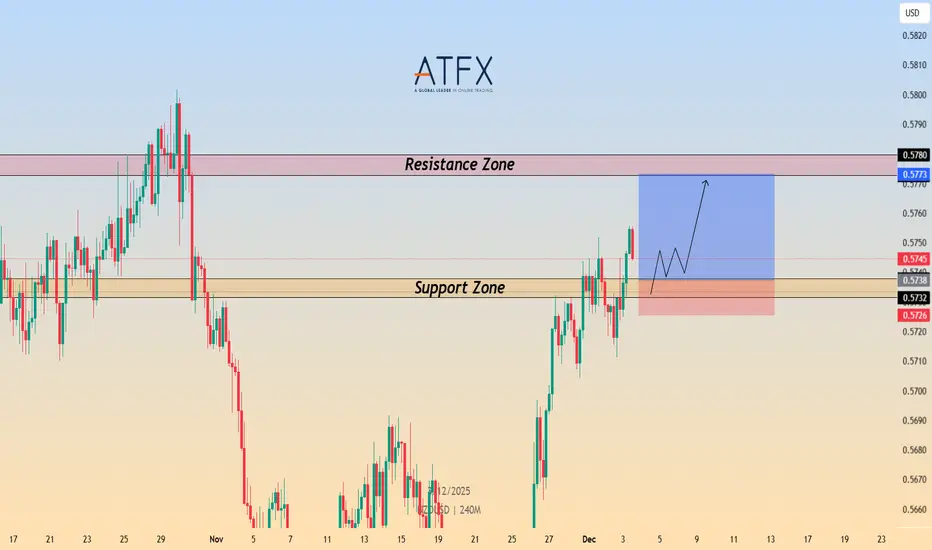
OANDA:NZDUSD NZD/USD holds firm above the 0.5738–0.5732 Support Zone, maintaining its short-term bullish structure. The pair has rebounded strongly from support and is now pressing toward the 0.5773–0.5780 Resistance Zone.
Price action shows a constructive sequence of higher lows on the 4H chart, indicating buyers are defending dips. As long as NZD/USD stays above 0.5732, the bullish outlook remains valid. A clean break above 0.5773 could open a move toward 0.5800+.
A 4H close below 0.5726 would invalidate the bullish structure.
🎯 Trade Setup
Idea: Buy dips toward support, targeting continuation toward resistance.
Entry: 0.5738 – 0.5732
Stop Loss: 0.5726
Take Profit 1: 0.5773
Take Profit 2: 0.5780
Risk–Reward Ratio: ≈ 1 : 3
Bias remains bullish above 0.5738–0.5732
🌐 Macro Background
NZD/USD rises toward 0.5750 as upbeat Chinese Services PMI data boosts risk sentiment. China remains New Zealand’s largest trading partner, making the Kiwi highly sensitive to Chinese economic performance. The November Services PMI beat expectations at 52.1, supporting NZD demand.
The Reserve Bank of New Zealand (RBNZ) delivered a widely expected 25bps rate cut last week but signalled that the easing cycle may be ending. This "less dovish" stance supported NZD on dips.
Meanwhile, US Dollar softness persists as Fed rate-cut expectations strengthen. Markets now price an 89% probability of a December rate reduction. Traders await ADP Employment and ISM Services PMI for further direction.
Overall, stronger Chinese data, a neutral-leaning RBNZ, and dovish Fed expectations favour NZD/USD upside on dips.
🔑 Key Technical Levels
Resistance Zone: 0.5773 – 0.5780
Support Zone: 0.5738 – 0.5732
Bullish Targets: 0.5773 / 0.5780
Invalidation: 4H close below 0.5726
📌 Trade Summary
NZD/USD maintains bullish momentum above the 0.5740 region, supported by upbeat Chinese data and a less-dovish RBNZ stance. With Fed rate-cut expectations weighing on USD, the setup favours buying dips toward support and targeting the 0.5773–0.5780 resistance zone. Structure remains bullish unless price closes below 0.5726.
⚠️ Disclaimer
This analysis is for reference only and does not constitute trading advice. Trading involves significant risk, and proper risk management is essential.
NZDUSD_2025-12-03_15-36-04 1.png
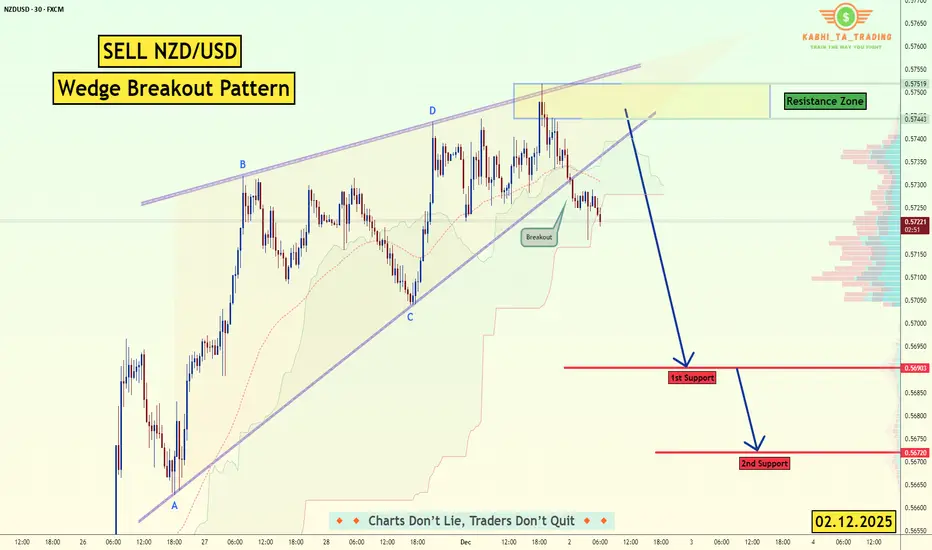
NZD/USD - Wedge Breakout (02.12.2025)📝 Description🔹 Setup Overview OANDA:NZDUSD
NZD/USD has broken below a Rising Wedge structure — a bearish continuation signal.
After retesting the lower trendline, price rejected sharply from the Resistance Zone, confirming seller strength.
Today’s fundamentals add further downside pressure, making this setup align with market sentiment.
📌 Trading Plan 📍 Bearish Scenario (Primary Plan)
Sell Opportunities: After retest of the broken wedge trendline.
Target 1: 0.5690 (1st Support)
Target 2: 0.5670 (2nd Support)
#NZDUSD #Forex #PriceAction #WedgePattern #BearishSetup #FXAnalysis #TradingView #TechnicalAnalysis #Fundamentals #USDStrength #ChartAnalysis #Kabhi_TA_Trading
⚠️ Disclaimer
This analysis is for educational purposes only — not financial advice.
Always manage your risk & use proper stop-loss levels.
👍 If you found this analysis helpful:
💬 Comment your views❤️ Like the post🔁 Share to support the work!
THE BEST TRADE IN 2025, CLEANEST PA I'VE EVER SEEN! NZDUSD!!Not gonna lie , this is the cleanest Structure i've seen and probably cleanest reversal on daily time frame in discount. So now only what i have to do is wait till pull back in daily FVG and discount and open long position till end of the year.
All information on the chart
Follow me for more interesting ideas and updates
