#OG/USDT Analysis. Long Setup#OG
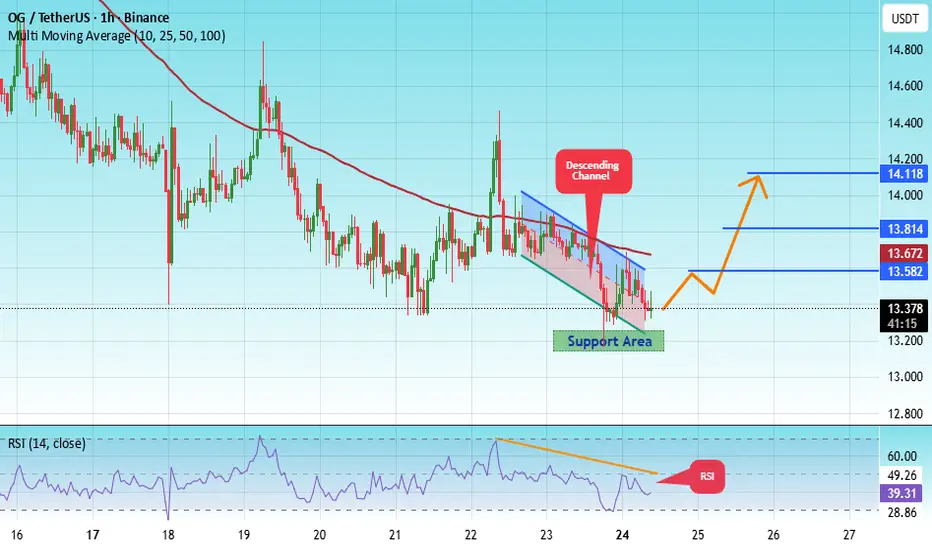
The price is moving within an ascending channel on the 1-hour timeframe and is adhering to it well. It is poised to break out strongly and retest the channel.
We have a downtrend line on the RSI indicator that is about to break and retest, which supports the upward move.
There is a key support zone in green at 13.20, representing a strong support point.
We have a trend of consolidation above the 100-period moving average.
Entry price: 13.38
First target: 13.58
Second target: 13.80
Third target: 14.10
Don't forget a simple money management rule:
Place your stop-loss order below the support zone in green.
Once the first target is reached, save some money and then change your stop-loss order to an entry order.
For any questions, please leave a comment.
Thank you.
OGUSDT
OGUSDT UPDATE#OG
UPDATE
OG Technical Setup
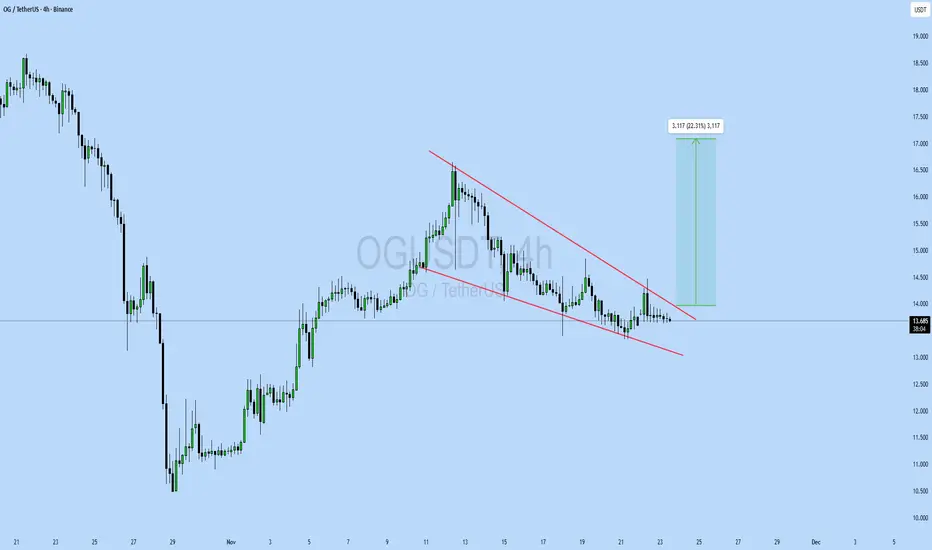
Pattern: Falling Wedge Pattern
Current Price: $13.67
Target Price: $16.78
Target % Gain: 22.31%
Technical Analysis: OG is breaking out of a falling wedge pattern on the 4H chart, showing early bullish momentum. The price has moved above the resistance trendline with steady candles forming near the breakout zone. The structure suggests a continuation toward the measured move target as long as the breakout holds and buyers maintain control.
Time Frame: 4H
Risk Management Tip: Always use proper risk management.
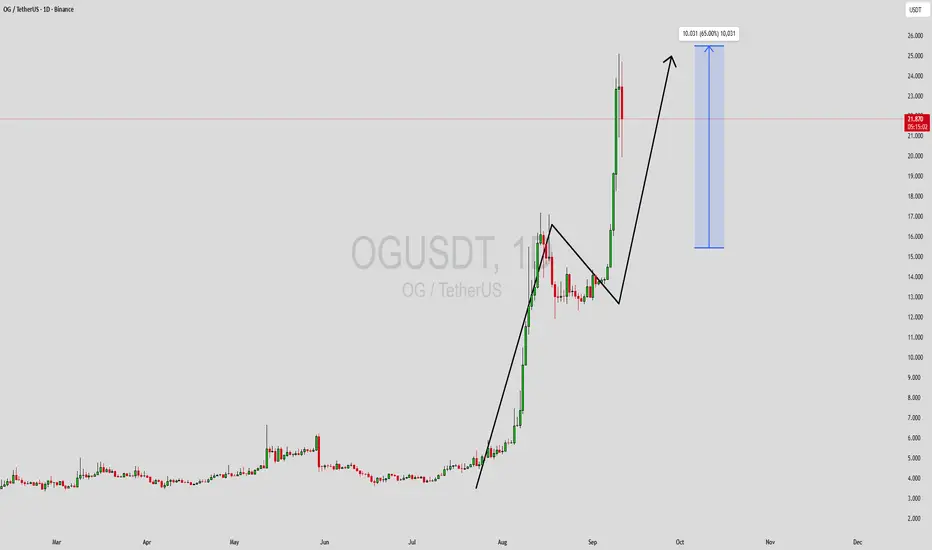
OG road map OG is trading near the upper boundary of the parallel channel formation on the weekly timeframe.The price action indicates potential for an upward breakout as momentum builds
If the resistance level breaks, we could witness a strong surge toward $70

0GUSDT Forming Bullish Wave0GUSDT is currently developing a bullish wave pattern, which is considered one of the strongest signals for an upcoming upward trend. This pattern reflects strong buying momentum building within the market, often followed by aggressive upward rallies once key resistance levels are cleared. With volume remaining healthy, the conditions for a breakout are aligning well, and technicals suggest that a potential move could deliver gains in the range of 190% to 200%+.
The bullish wave pattern typically forms during phases of consolidation where smart money accumulates positions before a major move. In the case of 0GUSDT, the price action indicates that investors are showing significant interest, creating a foundation for a possible explosive rally. Once the breakout is confirmed, it may attract even more traders into the market, pushing momentum further to the upside.
Market sentiment around this pair is steadily improving, with growing investor confidence signaling stronger market participation ahead. If momentum continues in this direction, 0GUSDT could position itself for one of the stronger bullish runs among altcoins. Traders watching for long-term opportunities may find this setup particularly compelling as it aligns with both technical strength and market enthusiasm.
✅ Show your support by hitting the like button and
✅ Leaving a comment below! (What is You opinion about this Coin)
Your feedback and engagement keep me inspired to share more insightful market analysis with you!

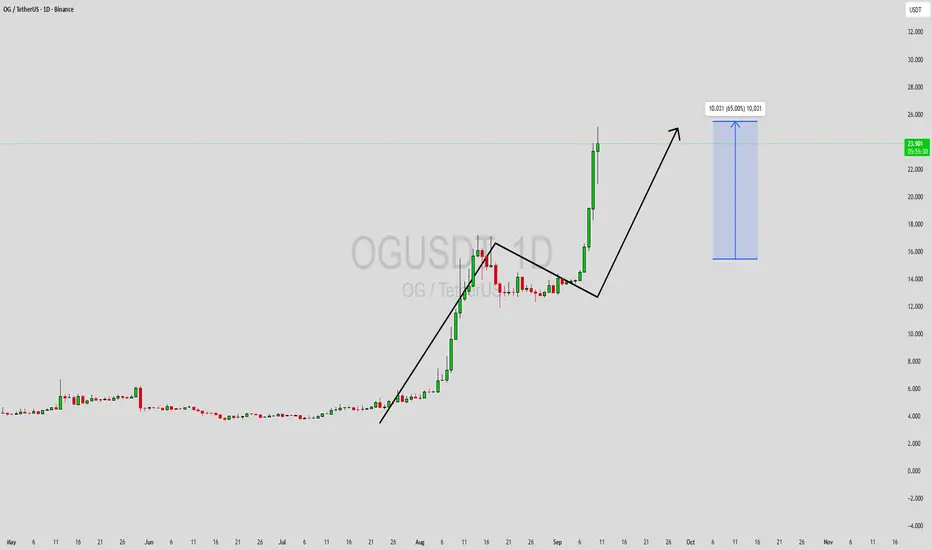
OGUSDT Forming Bullish ContinuationOGUSDT is currently displaying a strong bullish continuation setup, as seen in the recent price breakout and consolidation phase. After a massive rally, the pair entered a brief period of correction, which acted as a healthy retest before momentum returned to the upside. With strong buyer interest and a clear uptrend, the structure is pointing toward further gains, aligning with the 40% to 50%+ profit expectation.
Volume analysis supports this move, as trading activity has remained consistently strong throughout the rally. Sustained volume during bullish retracements is often a sign of smart accumulation, indicating that investors are positioning themselves for the next leg higher. The momentum breakout has confirmed renewed strength, signaling that OGUSDT is ready to push toward new resistance levels.
Investor confidence in OGUSDT continues to grow as the project gains attention in the market. The current setup provides traders with a favorable risk-to-reward ratio, especially given the clear breakout structure and potential upside targets. If momentum continues, we may see OGUSDT extend its bullish trend in the coming sessions.
✅ Show your support by hitting the like button and
✅ Leaving a comment below! (What is You opinion about this Coin)
Your feedback and engagement keep me inspired to share more insightful market analysis with you!
OG more than 4 years of accumulation!OG / USDT
Price is playing in long term accumulation between 2$ as support and 14$/16$ as resistance
Every time price hit resistance zone it rejected hard but once again we see another try to breakout with big volume
Breakout here and we will see fireworks
Keep an eye on it

Unleash the Power of $OG A Winning Trading Strategy Revealed!BINANCE:OGUSDT
Unleash the Power of SEED_ALEXDRAYM_SHORTINTEREST2:OG A Winning Trading Strategy Revealed!
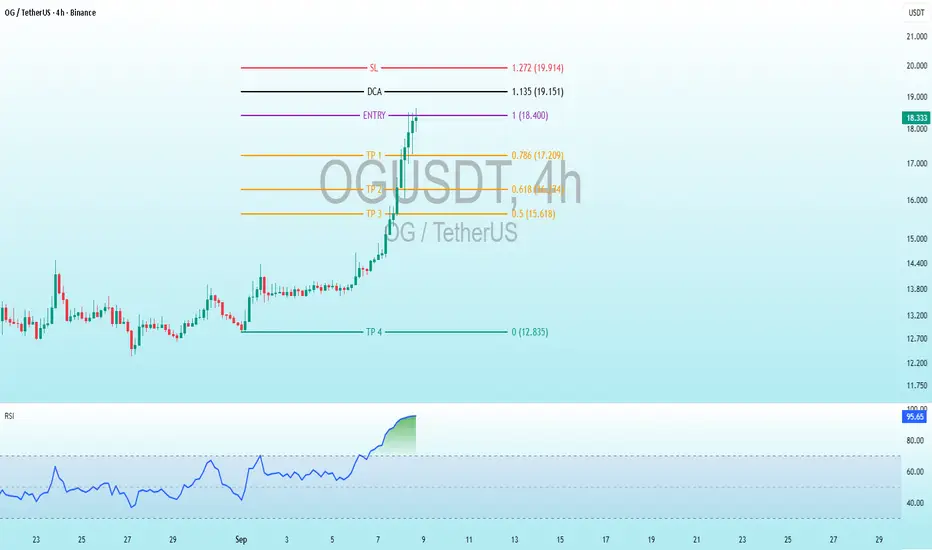
Entry Level: The suggested entry point is at 18.400 - 18.300 USDT.
Take Profit Levels (TP):
TP1: 0.786 (17.209 USDT)
TP2: 0.618 (16.274 USDT)
TP3: 0.5 (15.618 USDT)
TP4: 0 (12.835 USDT)
Stop Loss (SL): Set at 1.272 (19.914 USDT).
DCA (Dollar Cost Averaging): Additional entry at 1.135 (19.151 USDT) if the price moves against the initial entry.
Trend and Movement:
The chart shows a recent upward movement, with the price breaking above the entry level of 18.400 - 18.300 USDT.
The candlestick pattern suggests a potential continuation upward toward the TP1 level (17.209 USDT) in the short term.
RSI (Relative Strength Index):
The RSI is currently at 95.66, indicating that the asset is in the overbought territory (above 70). This suggests a potential for a pullback or consolidation soon unless the upward momentum continues strongly.
OG fan token 📌 going deliver 50x OG binance fan token analysis 📍
Pls 🙏 dyor & #nfa
Long term analysis 📌 according to wave theory 📍
Invalid below wave " C "
Accumulation zone 📌 $2.86-4.86
Target :: $18 & $35 later $70 & $100 above
Closing below wave C i keep new analysis
Pls support me ☺️ give boost to post and pls share 🙏
Pls do comment 👍

OG Strong Chart Will Yield 888% Profits Within 6 MonthsI had to choose between this one and Milan's fan token. I went with this one because the chart is different. Milan (ACMUSDT) has the same chart as Atlético de Madrid (ATMUSDT). So you know what to look for there and you can also know now that ACMUSDT too is also bullish and coming out of major market bottom and low.
OG's chart is much more different though, the bottom was hit in May 2022 with a long-term higher low in August 2024 and another higher low on the 3rd of February 2025. This is a strong pair based on TA and guess what? It is ready now for a new wave of growth.
"Higher lows lead to higher highs," is a saying that I like to repeat over and over because it sounds nice. It doesn't necessarily have to be true but it will be true this time.
Most of the Altcoins produced a lower low in April compared to February or March, the fact that OGUSDT produced a higher low in April is a signal strength. This is enough to support a bullish wave.
The four weeks of bullish consolidation (prices moving slowly higher and the sessions closing green) supports the higher low signal.
Low volume in this instance —context is always needed for a signal to be interpreted correctly—means that the real action is yet to start. Not that the "growth is weak" but rather that there is no growth yet. So this is a positive signal. The fact that the market isn't dropping and is slowly growing and consolidating will lead to a strong bullish jump.
Ok. The technical analysis and signals are in place.
Now that we are done with the technological jargon we can move to the part we like most, take profits targets (TP for short).
Spoiler alert! I use the fibonacci tool to extract my targets against all other methods because this has been proven the most accurate over the years. Period.
» The purple target at ~$43 can yield 888% profits.
» The red target at $32 can yield 634% profits.
» The blue target at $21 can give an easy 380% profits if you were to buy at the current price and sell when this target hits.
Will these target hit or will they miss?
Just wait and see.
I can assure you that the market will turn green. That's all that matters to me.
It matters to me to give you a great entry price and great timing.
You are the one that should focus on securing your profits, it is a win-win-win.
Abundance, love, wealth, health and peace.
Thanks for being with me.
When I am gone, you will miss me.
Namaste.

$OG Bearish DivergenceBINANCE:OGUSDT
Trade Setup:
Target 1: 12.422 (0.786 Fibonnaci Golden Zone).
Target 2: 10.976 (0.618 Fibonnaci Golden Zone).
Target 3: 9.959 (0.5 Fibonnaci Golden Zone).
Target 4: 5.654 (0 Fibonnaci).
DCA : 15.427 (1.135 Fibonacci)
Stop Loss: 16.607 (1.272 Fibonacci).
RSI Analysis: The RSI is showing a bearish divergence, suggesting potential bearish momentum. The current RSI is around 87.49, approaching oversold territory, so caution is advised.

OG Bearish DivergenceBINANCE:OGUSDT
Trade Setup:
Target 1: 6.714(0.786 Fibonnaci Golden Zone).
Target 2: 6.051 (0.618 Fibonnaci Golden Zone).
Target 3: 5.584 (0.5 Fibonnaci Golden Zone).
Target 4: 3.609 (0 Fibonnaci).
DCA : 8.093 (1.135 Fibonacci)
Stop Loss: 8.635 (1.272 Fibonacci).
RSI Analysis: The RSI is showing a bearish divergence, suggesting potential bearish momentum. The current RSI is around 84.67, approaching oversold territory, so caution is advised.

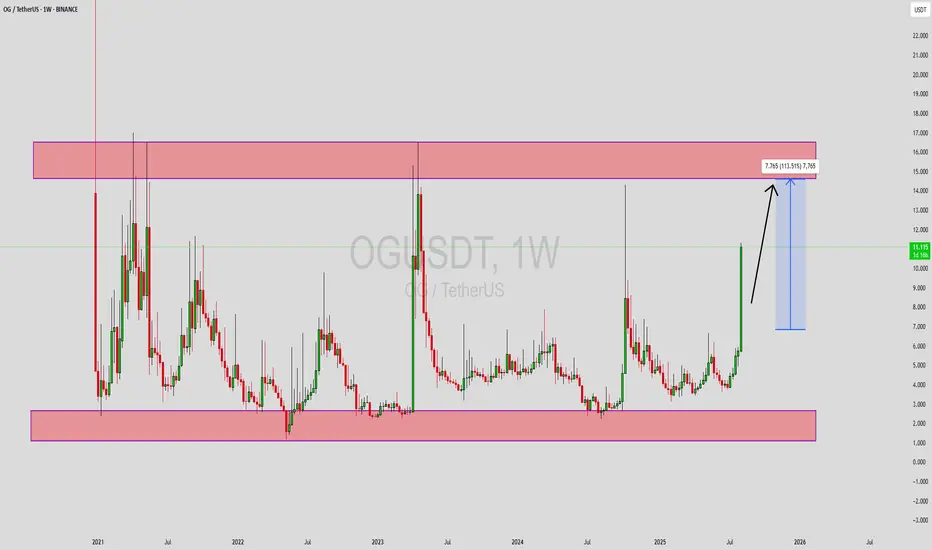
OGUSDT Forming Bullish MomentumOGUSDT is staging a compelling breakout from a multi-year range, with price now pushing sharply higher and well above a key resistance zone. The weekly chart reveals a large rectangular range defined by significant long-term support below and supply above, and OG has decisively broken the upper band with strong volume and bullish candlestick confirmation.
Technical indicators align with this expansion: OG has risen rapidly—approaching a potential 112% upside to the next major resistance area. This move is reinforced by recent breakout patterns including a falling wedge and a broadening rising wedge, signaling a transition from accumulation to a strong bullish trend. Furthermore, market volume remains elevated, validating buyer conviction on the breakout
Adding to technical strength, institutional and retail attention has surged. Notable is the launch of the OGUSDT-margined perpetual futures contract on KuCoin, offering up to 30x leverage and likely increasing speculation and liquidity in the token. Bullish engulfing patterns and momentum indicators (RSI, MACD, etc.) in higher timeframes further attest to strong upside bias
OGUSDT has emerged from a prolonged multi-year consolidation and is now rallying with conviction. The sharp breakout above resistance, underpinned by high volume, breakout structures, and fresh derivative infrastructure, sets the stage for a strong mid-term move. The target zone near $16–17 USDT represents a potential 110%+ upside if momentum sustains.
Traders should monitor retests of the breakout level for entry opportunities—proof of support here could validate continuation toward the target range.
✅ Show your support by hitting the like button and
✅ Leaving a comment below! (What is your opinion about this Coin)
Your feedback and engagement keep me inspired to share more insightful market analysis with you!
OG ANALYSIS📊 #OG Analysis
✅There is a formation of Descending Channel Pattern in daily time frame in #OG .
Also there is a perfect breakout and retest. Now we can expect a bullish move. If the price successful retest the major support zone then we will see more bullish move
👀Current Price: $5.226
🎯 Target Price : $6.152
⚡️What to do ?
👀Keep an eye on #OG price action and volume. We can trade according to the chart and make some profits⚡️⚡️
#OG #Cryptocurrency #Breakout #TechnicalAnalysis #DYOR

OG ANALYSIS🔮 #OG Analysis 🚀🚀 Update
💲 #OG is trading in a Rising Broadening Wedge Pattern and currently retesting the major support zone. Now we can expect a bullish move after the retesting of support zone.
⁉️ What to do?
- We have marked crucial levels in the chart . We can trade according to the chart and make some profits. 🚀💸
#OG #Cryptocurrency #DYOR

OGUSDT 45%-50% Gains – Bullish Momentum in PlayOGUSDT has recently broken out of a Falling Wedge Pattern, signaling the potential for significant upward movement. A Falling Wedge is a bullish continuation pattern that typically occurs during a downtrend and indicates a reversal once the price breaks through the upper boundary of the wedge. In the case of OGUSDT, the breakout has already occurred, and with good volume supporting the move, the price is poised for a potential rally. Traders are now eyeing a 45% to 50%+ gain as the breakout continues to unfold, with expectations of strong momentum pushing the price higher.
The Falling Wedge Pattern in OGUSDT has been accompanied by increasing volume, which adds validity to the breakout. Volume is a key factor in confirming the strength of the move, and with more investors entering the market, the upward momentum is likely to continue. As the price breaks above the resistance line of the wedge, it often leads to a sharp surge, providing a solid opportunity for traders to profit from the move. The price could continue to climb towards the next resistance levels, offering substantial returns for those positioned in the trade.
Investor interest in OGUSDT is on the rise, and the successful breakout from the Falling Wedge is one of the main reasons for the growing attention. This technical setup indicates that the market sentiment is shifting from bearish to bullish, with buyers now in control. As the price continues to build on the breakout, traders are anticipating further price action that could lead to a strong rally. The projected 45% to 50%+ gain is a realistic target if the breakout holds and the bullish trend continues to develop.
As always, it is important for traders to monitor key levels of support and resistance to gauge the strength of the trend. The next few days or weeks will be crucial in determining whether OGUSDT can maintain its upward trajectory and reach the expected gains. With good volume, solid investor interest, and a well-formed technical setup, OGUSDT is one of the more promising crypto pairs to watch for a potential breakout and substantial profits.

OGUSDT %180 Daily Volume Spike | Watch Out!OGUSDT Analysis: Carefully Selected Blue Boxes
OGUSDT has seen a 182% daily volume increase , signaling heightened activity. While the chart appears volatile, I’ve marked blue boxes as logical and carefully chosen zones for potential entries.
Key Points:
Blue Boxes: These areas are determined using tools like volume footprint, volume profile, cumulative delta volume (CDV), and liquidity heatmaps .
Risk Management: Current market conditions are uncertain. Employ cautious and well-structured risk management.
Confirmation Indicators: Entries should be validated with CDV, liquidity heatmaps, volume profiles, volume footprints (with evident buyer activity), and upward market structure breaks in lower time frames .
If this analysis helps you, please don't forget to boost and comment. Your support motivates me to share more!
If you think this analysis helps you, please don't forget to boost and comment on this. These motivate me to share more insights with you!
I keep my charts clean and simple because I believe clarity leads to better decisions.
My approach is built on years of experience and a solid track record. I don’t claim to know it all, but I’m confident in my ability to spot high-probability setups.
If you would like to learn how to use the heatmap, cumulative volume delta and volume footprint techniques that I use below to determine very accurate demand regions, you can send me a private message. I help anyone who wants it completely free of charge.
My Previous Analysis (the list is long but I think it's kinda good : )
🎯 ZENUSDT.P: Patience & Profitability | %230 Reaction from the Sniper Entry
🐶 DOGEUSDT.P: Next Move
🎨 RENDERUSDT.P: Opportunity of the Month
💎 ETHUSDT.P: Where to Retrace
🟢 BNBUSDT.P: Potential Surge
📊 BTC Dominance: Reaction Zone
🌊 WAVESUSDT.P: Demand Zone Potential
🟣 UNIUSDT.P: Long-Term Trade
🔵 XRPUSDT.P: Entry Zones
🔗 LINKUSDT.P: Follow The River
📈 BTCUSDT.P: Two Key Demand Zones
🟩 POLUSDT: Bullish Momentum
🌟 PENDLEUSDT.P: Where Opportunity Meets Precision
🔥 BTCUSDT.P: Liquidation of Highly Leveraged Longs
🌊 SOLUSDT.P: SOL's Dip - Your Opportunity
🐸 1000PEPEUSDT.P: Prime Bounce Zone Unlocked
🚀 ETHUSDT.P: Set to Explode - Don't Miss This Game Changer
🤖 IQUSDT: Smart Plan
⚡️ PONDUSDT: A Trade Not Taken Is Better Than a Losing One
💼 STMXUSDT: 2 Buying Areas
🐢 TURBOUSDT: Buy Zones and Buyer Presence
🌍 ICPUSDT.P: Massive Upside Potential | Check the Trade Update For Seeing Results
🟠 IDEXUSDT: Spot Buy Area | %26 Profit if You Trade with MSB
📌 USUALUSDT: Buyers Are Active + %70 Profit in Total
🌟 FORTHUSDT: Sniper Entry +%26 Reaction
🐳 QKCUSDT: Sniper Entry +%57 Reaction
📊 BTC.D: Retest of Key Area Highly Likely
I stopped adding to the list because it's kinda tiring to add 5-10 charts in every move but you can check my profile and see that it goes on..

$OG- Daily Bullish PullSEED_ALEXDRAYM_SHORTINTEREST2:OG - Daily Bullish pull on the D chart. Lower Bollinger squeezed for a pull on top. #DYOR ofcourse.

OGUSDT good volume on 4HOG still has good upward volume on the 4H chart. However, on the 1H chart, volume is weakening, indicating buying weakness. One could enter during the dip at 8.3 and 7.5 before it potentially goes up to 14. In my opinion, this is highly likely, but anything can happen in the market as crypto is very volatile. Manage your risk properly.

OG Price Prediction. Global liquidity zonesGlobally chart looks like one big range since 2020 CRYPTO:OGUSD
Possible Targets and explanation idea
➡️Downtrend line by line chart since 2020 will be retested soon and most likely we will sweep target 1
➡️Next target will be sweep ath and new ath by market cap! this is still Low cap coin with mc under 50m
➡️Historically after retest fundamental value last line my take profit indicator we pumped! and this time its happened again. Price for retest marked
➡️I dont like we didnt see main money inflow on W tf for this pump!
➡️Track updates and signals with my set
Hope you enjoyed the content I created, You can support with your likes and comments this idea so more people can watch!
✅Disclaimer: Please be aware of the risks involved in trading. This idea was made for educational purposes only not for financial Investment Purposes.
---
• Look at my ideas about interesting altcoins in the related section down below ↓
• For more ideas please hit "Like" and "Follow"!

OGUSDT (OGFanToken) Updated till 06-10-24OGUSDT (OGFanToken) Daily timeframe range. finally it got out of its local low. now aiming at 5.355 depends on retail interest if it can push through. atleast staying above 4.116 can give it more chances. recent support at 3.283.

OG ANALYSIS (1D)🔮 #OG Analysis 💰💰
🌟🚀 #OG is trading in a Symmetrical Triangle Pattern. The price is currently trading in a small zone between descending and ascending trendline and a good bullish moment will be confirmed after a good breakout. 🚀🚀
🔖 Current Price: $4.268
⏳ Target Price: $5.677
#OG #Cryptocurrency #DYOR

#OG/USDT#OG
The price is moving within a 12-hour downtrend channel and is strongly committed to it.
We have a support area at 4.00 and we bounced from it at the lower border of the channel
We have a tendency to stabilize above the Moving Average 100
We have an uptrend on the RSI indicator that supports the rise
Entry price is 4.20
The first target is 4.70
Second goal 5.07
Third goal 5.47
