Crude Oil (USOIL) OutlookTechnical Analysis: USOIL (Crude Oil)
Feb 11, 2026
Pivot Point: 63.85 The price is currently trading and stabilizing above the 63.85 level, which maintains a positive outlook for the session.
Bullish Scenario (Primary)
As long as the price remains sustained above the pivot point of 63.85, the momentum is bullish:
First Target: Reaching the resistance level at 64.90.
Second Target: A successful breakout above this level will clear the path toward 65.20.
Bearish Scenario (Alternative)
If the price pulls back and closes firmly below the 63.85 pivot point (specifically on the hourly timeframe):
The trend will shift to negative/bearish.
Downside Target: A break below the pivot will target the next support level at 62.65.
Summary:
Above 63.85: Momentum is strongly Bullish.
Below 63.85: Trend shifts to Bearish.
Oilforecast

USOIL Daily Update: Primary Targets and Key Pivot LevelsTechnical Analysis: USOIL (Crude Oil) – 10/2/2026
Pivot Point: 63.85 Based on current price action, the price has successfully stabilized above this level. This indicates buying pressure and a directional shift toward a bullish trend.
Bullish Scenario (Primary)
As long as the price remains and trades above the pivot point of 63.85, the trend is upward:
First Target: Reaching the resistance level at 64.65.
Second Target: If the price breaks above this resistance, it is expected to advance toward 65.20.
Bearish Scenario (Alternative)
If the price pulls back and closes firmly below the 63.85 pivot point (specifically on the hourly timeframe):
The outlook will turn negative, with the first target being 62.40.
If this support is broken, the price may drop further toward 61.40.
Summary:
Above 63.85: Momentum is strongly Bullish.
Below 63.85: Trend shifts to Bearish.

Oil Price at a Crossroads: Will the 63.45 Support Hold ?
📊 USOIL (WTI) Technical Analysis - Feb 6, 2026
📍 Pivot Point: 63.45 The price is currently hovering around the pivot level, which serves as the decisive zone for the next market trend.
📉 Bearish Scenario (Primary Outlook)
As long as the price remains below the pivot point of 63.45, the bearish momentum is expected to dominate:
🎯 Target 1: A drop toward the first support at 62.40.
🎯 Target 2: A breakout below 62.40 will push the price further down to the 61.40 zone.
📈 Bullish Scenario (Alternative Outlook)
If the price manages to break above the 63.45 pivot and stabilizes, the trend will shift to bullish:
🚀 Target 1: A recovery toward the resistance level at 64.65.
🚀 Target 2: Breaking above 64.65 will pave the way for 65.20 and potentially 65.95.
🔍 Key Takeaways:
Below 63.45: The trend remains Bearish.
Above 63.45: The trend shifts to Bullish.

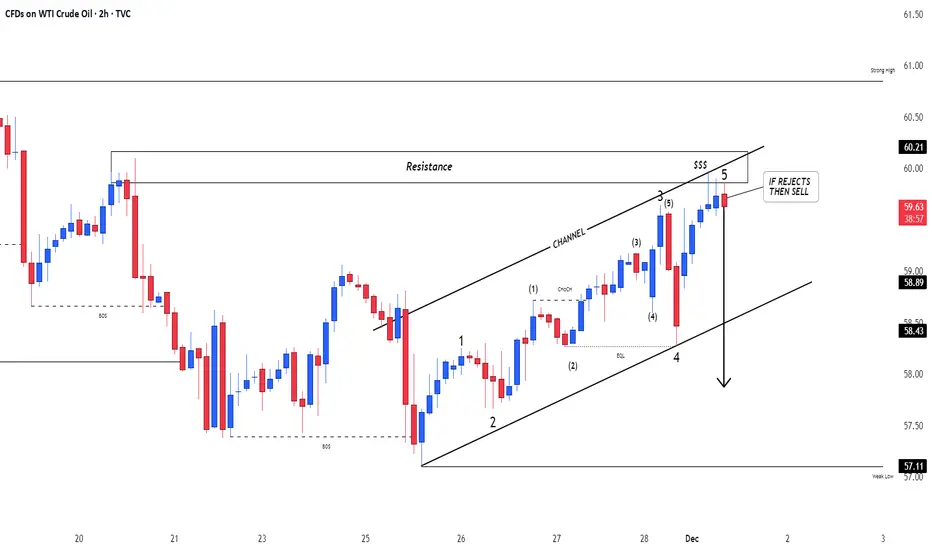
US OilCrude Oil
- Completed " 12345 " Impulsive Waves
- Break of Structure
- RSI - Divergence
- Double Bottom as an corrective pattern in Short Time Frame
- Fibonacci Level - 61.80% / 78.60%

Possible Bullish Uptrend channel OIL Price Next Months According to Fundamental Geopolitics events
According to Risk of World War
According to technical analysis, the end of the corrective wave is at the 50-60% Fibonacci retracement.
Convergence on CCI

Crude Oil – Sell around 58.50, with a target of 56.00-55.00Crude Oil Market Analysis:
Recent crude oil buying has been largely ineffective. Despite support from fundamentals and data, there has been little upward movement, only small fluctuations. Sell crude oil at 58.50 today. The chart pattern indicates short-term consolidation, with resistance around 60.00. A break above 62 might open new buying opportunities; otherwise, the outlook remains bearish.
Fundamental Analysis:
The previous ADP employment data has reassured the market, and expectations for the non-farm payrolls report have largely been priced in.
Trading Recommendation:
Crude Oil – Sell around 58.50, with a target of 56.00-55.00.

Sell crude oil around 58.50, with a target of 57.00-55.00Crude Oil Market Analysis:
Recent crude oil data and fundamentals support buying opportunities, but crude oil is still slowly declining. The outlook remains bearish today; sell on rallies. Watch the minor resistance level at 58.50. A break below 55.00 would open up further downside potential. If this level is broken, consider selling.
Fundamental Analysis:
Yesterday's ADP employment data was -2.9, compared to an expected 4.7 and a result of 4.1. While this appears bullish in the short term, it actually signals a sell opportunity. Good employment data tends to cause gold to fall. Crude oil's EIA inventory data also fell to -338, compared to an expected 44.
Trading Recommendation:
Sell crude oil around 58.50, with a target of 57.00-55.00.

Crude Oil – Sell around 58.60, target 56.00-55.00Crude Oil Market Analysis:
The fundamentals have had a significant impact on crude oil over the past two days, but crude oil seems to have become desensitized to these fundamentals, showing little reaction. The market is maintaining a relatively calm, small-scale consolidation. Our strategy for today remains bearish; sell on rallies. The daily moving averages are starting to diverge. For buying opportunities, pay attention to the 55.00 level. If it breaks, we expect a significant sell-off.
Fundamental Analysis:
Today, we will focus on the ADP employment data and the EIA crude oil inventory data.
Trading Recommendation:
Crude Oil – Sell around 58.60, target 56.00-55.00

Crude OilU.S Oil
- Sell Side Liquidity
- Break of Structure
- Bearish Channel as an corrective pattern in Short Time Frame
- Fair Value Gap
- IDM
- Order Block

Crude OilU.S Oil
- Symmetrical Triangle as an corrective pattern in Long Time Frame
- Break of Structure
- Impulse Correction
- Demand Zone
- Change of Characteristics

CRUDE OIL (CL) PREDICTIONCRUDE OIL (CL) PREDICTION
📊 Market Sentiment
Crude oil prices had been trending lower following signs of de-escalation in the Israel–Palestine conflict, easing tensions with Iran, and emerging peace signals from the Russia–Ukraine front.
However, recent statements from Trump and the possibility of a U.S. military action against Venezuela have shifted sentiment back to the upside.
Venezuela holds approximately 18% of the world’s proven oil reserves and ranks as the 12th largest oil producer globally. Any potential conflict involving the U.S. could significantly disrupt supply expectations, acting as a strong bullish catalyst for oil prices.
📈 Technical Analysis
CL swept monthly liquidity around the $55 level and has since shifted into a bullish structure on the daily timeframe.
In my view, this move indicates that price has gathered sufficient energy for either continuation higher or a controlled retracement before the next bullish leg.
📌 Prediction – Game Plan
I entered a long position at 56.24$.
🎯 TP1: 57.70$
I will take partial profits here and move the remaining position to breakeven.
🎯 TP2: 58.90$
🛑 Stop Loss: Daily close below 55.40$
💬 For deeper sentiment and strategy insights, subscribe to my Substack free access available.
This analysis is for educational purposes only and does not constitute financial advice. Always conduct your own research before trading or investing.

Crude Oil – Sell around 58.90, target 57.00-56.00Crude Oil Market Analysis:
The recommended strategy for today is to sell crude oil. Recent crude oil price fluctuations have been relatively small, and the fluctuations are mostly within a consolidation phase. The recommended strategy is to sell, as chasing this range-bound market is not advisable. Wait for a rebound to a higher point before considering selling. Today, pay attention to the levels around 58.90 and 59.50.
Fundamental Analysis:
These past few days have been a holiday, with few major data releases. However, the escalating US-Venezuela relations and the worsening Russia-Ukraine situation are providing short-term geopolitical support, significantly benefiting gold prices.
Trading Recommendation:
Crude Oil – Sell around 58.90, target 57.00-56.00

Crude Oil – Sell around 59.20, target 56.00-55.00Crude Oil Market Analysis:
Crude oil has started a slight rebound, but it hasn't broken through the 55 level effectively. Today's strategy remains to sell on rallies and be bearish. Continue selling on rallies. Resistance for crude oil is around 59.20; consider selling near that level. If crude oil breaks above 59, it indicates a return to a consolidation phase. The recent escalation of the Russia-Ukraine conflict is supporting buying opportunities in crude oil.
Fundamental Analysis:
The Russia-Ukraine conflict shows signs of escalation again, providing some support for gold. Pay attention to the holiday situation in the next few days.
Trading Recommendation:
Crude Oil – Sell around 59.20, target 56.00-55.00

Crude Oil – Sell around 58.40, target 56.00-55.00Crude Oil Market Analysis:
The daily chart for crude oil continues to show a bearish trend. Sell on rallies. In the Asian session, watch for a short position around 58.40, which acts as minor resistance. A stronger resistance level is around 59.60. The overall trend for crude oil is bearish, with short-term consolidation expected. Recent data releases have had limited impact on crude oil.
Fundamental Analysis:
The recent rise in gold prices is no longer significantly related to data releases. It's essentially a long-awaited breakout from a high level after a period of consolidation. The previously released bullish data was merely a catalyst, and the upcoming days are filled with European and American holidays.
Trading Recommendation:
Crude Oil – Sell around 58.40, target 56.00-55.00

Crude Oil – Sell around 58.60, target 56.00-55.00Crude Oil Market Analysis:
Given the recent sharp decline on the daily chart for crude oil, our strategy remains unchanged: sell on rallies. We've maintained a bearish outlook on crude oil for several months, during which it has remained relatively stagnant, trading within a narrow range. Today, we'll focus on contract settlement; wait for a rebound to around 58.60 to sell.
Fundamental Analysis:
Today's release of key CPI and unemployment claims data could significantly impact the market.
Trading Recommendation:
Crude Oil – Sell around 58.60, target 56.00-55.00

Crude OilU.S Oil
- Completed " 13245 " Impulsive Waves
- Break of Structure
- RSI - Divergence
- Order Block
- Bearish Channel as an corrective pattern in Short Time Frame

CRUDE OIL LONG TERM OUTLOOK . IS NEXT ENERGY CRISIS AHEAD?expecting oil prices to reach new record highs through yr 2030.
trade carefully.

Crude Oil Sell around 59.00.target 58.00 to 56.00Crude Oil Market Analysis:
Recent crude oil price movements have been essentially free money; there's no easy analysis to follow. The key is to wait for the right entry point. Sell when the price reaches the expected rebound level. Conversely, as long as it doesn't break 60.50, it remains extremely weak. Crude oil is bearish, and short-term fluctuations don't change the overall bearish trend. Sell at 59.00 today.
Fundamental Analysis:
The Fed's interest rate decision was in line with market expectations. The rate cut didn't bring much surprise to the market, except for the official announcement of further rate cuts in 2026, which was somewhat unexpected. In the long term, this will weaken the dollar and support gold.
Trading Recommendation:
Crude Oil – Sell around 59.00, target 58.00-56.00

US OilCrude Oil
- Double Bottom in Long Time Frame
- RSI - Divergence
- Fair Value Gap
- SSL
- Bearish Channel as an corrective pattern in Short Time Frame

Will Crude Oil Rise or Fall?Crude Oil Futures (Jan 2026) - Market Analysis
Crude oil is trading at $58.39 per barrel, down 0.19%. Recent data show prices ranging from $58.12 to $58.62, indicating a period of consolidation. Key support is forming around $58.12, while resistance is at $58.62.
The overall momentum suggests limited near-term volatility, with the price hovering near its recent lows. Traders should watch for a breakout above resistance or a drop below support for the next directional move.
Stay tuned for further updates as market conditions evolve, and always manage risk
appropriately when trading futures.
#crudeoil #oilprices #trading #commodities #marketanalysis

Crude OilU.S Oil
- Bullish Channel as an corrective pattern in Short Time Frame
- Resistance Level
- Change of Characteristics
- Completed " 12345 " Impulsive Waves
- Order Block
US OilCrude Oil
- Order Block
- Falling Wedge as an corrective pattern in Long Time Frame
- RSI -Divergence
- Demand Zone
- Completed " 1234 " Impulsive Waves

WTI Oil Market Outlook: Sell Zones & Key LevelsOil is still respecting a broader downtrend structure with consistent lower highs and lower lows. Price recently reacted from the $62–63 resistance zone (trendline + supply) confirming another lower high and maintaining bearish momentum. As long as oil stays below this zone the chart suggests a continuation toward the downside with next supports sitting near $56.30, $52.50 and potentially $50.00 if bearish pressure accelerates.
Only a clean breakout above $63 with strong candles would invalidate this bearish outlook and shift momentum toward the $66–70 zone.
🔻 Sell Setup 1
- Entry Zone: 62.00 – 63.00
- Stop Loss: 63.80
- Targets: TP1 59.00, TP2 56.30, TP3 52.50
🔻 Sell Setup 2
- Entry: Break below 57.50 and retest
- Stop Loss: 59.20
- Targets: TP1 56.30, TP2 52.50, TP3 50.00
Note
Please risk management in trading is a Key so use your money accordingly. If you like the idea then please like and boost. Thank you and Good Luck!
