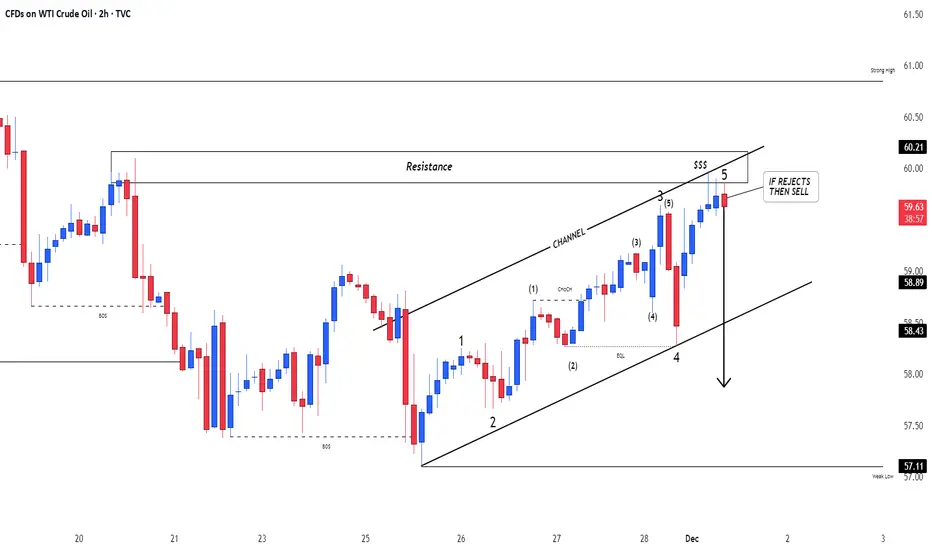
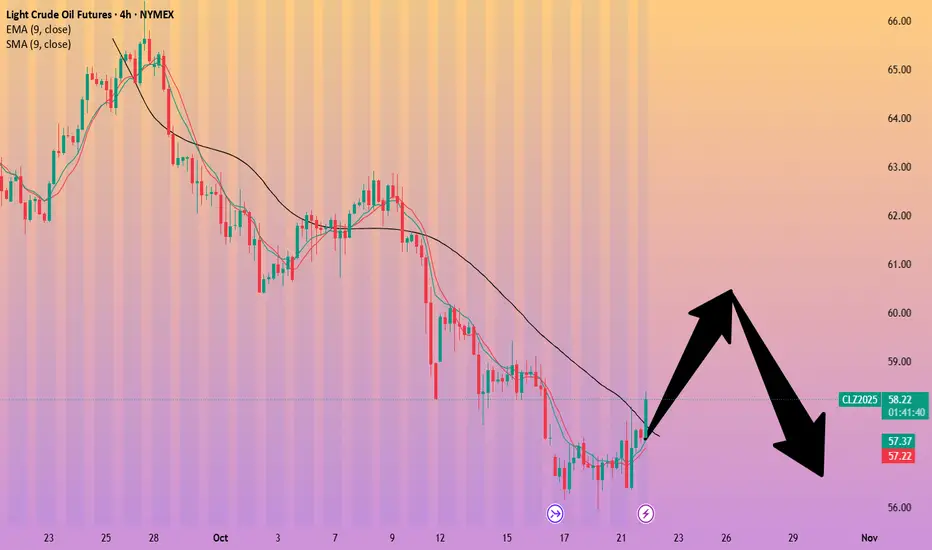
Crude OilU.S Oil
- Bullish Channel as an corrective pattern in Short Time Frame
- Resistance Level
- Change of Characteristics
- Completed " 12345 " Impulsive Waves
- Order Block
Oilshort!
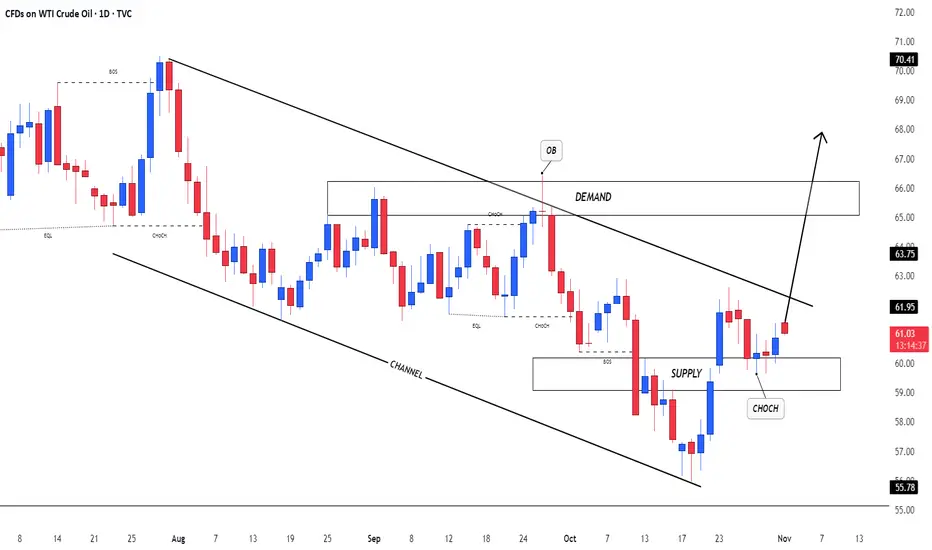
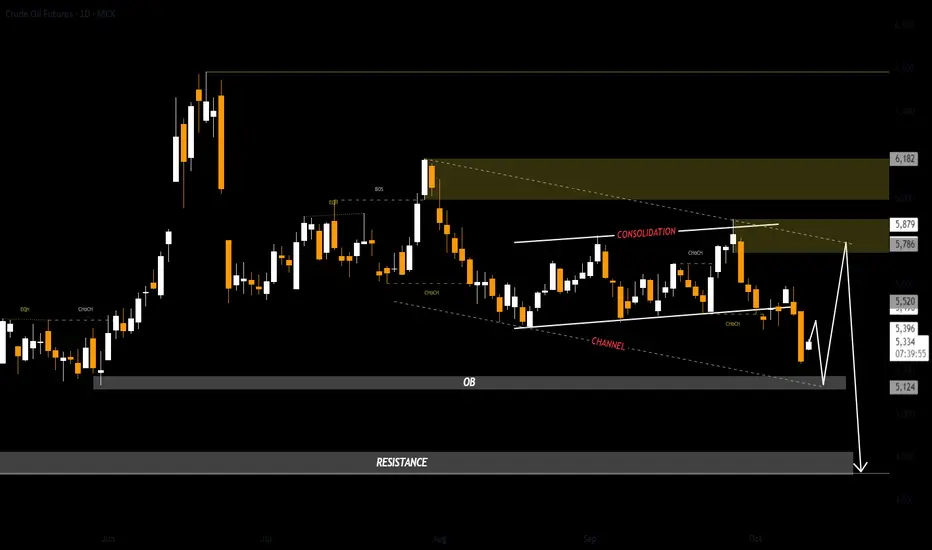
US OilCrude Oil
- Order Block
- Falling Wedge as an corrective pattern in Long Time Frame
- RSI -Divergence
- Demand Zone
- Completed " 1234 " Impulsive Waves

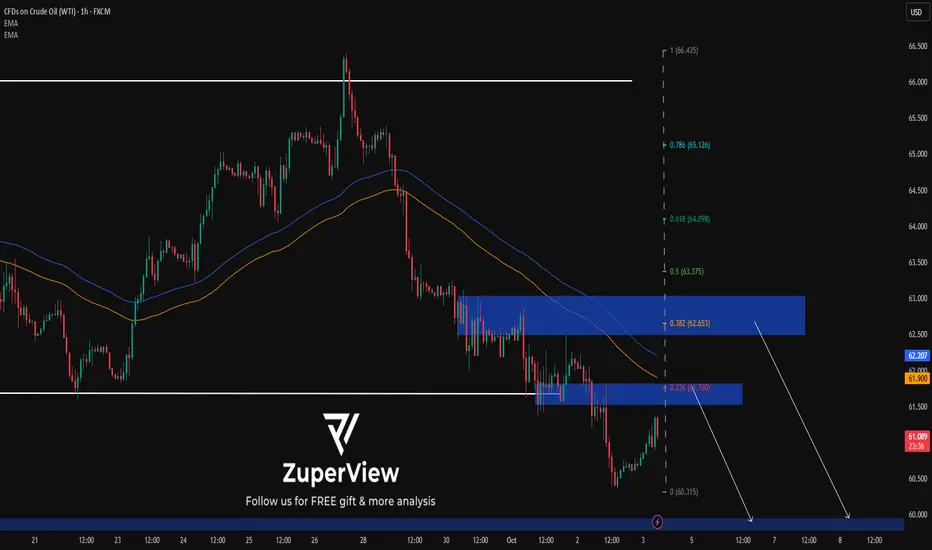
WTI Oil Market Outlook: Sell Zones & Key LevelsOil is still respecting a broader downtrend structure with consistent lower highs and lower lows. Price recently reacted from the $62–63 resistance zone (trendline + supply) confirming another lower high and maintaining bearish momentum. As long as oil stays below this zone the chart suggests a continuation toward the downside with next supports sitting near $56.30, $52.50 and potentially $50.00 if bearish pressure accelerates.
Only a clean breakout above $63 with strong candles would invalidate this bearish outlook and shift momentum toward the $66–70 zone.
🔻 Sell Setup 1
- Entry Zone: 62.00 – 63.00
- Stop Loss: 63.80
- Targets: TP1 59.00, TP2 56.30, TP3 52.50
🔻 Sell Setup 2
- Entry: Break below 57.50 and retest
- Stop Loss: 59.20
- Targets: TP1 56.30, TP2 52.50, TP3 50.00
Note
Please risk management in trading is a Key so use your money accordingly. If you like the idea then please like and boost. Thank you and Good Luck!

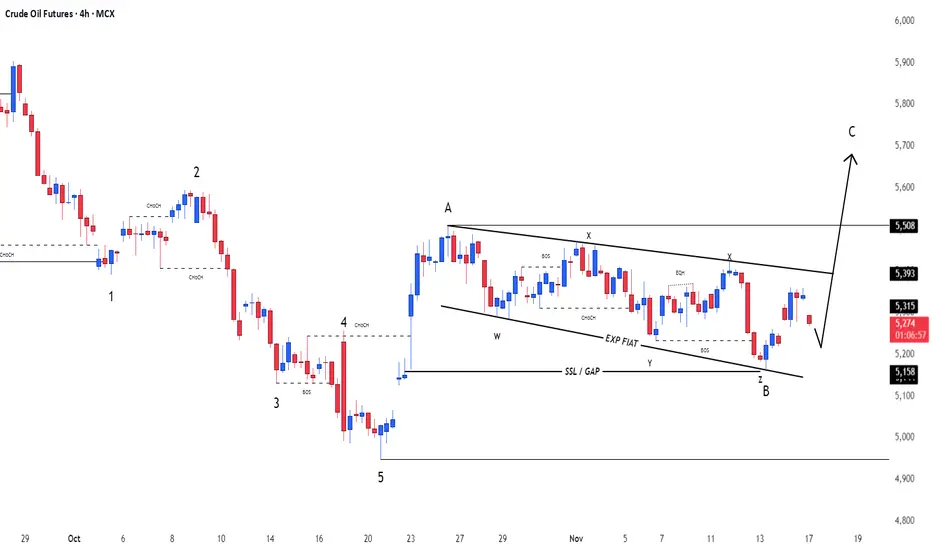
Crude OilU.S Oil Index
- Exp Fiat as an corrective pattern in Short Time Frame
- Break of Structure
- Completed " 12345 " Impulsive Waves and " AB " Corrective Waves
- Sell Side Liquidity
- Order Block
Crude Oil – Sell around 61.00, target 60.00-58.00Crude Oil Market Analysis:
Continue to sell on rallies, as the market is bearish. Sell on any rebounds. The daily chart shows a downward trend, with buying pressure failing. Continue selling on today's rebounds. The crude oil inventory data hasn't changed the overall trend. Short-term fluctuations are expected, but the long-term trend remains bearish. The strategy is relatively simple: continue selling. The new major resistance level for crude oil is around 62.00.
Fundamental Analysis:
Today's NFP employment data will change market expectations for the Federal Reserve's monetary policy. However, in the long term, the possibility of further interest rate cuts is greater.
Trading Recommendation:
Crude Oil – Sell around 61.00, target 60.00-58.00.

Crude Oil – Sell around 61.00, target 58.00-57.00Crude Oil Market Analysis:
Crude oil is currently consolidating on the daily chart. Continue to sell on rallies. Our overall strategy remains bearish, and trading has been within a small range. Daily price fluctuations are limited, and we're not using a contract range-bound strategy. We recommend selling at higher prices. Yesterday's crude oil inventory data did not change the overall direction of crude oil. Sell again around 61.00 today.
Fundamental Analysis:
Yesterday's ADP employment data was 4.8%, compared to a previous forecast of -2.9. The positive data is generally considered favorable for selling gold, but gold only saw a small rebound with limited impact.
Trading Recommendation:
Crude Oil – Sell around 61.00, target 58.00-57.00

US OilCrude Oil Index
- Bearish Channel as an corrective pattern in Short Time Frame
- RSI - Divergence
- Supply Zone
- Change of Characteristics
- Order Block
Crude oil: Sell around 62.50, target 60.00-58.00Crude Oil Market Analysis:
Crude oil fell again, in line with our expectations. Today's crude oil price remains bearish. Sell on any rebound. The strategy for crude oil remains to follow the market. Consider selling if crude oil rebounds to 62.50 today. This level has been successfully suppressed. The impact of crude oil inventory data is only temporary. There are no recent data that will have a significant impact on crude oil prices. Focus on the impact of the Federal Reserve's monetary policy.
Fundamental Analysis:
The previous smooth Sino-US trade negotiations were positive for the US dollar, leading to a sharp drop in gold's safe-haven sentiment. Another major data point this week is the Federal Reserve's monetary policy.
Trading Recommendations:
Crude oil: Sell around 62.50, target 60.00-58.00.
Crude oil: Sell near 63.00, targeting 60.00-58.00Crude Oil Market Analysis:
Crude oil has been volatile, with few significant unilateral moves. Today, we're focusing on short-term rebound opportunities. We recommend selling high and taking a bearish stance. The impact of crude oil fundamentals and news is short-lived. Previous inventory data support buying, but we should still sell as crude oil nears 63.00.
Fundamental Analysis:
The decline in gold prices is ultimately due to the fading of news, which has led to a decline in risk aversion. We will continue to monitor the Federal Reserve's new monetary policy.
Trading Recommendations:
Crude oil: Sell near 63.00, targeting 60.00-58.00.

Crude oil - Sell around 63.60, target 61.00-58.00Crude Oil Market Analysis:
Crude oil inventory data triggered a surge in buying. The daily price rebounded to around 60.00 after two sessions. The current daily chart suggests selling pressure remains. This week, our outlook remains bearish. I predict a corrective rebound this week, followed by continued declines in the second half of the week. Crude oil is unlikely to see a significant rebound, so continue selling. Sell if it rebounds to around 63.60 today.
Fundamental Analysis:
For fundamentals, we're focusing on key data and geopolitical developments. This week will feature the Federal Reserve's significant interest rate decision, and the market currently anticipates continued easing.
Trading Recommendations:
Crude oil - Sell around 63.60, target 61.00-58.00

Crude oil - Sell around 59.60, target 58.00-56.00Crude Oil Market Analysis:
Gold's significant moves haven't impacted crude oil, which is still recovering. Consider selling after today's rebound to 59.50. The overall trend is bearish, and the short-term outlook is bearish as well. However, the short-term volatility is quite strong, so don't sell. Crude oil needs to wait for opportunities. If there's a position, buy; if not, wait. Recent crude oil inventory data is also disappointing, which is likely to suppress crude oil prices.
Fundamental Analysis:
Watch the EIA crude oil inventory data today.
Trading Recommendations:
Crude oil - Sell around 59.60, target 58.00-56.00
Crude oil: Sell around 58.60, target 56.00-55.00Crude Oil Market Analysis:
Crude oil has been declining recently and has reached strong support near 55. A break of this level would open up further downside. Today's outlook for crude oil remains bearish. Continue selling on minor rebounds, focusing on selling opportunities around 58.90. The new contract also bearishly suggests no buying opportunities. This selling strategy has persisted for a long time.
Fundamental Analysis:
The Federal Reserve has once again implemented loose monetary policy, and with the added support of CPI, market uncertainty is high, prompting a surge in gold prices.
Trading Recommendations:
Crude oil: Sell around 58.60, target 56.00-55.00

US OilCrude Oil
- Consolidation Phase
- Break of Structure
- Bearish Channel as an corrective pattern in Short Time Frame
- Order Block
- Resistance Level
USOIL: Price breaks out of sideways – sell on pullbackTo better understand my current outlook on USOIL, please refer to my previous higher-timeframe and fundamental analyses.
This could be a position trade in anticipation of a larger downtrend on the daily timeframe, but there's risk involved due to the upcoming Non-Farm Payrolls (NFP) report this Friday.
* Trend: assessed using at least three trend indicators, with market structure as the primary guide.
** Weak or Reversal Signals: Assessed based on one of our criteria for trend reversal signals.
*** Support/Resistance: Selected from multiple factors – static (Swing High, Swing Low, etc.), dynamic (EMA, MA, etc.), psychological (Fibonacci, RSI, etc.) – and determined based on the trader’s discretion.
**** Our advice takes into account all factors, including both fundamental and technical analysis. It is not intended as a profit target. We hope it can serve as a reference to help you trade more effectively. This advice is for informational purposes only and we assume no responsibility for any trading results based on it.
Please like and comment below to support our traders. Your reactions will motivate us to do more analysis in the future 🙏✨
George Vann @ ZuperView
OIL Trade Setup📢 NFX Trade Update – USOIL FX:USOIL
Price pushed above $64, tagging the 23.6% Fibonacci retracement, which I believe should hold. This move looks like a liquidity grab, hunting short stop-losses (our last setup included 😅). Classic SMC in play.
Now we have clearer insight: the key question is whether price respects the 23.6% Fib or extends higher. Based on strong fundamentals (recent inventory build signaling oversupply), I doubt sustained higher prices. The bearish case still holds weight.
🎥 Full breakdown and details in the video.

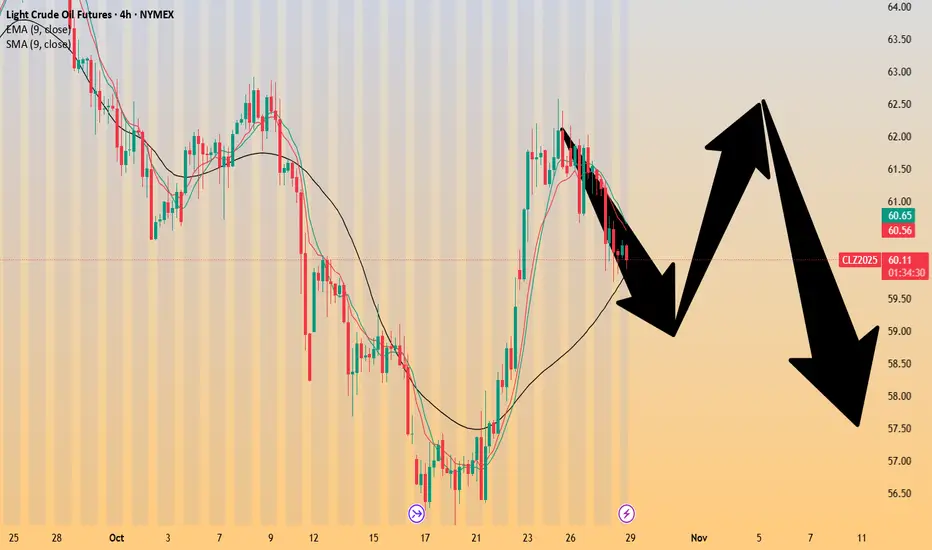
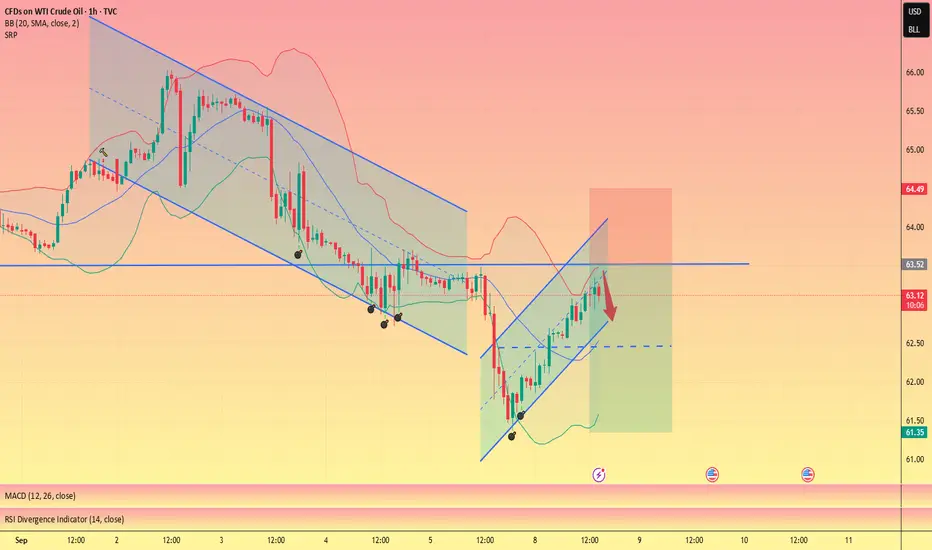
USOIL latest trend analysis and operation layout#USOIL
Crude oil continued to rebound in the European session, but the short-term 4H moving average was still pressing downward, and it was obvious that the short-selling momentum had not completely subsided. The overall trading rhythm is mainly based on rebound shorting. The short-term upper resistance level is 63.5-64.5. If it fails to break through effectively, crude oil will usher in a retracement, with the target looking at 62.5-61.5
🚀 SELL 63.5-64.5
🚀 TP 62.5-61.5
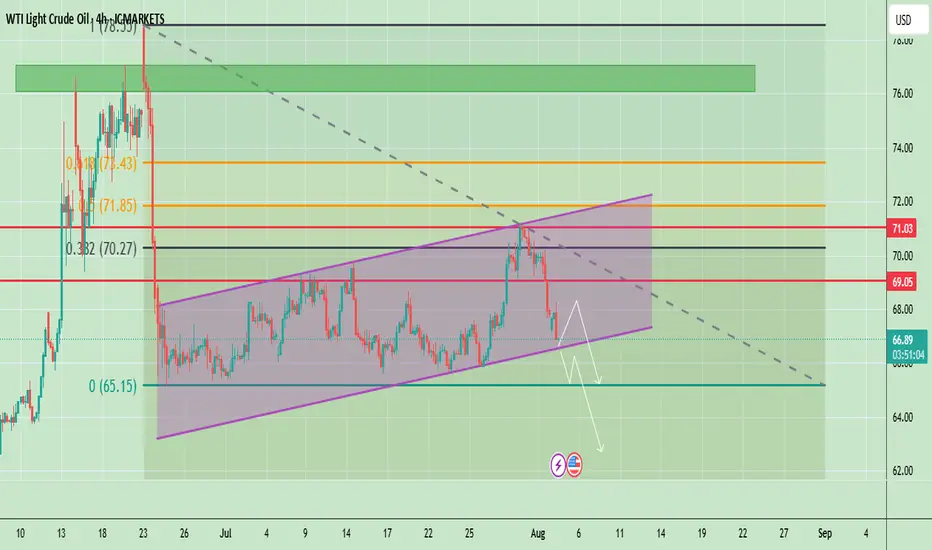
Oil at Key Support – Bounce or Breakdown?Crude oil is trading around $66.94, showing a bearish correction after failing to hold above $69.05. The chart shows price respecting an ascending channel but currently testing its lower boundary. The recent drop signals weakening bullish momentum, and a confirmed break below the channel could accelerate selling pressure toward lower levels.
📈 Potential Scenarios
- Bullish Rebound: If price holds above the channel support (~$66.00–$66.50) and breaks back above $69.05, it may target $71.03 and possibly $72.00.
- Bearish Breakdown: A confirmed close below $66.00 can accelerate the downside toward $65.00, with extended targets near $63.50–$62.00.
📊 Key Technical Highlights
- Price rejected from the channel top and is now testing lower support.
- Key resistance zones: $69.05 (immediate), $71.03 (major).
- Key support zones: $66.00 (channel), then $65.00–$63.50 (breakdown targets).
- Momentum indicators show weakening buying pressure, favoring cautious trading.
🔑 Key Levels to Watch
- Resistance: $69.05 → $71.03 → $72.00
- Support: $66.00 → $65.00 → $63.50
🧭 Trend Outlook
- A short-term relief bounce is possible, but failure to reclaim $69.05 keeps sellers in control.
- Breaking below the channel would shift the overall outlook to bearish for August.
Note
Please risk management in trading is a Key so use your money accordingly. If you like the idea then please like and boost. Thank you and Good Luck!
Is oil price heading back up? Watching a potential inverse head and shoulders forming on the 30-minute chart for Oil.
🔹 Risk/Reward: 2.7
🔹 Entry: 63.290
🔹 Stop Loss: 63.043
🔹 Take Profit 1 (50%): 63.93
🔹 Take Profit 2 (50%): 64.21
A couple of key factors still need to align before I pull the trigger:
• One will confirm around 14:45 SAST (GMT+2)
• Looking for lower volume on the right shoulder compared to the left
What do you think? Is oil ready to push higher?
Drop your thoughts or how you trade inverse head and shoulders below! 👇

Crude oil-----sell near 67.50, target 65.00-63.00Crude oil market analysis:
Crude oil has started a new contract. The new contract is still not moving much at present, and the contract spread is not much. The daily line has begun to decline. Today's idea is to sell at a rebound of 67.50. The suppression position is 67.50 and 69.00, and the support is around 64.00. If this position is broken, there will be a greater room for decline.
Fundamental analysis:
There is no major news in the recent fundamentals. The situation in the Middle East is still relatively stable. There is no new rest on tariffs, and the impact on the market is limited.
Operational suggestions:
Crude oil-----sell near 67.50, target 65.00-63.00

Crude oil---sell near 67.50, target 65.00-60.00Crude oil market analysis:
Crude oil has also started to fluctuate recently. Pay attention to the impact of contract delivery on the trend of crude oil. The daily line of crude oil does not show the strength of its rebound. In terms of operation, it is still a rebound sell. Crude oil continues to be bearish. The situation in the Middle East has not made any major moves temporarily, and the support for crude oil is limited. Pay attention to the selling opportunities near 67.30 today.
Operational suggestions:
Crude oil---sell near 67.50, target 65.00-60.00

Crude oil-----Sell near 66.80, target 65.00-62.00Crude oil market analysis:
The recent crude oil daily line began to decline, but a small V appeared last night, which was also caused by the situation in the Middle East. Israel bombed Syria and crude oil began to rebound. Overall, crude oil is still bearish. We consider continuing to sell it when it rebounds. It has not broken near 64.00, and it is difficult to form a large unilateral. The suppression position is near 66.80. Consider selling it near it.
Fundamental analysis:
Trump’s dissatisfaction with Powell has not been a day or two. Conflict is inevitable, and the impact on gold is also short-term. Yesterday’s pull-up and dive is a case in point.
Operational suggestions
Crude oil-----Sell near 66.80, target 65.00-62.00

Crude oil------sell near 70.00, target 66.70-63.00Crude oil market analysis:
Recently, crude oil has been rising, and buying is slowly climbing, but the amplitude is not particularly large. The daily line has not formed a large buying pattern. It is currently a technical repair market after falling too much. Today's idea is to sell on the rebound. Pay attention to the suppression near 70.00. If this position is broken, it may change the short-term trend and buying may rise.
Fundamental analysis:
Last week, Trump increased tariffs on Canada and is about to increase tariffs on Brazil. There is no sign of stopping the tariff war. It is long-term bullish for gold. The situation in the Middle East has not completely stopped, and it is also long-term suppression of the US dollar to support gold.
Operation suggestions:
Crude oil------sell near 70.00, target 66.70-63.00

WTI Oil – From Conflict to StrategyBack on April 24, I marked a short zone. On June 11, price broke above that level, giving a long opportunity — which I took.
Unfortunately, it coincided with the tragic military strike by Israel on Iran, pushing oil sharply higher. I’ve pinned that analysis.
Following the ceasefire, price dropped again — just a reminder that geopolitics can shake the charts.
As traders, we stay prepared to act, even while acknowledging the deep sadness of lives lost.
Now I wait for price to reach my marked level again. If I get a valid signal, I’ll short.
But if price breaks and holds above, I’ll buy the pullback — with no bias, just pure execution.
Risk-managed. Emotion-neutral. Opportunity-focused.
