WTI Crude Oil
As shown in my previous analysis (pinned below this post), we shorted oil from the range high.
Now price has reached the range low, where two key buy levels are marked on the chart ✅.
🔹 If these levels break, the opposite scenario still stands.
🔹 We’re not in OPEC, we don’t make political or war decisions, and we don’t give orders to the market.
🔹 We are traders, simply trying to profit from opportunities.
⚡️ Remember: being biased toward your analysis = blowing up your account and losing confidence.
🎯 Always follow the market, never fight it.
Oilsignals

Australian Oilseeds Holdings Limited ($COOT) Spike 173% Today The price of Australian Oilseeds Holdings Limited (NASDAQ: NASDAQ:COOT ) Spike nearly 180% Today after Trump targets China.
The Australian giant spike amidst reacting to the rare earth trade tensions between the US and China spiking from a falling wedge pattern gaining roughly 175% today.'
However, albeit growing momentum, the asset is currently oversold sitting with an RSI of 73 trading above all moving averages respectively.
About Australian Oilseeds Holdings (NASDAQ: NASDAQ:COOT )
Australian Oilseeds Holdings Limited, through its subsidiaries, manufactures and sells chemical free, non-genetically modified organism, and sustainable edible oils and products derived from oilseeds worldwide. The company offers vegetable oils, including unrefined canola oil, premium canola oil, extra filtered canola oil, RBD canola oil, safflower oil, sunflower oil, RBD sunflower oil, soyabean oil, linseed oil, and extra virgin olive oil.

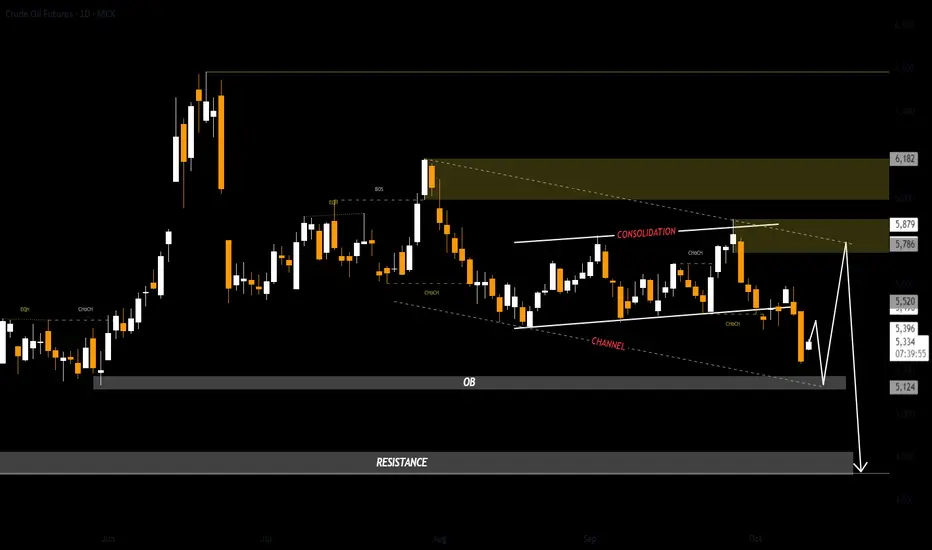
US OilCrude Oil
- Consolidation Phase
- Break of Structure
- Bearish Channel as an corrective pattern in Short Time Frame
- Order Block
- Resistance Level
Crude Oil: Bullish Momentum Builds Above $62.13FenzoFx—Crude Oil tapped into the liquidity below the equal lows at $62.13. However, the cumulative volume profile did not form new lower lows. This means the market could be bullish, at least in the short term.
Therefore, we expect Oil to rise higher. The immediate resistance is at $62.74. From a technical perspective, the price could target the bearish FVG with resistance at $64.84 if bulls close and stabilize the price above $62.74.

WTI OIL Channel Up bottom buy signalWTI Crude Oil (USOIL) has almost touched the bottom (Higher Lows trend-line) of its September Channel Up, following a strong rejection (Bearish Led) just below the 1D MA200 (orange trend-line).
With the 4H RSI entering its medium-term Buy Zone, we have a strong short-term buy signal at our hands. Our Target is $66.50, expecting a 1D MA200 test, below the 1.1 Fibonacci extension, below which the previous Higher High was priced.
-------------------------------------------------------------------------------
** Please LIKE 👍, FOLLOW ✅, SHARE 🙌 and COMMENT ✍ if you enjoy this idea! Also share your ideas and charts in the comments section below! This is best way to keep it relevant, support us, keep the content here free and allow the idea to reach as many people as possible. **
-------------------------------------------------------------------------------
💸💸💸💸💸💸
👇 👇 👇 👇 👇 👇

CRUDE OIL (WTI): More Growth Ahead
WTI Oil broke and closed above a strong rising trend line on a daily.
We see a pullback and a correctional movement now.
I think that growth will resume soon and the price will rise
to 65.55 level.
❤️Please, support my work with like, thank you!❤️
I am part of Trade Nation's Influencer program and receive a monthly fee for using their TradingView charts in my analysis.

Crude oil: Sell around 64.00, target 62.00-60.00Crude Oil Market Analysis:
Today's daily crude oil chart saw a small rebound, in line with our expectations yesterday. Crude oil remains bearish, and rebounds present opportunities for further shorting. Focus on selling around 64.50 today. This trend has been consistent for several months, and the price has been oscillating around this level for several months. Don't be too fussy about trading; take profits and sell. The key to a volatile market is the rhythm and position.
Fundamental Analysis:
There are no major fundamentals or data this week, only standard data. Focus on the impact of the Fed's interest rate cut.
Trading Recommendations:
Crude oil: Sell around 64.00, target 62.00-60.00

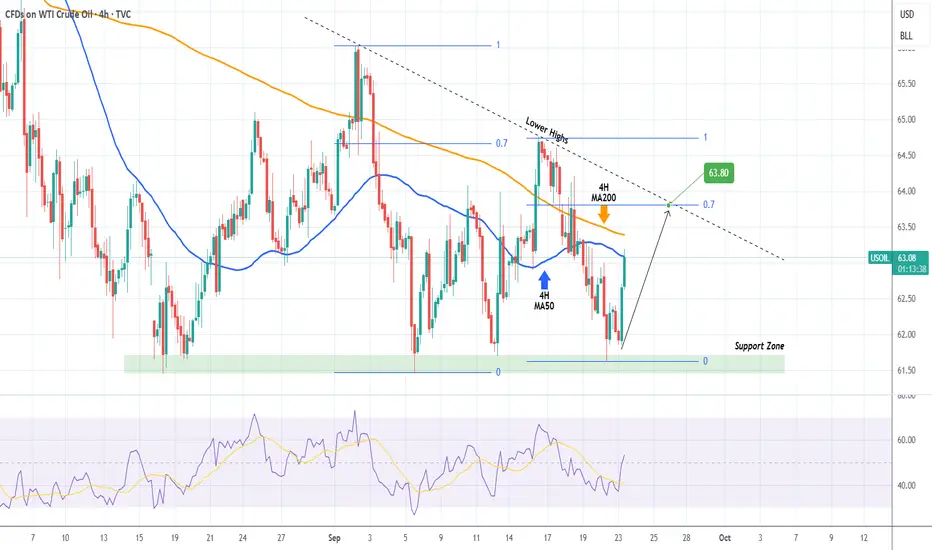
WTI OIL Descending Triangle targeting its top.WTI Oil (USOIL) has been trading within a Descending Triangle and following yesterday's test of its Support Zone, it is rebounding.
This Bullish Leg has already touches the 4H MA50 (blue trend-line) and based on the previous one, it should extend to at least the 0.7 Fibonacci retracement level.
This gives us a 63.80 Target before the pattern's Lower Highs trend-line is tested.
-------------------------------------------------------------------------------
** Please LIKE 👍, FOLLOW ✅, SHARE 🙌 and COMMENT ✍ if you enjoy this idea! Also share your ideas and charts in the comments section below! This is best way to keep it relevant, support us, keep the content here free and allow the idea to reach as many people as possible. **
-------------------------------------------------------------------------------
💸💸💸💸💸💸
👇 👇 👇 👇 👇 👇
WTI OIL This is the bigger picture.WTI Oil (USOIL) is currently on the 2nd straight green week ahead of today's Fed Rate Decision. The long-term pattern though is has been a Channel Down since August 2022 and until it gets invalidated, the trend will remain bearish.
In fact, it has made 3 emphatic rejections on the 1W MA200 (orange trend-line) since August 12 2024. The 1W RSI sequence since then, resembles the pattern of 2023, where WTI found a Higher Lows Support on the 1W MA200. The last such contact was on the 0.786 Fibonacci retracement level before a last rebound to the top of the Channel Down.
That is exactly what we are expecting now, with the new 0.786 Fib waiting at $59.50. That is our medium-term Target.
-------------------------------------------------------------------------------
** Please LIKE 👍, FOLLOW ✅, SHARE 🙌 and COMMENT ✍ if you enjoy this idea! Also share your ideas and charts in the comments section below! This is best way to keep it relevant, support us, keep the content here free and allow the idea to reach as many people as possible. **
-------------------------------------------------------------------------------
💸💸💸💸💸💸
👇 👇 👇 👇 👇 👇

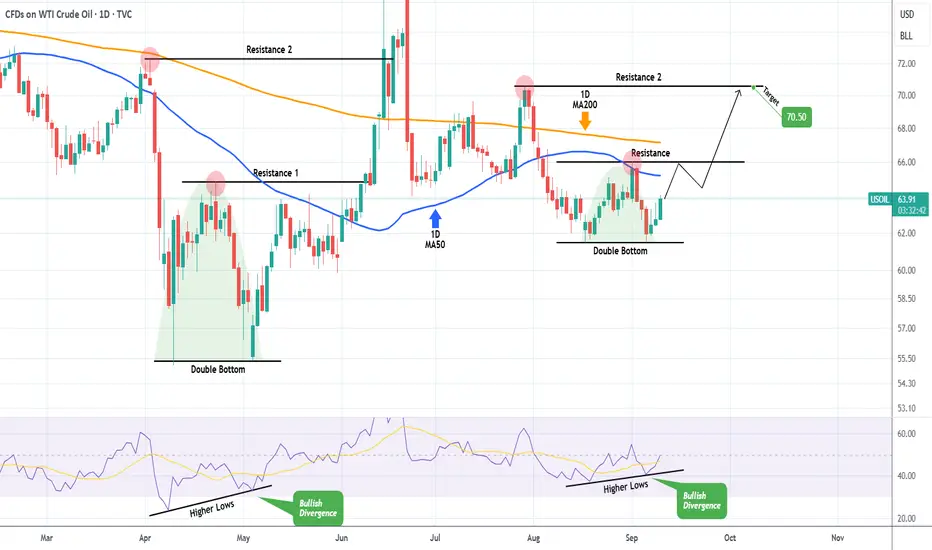
WTI OIL Recent fractal calls for a buy towards $70.50.WTI Oil (USOIL) is on the 3rd straight green 1D candle following a Double Bottom bounce on the 61.50 Support. At the same time the 1D RSI formed Higher Lows, which is a Bullish Divergence.
The same set of conditions emerged on the May 05 bottom rebound, which resulted into initially a 1D MA50 (blue trend-line) test and then a Resistance 2 contact.
As a result, we expect this rise to continue, targeting $70.50.
-------------------------------------------------------------------------------
** Please LIKE 👍, FOLLOW ✅, SHARE 🙌 and COMMENT ✍ if you enjoy this idea! Also share your ideas and charts in the comments section below! This is best way to keep it relevant, support us, keep the content here free and allow the idea to reach as many people as possible. **
-------------------------------------------------------------------------------
💸💸💸💸💸💸
👇 👇 👇 👇 👇 👇
USOIL latest trend analysis and operation layout#USOIL
Crude oil continued to rebound in the European session, but the short-term 4H moving average was still pressing downward, and it was obvious that the short-selling momentum had not completely subsided. The overall trading rhythm is mainly based on rebound shorting. The short-term upper resistance level is 63.5-64.5. If it fails to break through effectively, crude oil will usher in a retracement, with the target looking at 62.5-61.5
🚀 SELL 63.5-64.5
🚀 TP 62.5-61.5
WTI OIL Short-term Channel Up 4H MA50 buy opportunity.Last week (August 26, see chart below) we caught the absolute low with our WTI Oil (USOIL) buy signal, hitting our $66.30 Target shortly after:
This time we have another buy signal on the short-term as the Channel Up that emerged has pulled-back all the way to its 4H MA50 (blue trend-line).
The last 3 times it did so, it was a buy opportunity. Assuming this is another Higher Low bottom, the new Bullish Leg that is about to be initiated, should aim for the 1.382 Fibonacci extension, similar to what the previous two did.
This gives us a $66.75 Target for the short-term.
-------------------------------------------------------------------------------
** Please LIKE 👍, FOLLOW ✅, SHARE 🙌 and COMMENT ✍ if you enjoy this idea! Also share your ideas and charts in the comments section below! This is best way to keep it relevant, support us, keep the content here free and allow the idea to reach as many people as possible. **
-------------------------------------------------------------------------------
💸💸💸💸💸💸
👇 👇 👇 👇 👇 👇

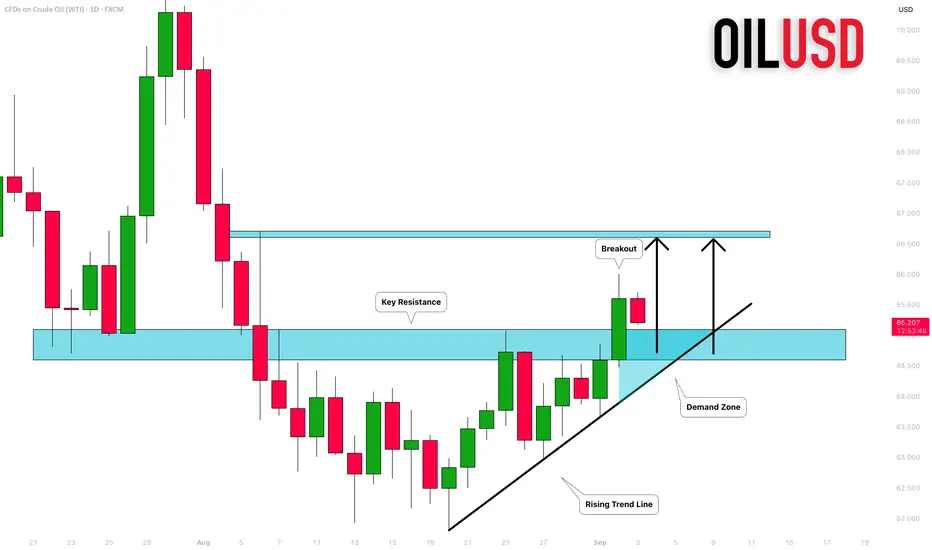
CRUDE OIL (WTI): Important Breakout!
With a strong bullish rally, WTI Crude Oil violated a significant
daily resistance cluster yesterday.
The broken structure and a rising trend line compose an important
demand zone now.
I will expect a bullish continuation from that.
Next resistance - 66.6
❤️Please, support my work with like, thank you!❤️
WTI OIL technically more chances to test the 1D MA50. Buy.Last week (August 20, see chart below) we issued a bullish break-out signal on WTI Oil (USOIL) that reached our $65.60 Target within 3 days:
This time we get a new buy signal, despite today's sharp pull-back. The -12.78% decline since the July 30 rejection, resembles the one since the October 08 2024 High.
This rebounded to just above the 1D MA50 (blue trend-line) to form a new Lower High and get rejected again.
As a result, our immediate short-term Target is $66.30.
-------------------------------------------------------------------------------
** Please LIKE 👍, FOLLOW ✅, SHARE 🙌 and COMMENT ✍ if you enjoy this idea! Also share your ideas and charts in the comments section below! This is best way to keep it relevant, support us, keep the content here free and allow the idea to reach as many people as possible. **
-------------------------------------------------------------------------------
Disclosure: I am part of Trade Nation's Influencer program and receive a monthly fee for using their TradingView charts in my analysis.
💸💸💸💸💸💸
👇 👇 👇 👇 👇 👇
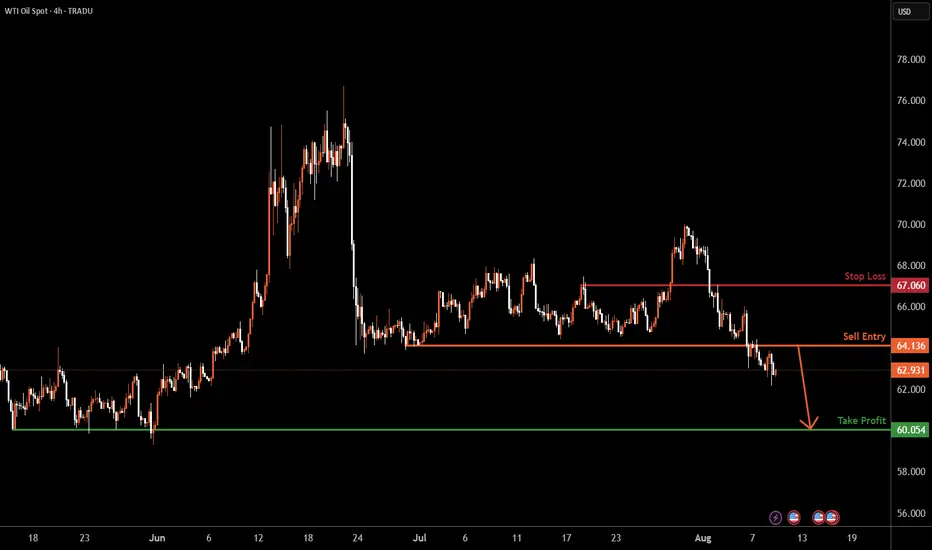
USOIL H4 | Potential bearish dropUSOIL has reacted off the sell entry which is a pullback resistance and could drop from this level to the take profit.
Sell entry is at 64.13, which is a pullback resistance.
Stop loss is at 67.06, which is a pullback resistance.
Take profit is at 60.05, which is a multi swing low support.
High Risk Investment Warning
Trading Forex/CFDs on margin carries a high level of risk and may not be suitable for all investors. Leverage can work against you.
Stratos Markets Limited (tradu.com ):
CFDs are complex instruments and come with a high risk of losing money rapidly due to leverage. 65% of retail investor accounts lose money when trading CFDs with this provider. You should consider whether you understand how CFDs work and whether you can afford to take the high risk of losing your money.
Stratos Europe Ltd (tradu.com ):
CFDs are complex instruments and come with a high risk of losing money rapidly due to leverage. 66% of retail investor accounts lose money when trading CFDs with this provider. You should consider whether you understand how CFDs work and whether you can afford to take the high risk of losing your money.
Stratos Global LLC (tradu.com ):
Losses can exceed deposits.
Please be advised that the information presented on TradingView is provided to Tradu (‘Company’, ‘we’) by a third-party provider (‘TFA Global Pte Ltd’). Please be reminded that you are solely responsible for the trading decisions on your account. There is a very high degree of risk involved in trading. Any information and/or content is intended entirely for research, educational and informational purposes only and does not constitute investment or consultation advice or investment strategy. The information is not tailored to the investment needs of any specific person and therefore does not involve a consideration of any of the investment objectives, financial situation or needs of any viewer that may receive it. Kindly also note that past performance is not a reliable indicator of future results. Actual results may differ materially from those anticipated in forward-looking or past performance statements. We assume no liability as to the accuracy or completeness of any of the information and/or content provided herein and the Company cannot be held responsible for any omission, mistake nor for any loss or damage including without limitation to any loss of profit which may arise from reliance on any information supplied by TFA Global Pte Ltd.
The speaker(s) is neither an employee, agent nor representative of Tradu and is therefore acting independently. The opinions given are their own, constitute general market commentary, and do not constitute the opinion or advice of Tradu or any form of personal or investment advice. Tradu neither endorses nor guarantees offerings of third-party speakers, nor is Tradu responsible for the content, veracity or opinions of third-party speakers, presenters or participants.
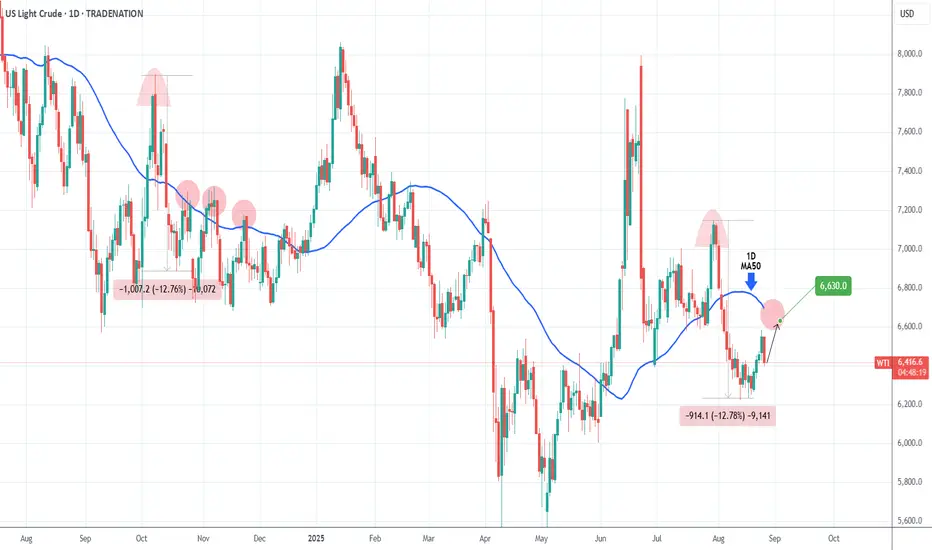
WTI OIL on its first 1D Death Cross since Sep 2024!WTI Oil (USOIL) is on the decline and is about to form a 1D Death Cross for the first time since September 06 2024! That is technically a bearish signal but last time once completed, the market formed a bottom 2 days later.
As a result, we expect a max drop to Support 1 ($60.05) but then more likely a rebound back to the Resistance ($71.40), especially given the fact that the 1D RSI will almost get oversold (>30.00).
-------------------------------------------------------------------------------
** Please LIKE 👍, FOLLOW ✅, SHARE 🙌 and COMMENT ✍ if you enjoy this idea! Also share your ideas and charts in the comments section below! This is best way to keep it relevant, support us, keep the content here free and allow the idea to reach as many people as possible. **
-------------------------------------------------------------------------------
Disclosure: I am part of Trade Nation's Influencer program and receive a monthly fee for using their TradingView charts in my analysis.
💸💸💸💸💸💸
👇 👇 👇 👇 👇 👇
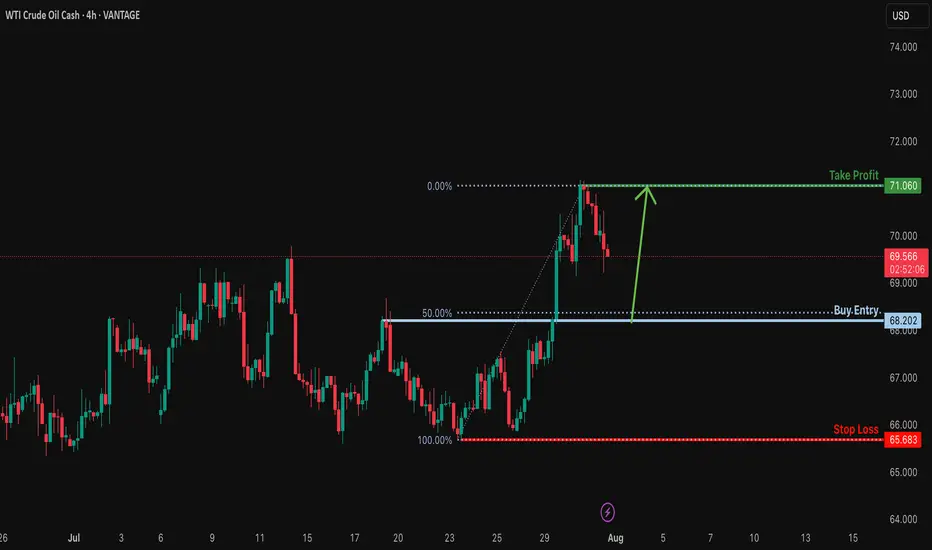
Bullish bounce off 50% Fibonacci support?USOUSD is falling towards the support levle which is a pullback support that aligns with the 50% Fibonacci retracement and could bounce from this level to our take profit.
Entry: 68.20
Why we like it:
There is a pullback support that lines up with the 50% Fibonacci retracement.
Stop loss: 65.68
Why we like it:
There is a multi swing low support.
Take profit: 71.06
Why we like it:
There is a swing high resistance.
Enjoying your TradingView experience? Review us!
Please be advised that the information presented on TradingView is provided to Vantage (‘Vantage Global Limited’, ‘we’) by a third-party provider (‘Everest Fortune Group’). Please be reminded that you are solely responsible for the trading decisions on your account. There is a very high degree of risk involved in trading. Any information and/or content is intended entirely for research, educational and informational purposes only and does not constitute investment or consultation advice or investment strategy. The information is not tailored to the investment needs of any specific person and therefore does not involve a consideration of any of the investment objectives, financial situation or needs of any viewer that may receive it. Kindly also note that past performance is not a reliable indicator of future results. Actual results may differ materially from those anticipated in forward-looking or past performance statements. We assume no liability as to the accuracy or completeness of any of the information and/or content provided herein and the Company cannot be held responsible for any omission, mistake nor for any loss or damage including without limitation to any loss of profit which may arise from reliance on any information supplied by Everest Fortune Group.
Crude oil market analysis: Crude oil has not moved much, but it Crude oil market analysis:
Crude oil has not moved much, but it is a good short-term operation opportunity. Sell small when it rebounds, sell big when it rebounds. Crude oil will basically not trap you. It is difficult to end the selling in the short term. It will basically decline in the future. You can sell when it rebounds near 67.00 today. If it breaks 64.00, it will directly dive. The daily line of crude oil has formed a shock pattern. You can sell at the break position of 64.00.
Operation suggestions:
Crude oil---sell near 67.00, target 65.00-63.00

Crude oil ----- Sell near 67.50, target 65.00-63.00Crude oil market analysis:
Crude oil has been falling recently, but the decline is not large, and the rebound will not be large. Consider selling crude oil if it rebounds slightly. The crude oil idea is bearish. It is difficult for crude oil to rise sharply without fundamentals, but we insist on taking losses in operation. If there is no loss, a piece of news will make it take off directly. Crude oil focuses on 64.00 support, and suppresses 67.50 and 69.50. Consider selling opportunities when the Asian session rebounds to 67.50.
Fundamental analysis:
Tariffs have not affected the market recently, and no major news has been announced. The market is relatively calm.
Operational suggestions:
Crude oil ----- Sell near 67.50, target 65.00-63.00

Crude oil-----sell near 66.00, target 65.00-63.00Crude oil market analysis:
The recent daily crude oil line has been fluctuating slightly. It is still bearish to sell at a high price. Crude oil is unlikely to rebound or rise sharply without fundamental support. The hourly crude oil suppression position is 66.40 and 67.50. Today we are close to 66.00 to consider selling opportunities. The daily moving average of crude oil is starting to go down. If 64.00 is broken, it will start to fall sharply.
Operational suggestions
Crude oil-----sell near 66.00, target 65.00-63.00

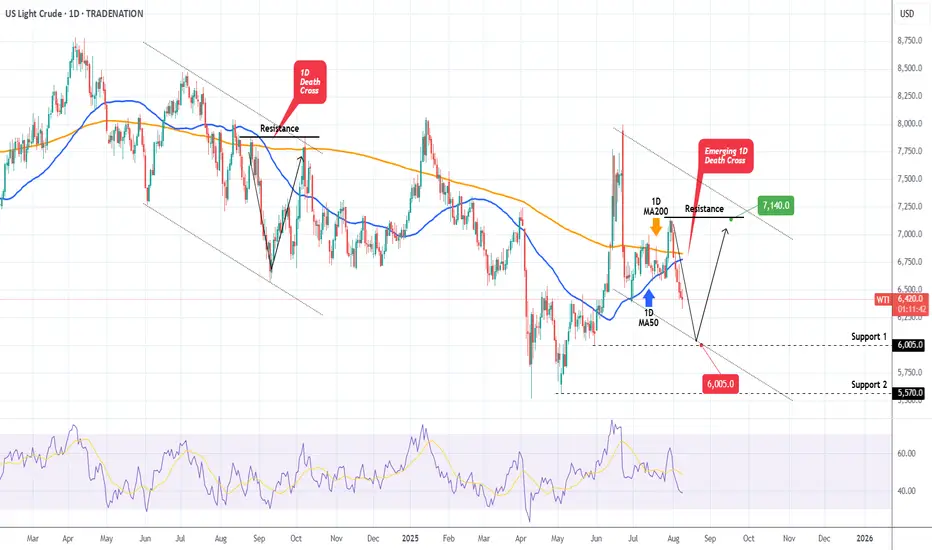
WTI OIL Extreme 1D MA50-200 squeeze to deliver break-out!WTI Oil (USOIL) has been consolidating for almost the past 30 days within the 1D MA50 (blue trend-line) and 1D MA200 (orange trend-line). The squeeze is now so tight that the trend will be revealed soon with a break-out.
Based on the 2-year Channel Down, that should be bearish, resembling the May 2024 consolidation that broke downwards and almost hit the 0.786 Fibonacci retracement level. Notice also the similar Sell Zone rejection on the 1W RSI.
As a result, we expect WTI to decline and target $61.00.
-------------------------------------------------------------------------------
** Please LIKE 👍, FOLLOW ✅, SHARE 🙌 and COMMENT ✍ if you enjoy this idea! Also share your ideas and charts in the comments section below! This is best way to keep it relevant, support us, keep the content here free and allow the idea to reach as many people as possible. **
-------------------------------------------------------------------------------
Disclosure: I am part of Trade Nation's Influencer program and receive a monthly fee for using their TradingView charts in my analysis.
💸💸💸💸💸💸
👇 👇 👇 👇 👇 👇

Crude oil-----sell near 67.50, target 65.00-63.00Crude oil market analysis:
Crude oil has started a new contract. The new contract is still not moving much at present, and the contract spread is not much. The daily line has begun to decline. Today's idea is to sell at a rebound of 67.50. The suppression position is 67.50 and 69.00, and the support is around 64.00. If this position is broken, there will be a greater room for decline.
Fundamental analysis:
There is no major news in the recent fundamentals. The situation in the Middle East is still relatively stable. There is no new rest on tariffs, and the impact on the market is limited.
Operational suggestions:
Crude oil-----sell near 67.50, target 65.00-63.00

Crude oil------sell near 68.80, target 66.00-62.00Crude oil market analysis:
Recent crude oil is actually very easy to operate. Sell when it rebounds to a high position. Don't worry about the position. In addition, the daily K-line has also begun to decline, and it is difficult to form a large rebound. The new daily moving average begins to sort. If there is no fundamental support in the future, crude oil has a lot of room to fall, and it will fall below 58 in the future. Sell it when it rebounds to around 68.80 today.
Fundamental analysis:
Today is a holiday in Tokyo, Japan. In addition, there is no major data this week. We focus on the fundamentals. Trump's tariffs are still a focus.
Operational suggestions:
Crude oil------sell near 68.80, target 66.00-62.00
