OKBUSDTBased on technical factors there is a Long position in :
📊 OKBUSDT
🔵 Long Now 16.627
🧯 Stop loss 17.150
🏹 Target 1 19.680
🏹 Target 2 21.000
🏹 Target 3 23.200
💸Capital : 1%
We hope it is profitable for you ❤️
Please support our activity with your likes👍 and comments📝
Okb

Target 16.12Following weekly chart.
Found a good long opportunity ( around 25%) RSI support a long signal also.
TP 16.12
SL 10.63 - Plase wait for candle close to stop position.

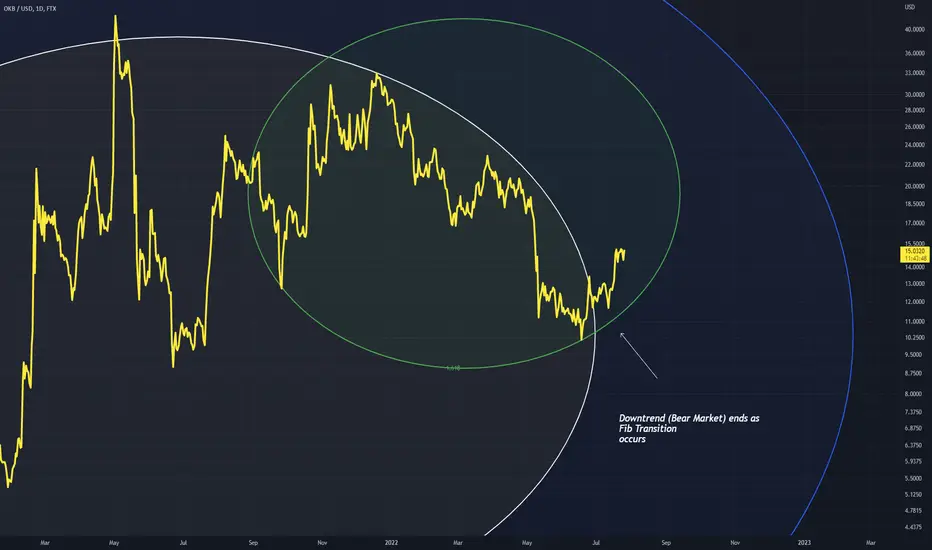
OKB - Bear Market End The end of the bear market can be observed as price transitions through 1.618
A bull market will begin, (early stages of trend reversal)
This correlates well with where BTC and ETH are currently poised
OKB | OKX TOKEN | Trading Within StructuresOKB | OKX TOKEN | Trading Within Structures
On the daily chart, the price is developing within very solid structures.
We can see only a small correction that can happen close to $12
From there I am expecting the price to increase again and probably in the coming
months it can reach 16 and 18 considering that also the trading volume should increase again.
Details on the chart!
Thank you and Good Luck!

OKB Price PredictionDue to the markets condition i expect OKB to touch the $9.15 support.
Looking forward to read your opinion about it.

OKB Price Targets and Stop LossOKB/USDT
Entry Range: $19 - 21.20
Price Target 1: $22.80
Price Target 2: $23.90
Price Target 3: $28
Stop Loss: $18.50

OKB Price Targets and Stop LossOKB/USDT
Entry Range: $20 - 21.20
Price Target 1: $22.80
Price Target 2: $23.90
Price Target 3: $28
Stop Loss: $18.50

OKB price is nearing the end of an interesting parallel channelThe OKB token price has been trading into the descending parallel channel for more than 2-month.
Today, OKB investors attempts to breach this falling channel to the upside and jumped the token price higher by 11.5%.
The OKB token price is moving towards the 200-day moving average line (yellow) of the EMA Ribbon indicator after the bounce-back over the daily price chart. Moreover, The Stoch RSI is expanding towards the overbought territory and reflecting solid bullish momentum.
Conclusion
For the buying opportunity, OKB investors should wait for the confirmation above the descending parallel channel. Than Only, the price may reach till the supply zone (red)
Support level- $6.8 and $10
Resistance level- $20.5 and $30

DYDX Triple BottomHello friends!
As you can see in the chart,
DYDX is forming triple bottom and has come out of the wedge,
Can a rally be formed?
What is your opinion?
Good luck!

BTC PatternHello friends!
As you chart the chart,
Bitcoin approaches a downtrend in an uptrend channel and a negative divergence in the RSIT
What do you think?
Good luck dear ones!

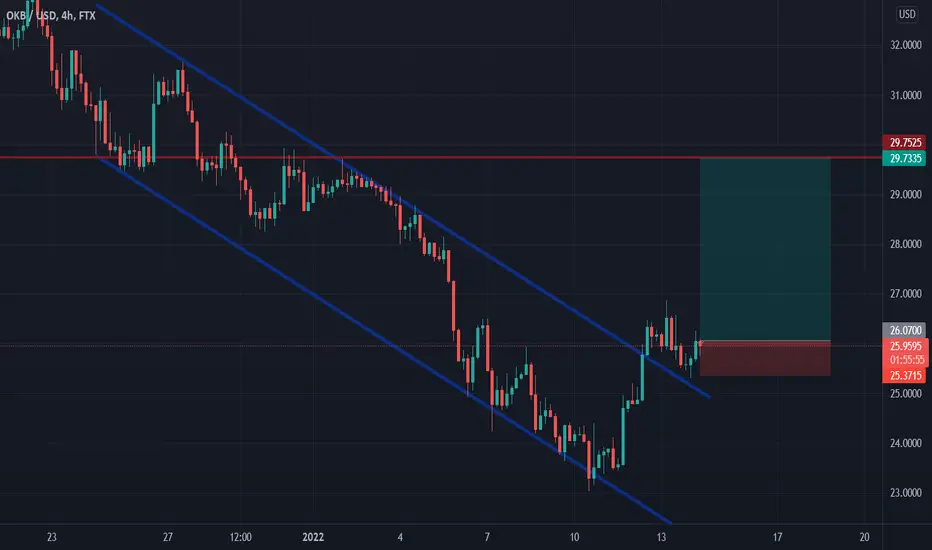
OKB longOKBUSD is breaking up the upper boundary of descending channel . Bullish movement to resistance level at 29.75 is possible.
OKBThis particular pattern in this currency can be a sign that this currency is going to climb very well in the future
OKB can be 45$ again
Analysis basically on Elliott waves Principles

OKBUSDT Sweet bounce (Long)Looks like OKB is ready to have a sweet bounce.
Here is why i think its a good long position:
- 50 MA touch
- 61.8% Fib touch
- Bollinger bands bottom touch
- RSI oversold
- sweet falling wedge pattern
Entry: 27,93
Stop Loss: 25,79
Profit Target: 33,00

1H Short OKBMarket: OKB 1H and 4H in a downtrend. Macd both negative
Entry: 27.8
SL: 28.616
TP: 26.209/ Trail using 50 ema

OKB 4hr ETF with Daily as HTFTrading the breakout of recent swing high of 33.87, waiting for breakout, macd 4h to turn bullish, TP at around 41 bucks, SL at 30.67. using atr stop loss indicator

Long OKB for Full cup and Handle Pattern OKB has full formed a curve for the cup pattern, retesting previous resistance as support near the 29.9-30 levels.
Now we use the fib levels to extend for a TP target at 1.618 level at 39.39
We draw the full depth of the cup pattern and extend it above to coincide with the 1.618 level
Volumes also show buyers trying to break the 33 resistance level, with at least 6 touches already on the 1H
MACD crossing over to upside with momentum.
TP 39.397
SL 20.0895
Very favorable RR 2.56

OKB/USDTesting/tracking elliot wave theory. Please do not trade off idea without S/L. Not financial advice.

CherrySwap (CHE) with bullish divergenceCherrySwap is the DeFi platform with the highest TVL (Total Value Locked) on the OKEx blockchain.
On the chart we can see a bullish divergence, which could break up.
The OKT and OKB cryptocurrencies native to this blockchain also appear to be upside potential.
Consider the BTC.D (Bitcoin Dominance) graph. When it's going up, it's not a good time to be on Altcoins.

🆓OKB (OKB) Nov-2 #OKB $OKBOKB is trying to break through the $22 zone to move up to the $26, $30 and $40 zone this November. But if it loses the $22 zone, we can buy it back at the $19 zone
📈RED PLAN
♻️Condition : If 1-Day closes ABOVE 22$ zone
🔴Buy : 22
🔴Sell : 26 - 30 - 40
📉BLUE PLAN
♻️Condition : If 1-Day closes BELOW 22$ zone
🔵Sell : 22
🔵Buy : 19
❓Details
🚫Stoploss for Long : 10%
🚫Stoploss for Short : 5%
📈Red Arrow : Main Direction as RED PLAN
📉Blue Arrow : Back-Up Direction as BLUE PLAN
🟩Green zone : Support zone as BUY section
🟥Red zone : Resistance zone as SELL section

OKB Price Analysis: Bollinger Bands Squeeze and Hook PatternOKB has been one of the top-performing cryptocurrencies over the past week, with more than 58% gains. A very rare chart pattern, which on the surface might not say much, is pointing to a trend in the making. The recent explosive move was triggered by the Bollinger Bands squeeze and hook pattern.
Bollinger Bands Squeeze Pattern
In technical analysis, the Bollinger Bands squeeze happens when the two bands turn flat and get closer to each other. This indicates that there is an ongoing ranging market. This implies that when the Bollinger Bands are flat, the price tends to make explosive moves in either direction.
Often, consolidations lead to trend expansion, but many times there are false breakouts too. To distinguish between a false breakout and a genuine breakout, the Bollinger Bands come in handy.
When we have a breakout and the upper band “hooks” upwards, while the lower band hooks downwards, there is a higher probability of a trend continuation in the direction of the breakout.
The daily OKB price chart displays the exact pattern described above. The upside breakout was accompanied by the Bollinger Bands hook in the opposite direction.
Moving forward, if OKB sustains the break above the $25.21 resistance level, there is a high probability for the bulls to challenge the next resistance level found at $42.16.

OKBUSD LONGOKB/USD is a pair to look out for, however, in recent trends, it has been a downtrend of the price. Do you think it's coming price action will bring a surge to the market or a least a retest to go bullish?

OKB token from OKEx exchange!Can we now start using the break of the trend line as support. If so, I expect another big pump. After hitting the demand zone we have risen almost 100% in a few days.......nice nice. The power of Supply and Demand.

OKB/USDT GO THE MOON⭕Hello friends, I am happy to comment on this analysis below this post. ⭕📌Please like this post to support us and follow us. Thank
