Where Can We Rebuy OM? (1W)After the heavy drop, it became evident that a bearish trend had started, and the price is now seeking high-liquidity (buy) zones.
Based on the chart, the green zone stands out as the best area for a potential rebuy — it could launch the price upward by 100% to 500%.
Reaching this zone may take several weeks or even months.
A weekly candle closing below the invalidation level would invalidate this outlook.
For risk management, please don't forget stop loss and capital management
Comment if you have any questions
Thank You
Om

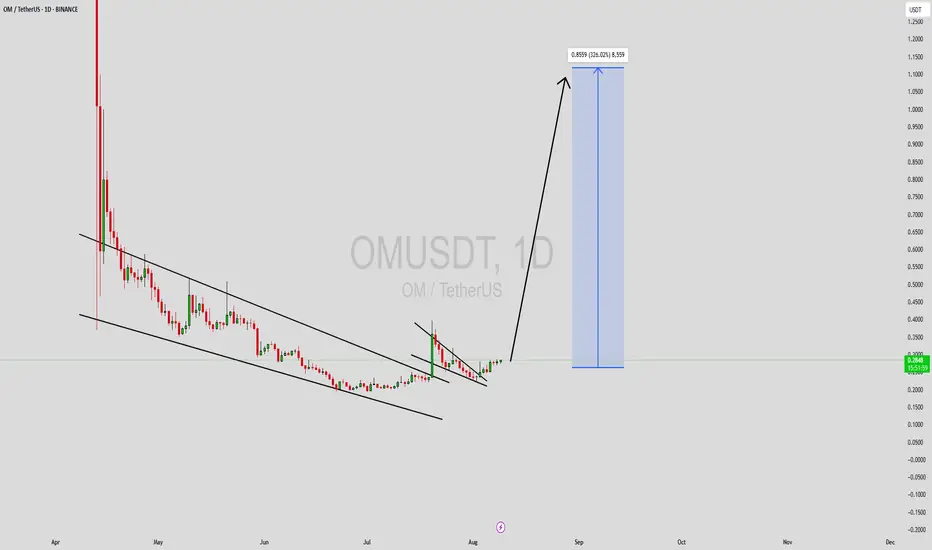
OMUSDT Forming Descending ChannelOMUSDT (OM / TetherUS) is currently showing a textbook descending channel breakout on the daily chart. After a steep downtrend, price has formed a tightening channel and is now pushing upward—signalling a potential major reversal. The breakout is supported by solid volume, suggesting accumulation and renewed investor confidence.
This technical foundation comes amid an asset that has suffered a deep correction—down over 90% from its all-time high. Despite this, OM still maintains interest thanks to ongoing development and a committed team working toward recovery. In that context, the current wave of momentum offers a compelling high-reward opportunity.
Analysts tracking the setup note that a confirmed channel breakout could lead to an explosive move—potentially targeting 290% to 300% gains from current levels, given the absence of nearby resistance and the strength of the impulse wave already in motion.
In summary:
* A descending channel has broken, signaling a potential trend reversal.
* Good volume validates the strength behind this move.
* OM remains a speculative but high-upside candidate—as long as investors are cautious of its volatile history.
This setup is ideal for breakout-focused traders with high risk tolerance and a structured plan.
✅ Show your support by hitting the like button and
✅ Leaving a comment below! (What is Your opinion about this Coin)
Your feedback and engagement keep me inspired to share more insightful market analysis with you!
OM Prepares Recovery Catastrophic Crash · 2,000% Easy PotentialMantraDAO (OM) performed a catastrophic crash in April and the bottom was hit in June. Keep in mind that it doesn't matter how hard a project crashes, it tends always to recover.
Once upon a time Solana produced a major, major crash and people started to run away. I saw this as an amazing opportunity and recommend buy for Solana when it was below $20 and guess what happened next? Solana is today one of the top performers.
When a project produces a very strong crash, for one reason or the other, it tends to recover strongly at the next market cycle. The action tends to move back to the previous high or the baseline.
OMUSDT found support exactly where there was a stop in February 2024. The launchpad for the final leg-up of the previous bullish cycle. When I saw this same level activated perfectly, it called my attention. What do you see?
Resistance (the last high) turns into support. Support (February 2024) stays support. Long-term support tends to work over and over and here we have a long-term one.
The action short-term has already many of the classic reversal signals. After the main drop in April we had some lower lows as an ending diagonal. Then the main low is followed by a higher low, rising volume and marketwide action heating up.
It is here...
We are here...
It is happening now...
Crypto is going up.
Prepare for the ride, prepare for the profits and prepare for the fun.
It will be wild... You will be extremely happy with the results.
MantraDAO is set to grow.
Buy when prices are low.
Namaste.

OM (SPOT)BINANCE:OMUSDT
#OM/ USDT
Entry range (0.2360- 0.2460)
SL 4H close below 0.02287
T1 0.32
_______________________________________________________
Golden Advices.
********************
* collect the coin slowly in the entry range.
* Please calculate your losses before the entry.
* Do not enter any trade you find it not suitable for you.
* No FOMO - No Rush , it is a long journey.

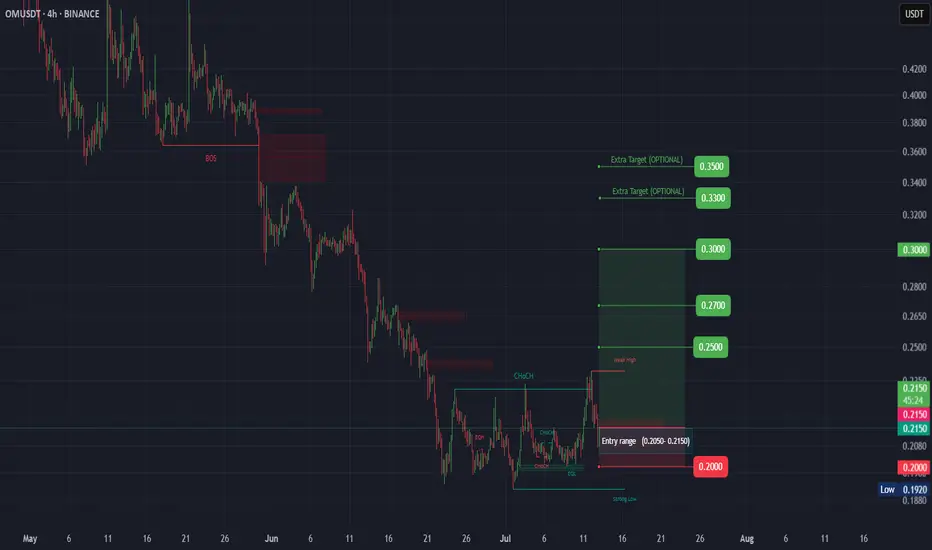
OM (SPOT)BINANCE:OMUSDT
#OM/ USDT
Entry range (0.2050- 0.2150)
SL 4H close below 0.02000
T1 0.25
T2 0.27
T3 0.30
_______________________________________________________
Golden Advices.
********************
* collect the coin slowly in the entry range.
* Please calculate your losses before the entry.
* Do not enter any trade you find it not suitable for you.
* No FOMO - No Rush , it is a long journey.
MantraDAO Easy 810% Target —Sell High, Buy Low!Just as selling and profit taking happens naturally when prices trade high near a new All-Time High, buying also happens naturally at support.
OMUSDT was trading at a new All-Time High in February 2025 and smart traders and holders took profits. This taking profits results in a long-term higher low and a new buy-opportunity.
Always remember, never buy when prices are high up or after a strong bullish wave. Why? Because whales tend to sell when prices are high. Only buy when prices are low.
OMUSDT is trading pretty low right now compared to February 2025. We had 96% correction, but the correction bottom is still a very strong higher low compared to the start of the bullish cycle and wave. After the correction is over, which in this case is early May, we will have a new growth wave.
Easy target can be seen on the chart as 810%.
It can go higher and this is a new All-Time High. We are going with the easy target for this one. An easy trade.
Namaste.

FINAL LEG OF THE ZIGZAG CORRECTION ?Yello, Paradisers! Are we about to see the end of this correction, or is there still one more shakeout coming? Let’s break it down.
💎The market is currently unfolding within a Zigzag Correction (A-B-C) pattern, and we appear to be in Wave C the final leg of this structure. Wave A has already played out with a sharp downward move, followed by Wave B, which acted as a countertrend rally. Now, Wave C is in progress, forming the last phase of this corrective cycle.
💎Since this is a 5-3-5 Zigzag Correction, the third wave of Wave C has already developed, meaning the market is nearing a critical Demand Zone at 4.0283. This level is a strong support zone where a potential reversal could occur. If the price reacts positively from this area, it could mark the end of the correction and signal the beginning of a new bullish phase, starting Wave 1 of the next uptrend.
💎However, if the price remains trapped between the Moderate Support and Moderate Resistance zones, we may see an extended period of sideways consolidation before any decisive move. A key confirmation to watch is the RSI approaching oversold conditions, which would indicate that downward pressure is weakening and the probability of a bullish reversal is increasing.
As always, Paradisers, the key to profiting in this market is waiting for high-probability setups. If this correction is indeed ending, the next move could be explosive. Stay sharp, stay disciplined, and trade smart!
MyCryptoParadise
iFeel the success🌴

Is Mantra OM The Next Luna?Hello, Skyrexians!
This Monday was calm until the huge drop on BINANCE:OMUSDT has not interrupted us. In 1 hour price dropped more than 80% and now Mantra's holders are panicking is this coin scam or not. It's almost useless to have any strong technical analysis, but as we know this coin dropped because of rug pull. In case of Luna scam we have seen the infinite coins printing, so its price became 0. OM only has the negative news without any algorithmic issues.
We can only apply Fibonacci levels on the log scale and we can see that there is a chance that this is only the wave A inside 2. If $0.2 will be held we can have a chance for the scenario on the chart, otherwise it's scam!
Best regards,
Skyrexio Team
___________________________________________________________
Please, boost this article and subscribe our page if you like analysis!

OM/USDT: what happened?Hello friends
Due to the heavy price drop, many holders of this currency fell into extreme fear, but according to the price chart, you can see that after this stunning growth, the price correction should finally happen.
Now, if you are risk-averse, you can buy in steps within the specified support areas and move with it to the specified targets, of course, with capital and risk management.
*Trade safely with us*

Breaking: MANTRA coin ($OM) Nosedived Nearly 100% Today MANTRA, a Security first RWA Layer 1 Blockchain, capable of adherence and enforcement of real world regulatory requirements that is Built for Institutions and Developers, offering a Permissionless Blockchain for Permissioned applications saw its native token Mantra Coin ( CRYPTOCAP:OM ) plummeted 94% today amidst falling out of a bearish symmetrical triangle.
The bloodbath came as a shock as days ago it was sitting on a market cap of $6 Billion and major deals were iterated, including a $1 Billion tokenization pact with DAMAC.
However, the main trigger was an allegedly suspicious 3.9M CRYPTOCAP:OM deposited (linked to team wallets) to OKX, fueling sell-off fears.
Key Allegations
Team controls ~90% supply – raising manipulation concerns.
Undisclosed OTC deals – tokens reportedly sold at 50% discounts.
Exchange liquidations – forced closures worsened the crash.
However, Binance CEO Said:
"OM CRYPTOCAP:OM 90% price crash was due to massive cross-exchange liquidations, tokenomics changes, and large token dumps".
In response to an X post, the Mantra team said:
"we want to assure you that MANTRA is fundamentally strong. Today’s activity was triggered by reckless liquidations, not anything to do with the project. One thing we want to be clear on: this was not our team. We are looking into it and will share more details about what happened as soon as we can."
Technical Outlook
As of the time of writing, CRYPTOCAP:OM is down 28.6% according to the 4 hour price chart. the asset is showing signs of a reversal but the diamond hands are weak prior the extreme token sell-off as hinted by the RSI at 11.51, this is extremely oversold with a possible reversal lurking around the corner, should the team figure out the cause of the bloodbath, CRYPTOCAP:OM might reclaim $1 zone and then possibly the $5 price point.
With the market cap presently $697 million, CRYPTOCAP:OM has enough strength for a bounce back after the mainstream crypto market might have digest the news.
MANTRA Price Live Data
The live MANTRA price today is $0.719974 USD with a 24-hour trading volume of $2,499,155,492 USD. MANTRA is down 88.55% in the last 24 hours. The current CoinMarketCap ranking is #81, with a live market cap of $697,898,136 USD. It has a circulating supply of 969,337,399 OM coins and the max. supply is not available.

The Spring of OM: Wyckoff Signals a Rebirth After the CrashMANTRA ( BYBIT:OMUSDT.P ) Technical Analysis: Post-Crash Recovery and Wyckoff Accumulation Insights
TradingView
On April 13, 2025, MANTRA (OM) experienced a significant price drop, declining approximately 88% within 24 hours. This sharp downturn was attributed to a combination of factors, including market-wide volatility and potential large-scale sell-offs. Despite this abrupt decline, technical indicators suggest that OM may be entering a Wyckoff Accumulation Phase, presenting potential investment opportunities.
Understanding the Recent Price Movement
Following the crash, OM's price stabilized around $0.70, with a 24-hour trading volume exceeding $2.3 billion. The Relative Strength Index (RSI) and Commodity Channel Index (CCI) indicators both entered oversold territories, indicating a potential for price reversal.
CoinMarketCap
CentralCharts
Wyckoff Accumulation Phase Analysis
The Wyckoff Method identifies specific phases in market cycles, with the Accumulation Phase characterized by large investors ("smart money") buying assets at lower prices. Key features of this phase include:
Selling Climax (SC): A sharp price decline with high volume, as seen in OM's recent drop.
TradingView
Automatic Rally (AR): A quick rebound following the SC, indicating initial buying interest.
Secondary Test (ST): Price revisits the SC level to test support, often with lower volume.
Spring: A false breakout below support levels to shake out weak holders, potentially observed in OM's price action.
Mudrex
Sign of Strength (SOS): A strong price increase with higher volume, signaling the end of accumulation.
Currently, OM's price behavior aligns with the early stages of this accumulation pattern.
Investment Considerations
For investors considering entry points:
Risk Tolerance: Given the recent volatility, only risk capital should be used.
Technical Confirmation: Await confirmation of the SOS phase before significant investment.
Volume Analysis: Monitor trading volumes for signs of increased institutional interest.
Understanding the Wyckoff Accumulation Phase can provide insights into potential market reversals.

OMUSD - Monthly Channel IndicatorOn the monthly chart this dump is shown as just a retest of the Gaussian Channel indicator which price is still above.
Very big move which could shake a lot out.
If you are long on this Monthly you should not be very worried. Unless the intensity of the downward move is too much.
Monthly chart.

Mantra $OM Welcome to crypto! Why did this happen?CRYPTOCAP:OM just embarrassed the entire RWA space.
90% wiped. Billions gone. All in under an hour.
This wasn’t random — it was coming.
The CRYPTOCAP:OM disaster explained
It started with one wallet.
A massive deposit of 3.9 million CRYPTOCAP:OM hit OKX.
That alone raised eyebrows — but when people realized who it belonged to, things got serious.
The wallet was reportedly linked to the team.
And here’s the kicker:
The OM team controls around 90% of the total token supply.
Team OM pumped price last year
When they move tokens, people notice — and for good reason.
This wasn’t the first red flag.
The CRYPTOCAP:OM community had already been losing trust:
– Quiet changes to tokenomics
– Delayed airdrops
– Alleged price manipulation via market makers
It was all bubbling under the surface.
So when the OKX deposit happened… panic set in.
The market saw it as the beginning of a dump.
And they were right.
Selling pressure started building — fast.
But things spiraled because of one more thing: OTC deals.
There were rumors the team made private token deals at huge discounts —
Some investors reportedly got in at 50% off or more.
That created a perfect storm.
Once CRYPTOCAP:OM dropped below those discounted prices, OTC buyers started cutting losses.
Retail followed. Fear kicked in.
Everyone was racing for the exit.
The chain reaction was brutal.
– Sell-offs
– Stop-losses triggered
– Leverage liquidations
– Liquidity vanished
All in under 60 minutes.
The market collapsed.
Over SEED_TVCODER77_ETHBTCDATA:6B in value gone.
It wasn’t just a price crash — it was a full ecosystem wipeout.
And the worst part?
Most holders had no idea it was coming.
If you’re in crypto, let this be a lesson.
⚠️ Be cautious with tokens where:
– A few wallets control the supply
– Promises get delayed
– The price feels “too stable”
– The team lacks transparency
DYOR isn’t optional anymore.
Final thoughts:
The RWA sector is one of crypto’s most promising narratives.
But events like this?
They damage credibility across the board.
This wasn’t just a rug. It was a trust collapse.
#RWA deserves better.
Thank you, Real World Asset Watchlist
Best regards EXCAVO


#OM/USDT#OM
The price is moving in a descending channel on the 1-hour frame and is adhering to it well and is heading to break it strongly upwards and retest it
We have a bounce from the lower limit of the descending channel, this support is at a price of 5.92
We have a downtrend on the RSI indicator that is about to break and retest, which supports the rise
We have a trend to stabilize above the Moving Average 100
Entry price 6.27
First target 6.66
Second target 6.97
Third target 7.41

$OM Bullish pennantBINANCE:OMUSDT is currently doing a bullish pennant pattern after an explosive move from 1.67 area. A break of this pennant could send BINANCE:OMUSDT price parabolically to around 6.40 - 6.80 area, measured using the length of the pole in confluence with 2.618 fib level.
In a typical retrace on a continuation move towards the upside, volume tends to dry out, signalling that a move may be due sooner than later. In futures, BINANCE:OMUSDT.P O/I continue to hover around $14M which is a good sign given the sentiment of the market towards premium RWA projects, with a positive L/S ratio.
On the flipside, a break of the lower level will only continue the current ranging move of BINANCE:OMUSDT towards 3.30 - 3.50 area.
Given that the market is still focusing on BTC, BINANCE:OMUSDT will continue to move in a laggard fashion, therefore there is still time to find a long entry near 3.55 - 3.63 area. Once money shifts towards alts, this will propel BINANCE:OMUSDT to new ATHs.
As always, manage your risks.
GL!
- JD

OM | MANTRA | Bullish Cycle OVER?MANTRA has made leaps and strides towards a new ATH, whilst the rets of the market was trading lower for the past few weeks.
But it seems the buying pressure has run out, if we take a look at the technical indicators.
Interestingly enough, if we take a look at OM through the Weekly timeframe and we pull up the Fibonacci extension, the current cycle ended at exactly 2.618 - a significant marker in the Fib zones.
It is said that, after reaching 2.618, a retracement to 0.786 is probable. This would put us roughly at the major previous resistance zone before the ATH breakout:
The Moving Averages is another great place to watch for possible bounce zones:
After this correction (which could go even lower) the price could potentially bounce back, as it gears up for a new ATH. I'd be looking to buy from the 0.786 and lower, possibly as low as the $2 mark.
________________________
OKX:OMUSDT

#OM/USDT#OM
The price is moving in a descending channel on the 1-hour frame and is adhering to it well and is heading to break it strongly upwards and retest it
We have a bounce from the lower limit of the descending channel, this support is at a price of 6.64
We have a downtrend on the RSI indicator that is about to break and retest, which supports the rise
We have a trend to stabilize above the Moving Average 100
Entry price 7.10
First target 7.48
Second target 7.71
Third target 8.00

OM Short Trade OpportunityMarket Context:
OM appears to have completed its fifth wave upward, suggesting a potential correction phase. Weak macro fundamentals and liquidity on the downside indicate that a break of support could lead to further downside movement.
Trade Details:
Entry Zone: Around $7.7
Take Profit Targets:
$7.0
$6.1
$5.4
Stop Loss: Daily close above $8.3
This setup aims to capitalize on a breakdown of support and capture momentum toward lower liquidity zones. 📉

Can #OM Bulls Save the Day or Not? Bears Ready For a Showdown Yello, Paradisers! Is #OM gearing up for a massive breakdown, or will the bulls step in to save the day? Let's analyze the #Mantra's latest trade setup:
💎#OMUSDT is flashing clear warning signs of weakness after forming a classic bearish divergence on the 8H timeframe. While price made higher highs, the oscillator showed lower highs, signaling a loss of bullish momentum. This is a textbook setup for an impending reversal unless buyers step in aggressively.
💎The key level to watch is the $7.48 support zone—a critical area that bulls must defend. If OM closes a candle below this level, expect a sharp drop toward the $5.00 support, with an ultimate downside target of $3.17 if the selling pressure intensifies.
💎On the flip side, the bearish setup gets invalidated above $9.26. If bulls manage to break this resistance with strong volume, we could see #OM pushing higher. However, until that happens, the bias remains bearish, and lower levels look far more likely.
The market is at a crucial tipping point—will #OMUSD crash or bounce? Let us know your thoughts in the comments. Are you shorting, or do you see a surprise rally coming? Let’s discuss.
MyCryptoParadise
iFeel the success🌴

OMUSDT(MANTRA) Updated till 15-02-25OMUSDT(MANTRA) Daily timeframe range. this thing is in absolute roll. outperforming many alts out there right now. breaking 8.2912 will push it to price discovery and new high. even its cools down a bit if it stay above 6.4765 the push will continue.

5 Wave Structure completeIt seems like BINANCE:OMUSD has completed its final 5th wave, are we about to finally enter the correction phase? OM has been really strong in its rally considering the rest of the cryptospace has been lagging behind.

Do not short this coin yet!!! Hi everyone,
We totally understand how much you want to short this coin at this point, but we strictly suggest to hold your horses as it will push higher..
Instead if it will try to grab the longs (drop it) Buy the dip. And when i say the dip we talking about 5.7 entry even lower if possible, with spreading your capital.
This coin is still on uptrend!
More updates are coming for this coin.
