ONDO, rekt, fresh low...LSE:ONDO
🎯Price printed a 3 white knight bullish engulfing pattern, jumping above the daily pivot before being rejected hard to fresh lows, keeping the downtrend intact. The 0.786 Fibonacci retracement has been penetrated as price loses the High Volume Node support. S1 pivot is the next target, $0.3.
📈 Daily RSI is showing unconfirmed bullish divergence.
👉 Analysis is invalidated above $0.5 swing high.
Safe trading
ONDO

ONDO Short-term analysis | Trading and expectationsLSE:ONDO
🎯Price printed a 3 white knight bullish engulfing pattern, jumping above the daily pivot and the descending resistance trend-line. Price must get above $0.5 to negate the bearish divergence that has emerged. Wave 1 of a new uptrend appears to be underway.
📈 Daily RSI tapped oversold with bullish divergence, where it caught a bid.
👉 Analysis is invalidated below the swing low, $0.35
Safe trading

ONDO Macro analysis | The bigger picture | Long-term holdersLSE:ONDO
🎯 Wave 2 appears complete at the altCoin golden pocket, 0.786 Fibonacci retracement and High Volume Node support. Price is reacting well with a bullish engulfing candle. Wave 3 has an expected target in price discovery os the R£ weekly pivot $4.21, offering a 10x from here.
📈 Weekly RSI hit oversold threshold and ticked up bullishly.
👉 Analysis is invalidated below $0.35
Safe trading

ONDO/USDT - Major Trendline Test Reversal or Bearish Rejection?ONDO/USDT on the 12H timeframe remains within a clear primary downtrend structure after failing to hold the high area above 0.95. Price continues to form lower highs and lower lows, confirming seller dominance in the medium-term trend.
However, the latest candles show an impulsive bullish reaction from the lower demand zone, with price now testing the descending trendline, which acts as the main dynamic resistance.
---
Pattern & Structure Explanation
Primary Pattern: Descending Trendline (Bearish Structure)
Price has consistently respected the descending trendline → confirming the bearish trend.
The current move is a bullish pullback toward resistance, which is a critical decision area:
Potential rejection point (bearish continuation)
Or an early breakout signal (trend reversal confirmation)
No reversal is confirmed until price achieves a valid break and close above the trendline.
---
Key Levels (Horizontal Structure)
Major Resistance:
0.453 – 0.470 (trendline + minor supply), 0.519, 0.692, 0.761
Major Support:
0.380 – 0.360 (recent demand zone), 0.350 (last structural low)
These levels are clearly defined by previous price reactions and horizontal structure on the chart.
---
Bullish Scenario
The bullish scenario is valid only if:
1. Price breaks and closes above the descending trendline (12H close).
2. A healthy retest holds the 0.45–0.47 zone as new support.
Bullish Targets (Step-by-Step):
0.519 → 0.692 → 0.761 (mid-term recovery target)
Such a breakout would indicate:
The end of bearish momentum
A potential medium-term trend reversal
---
Bearish Scenario
The bearish scenario remains the base case as long as:
1. Price fails to break the descending trendline
2. A clear rejection or bearish candle pattern appears at resistance
Bearish Targets:
0.380 → 0.360
A breakdown below 0.350 would open the path for new lower lows.
Rejection at the trendline often provides an ideal continuation short setup within a downtrend structure.
---
Conclusion
ONDO/USDT is currently trading at a critical decision zone.
The dominant trend remains bearish, while short-term bullish momentum is being tested.
Trendline break = reversal opportunity
Trendline rejection = downtrend continuation
Traders are advised to wait for confirmation, not speculation, as this area will determine the next major move.
---
#ONDO #ONDOUSDT #CryptoAnalysis #TechnicalAnalysis #Downtrend #TrendlineBreak #Altcoin #MarketStructure #PriceAction

ONDO Update📊 ONDO Update
ONDO has broken below the blue support level 🔵,
signaling sellers are in control.
As long as price stays below this zone,
downside risk remains elevated and the trend stays weak.

Ondo To Fill Trump Toilet Tweet Crash WickOndo breaking out of triangle pattern. I'm looking for Ondo to fill Trump toilet tweet crash Wick similar to how Zebec Network has done previously. I will be taking a crypto futures short trade on this.

ONDO 15m Apex - LONG 5-10%ONDO here, 15m chart. Currently settling into an apex play. Getting pinched between the 100ma and the 200s.
I’m thinking .50 target, like maybe 10%. Stop loss should be around .5% or 1% depending on your risk tolerance and leverage size.
Invalidate if candles close below the 15m white 100sma.
Hit me up if y’all have any questions or requests.

ONDOUSDT — Demand Zone Retest Before the Next Big Trend?ONDOUSDT is heading toward one of the most important demand zones in its entire price history — 0.26–0.21, the very area where the previous macro rally was born.
This zone is not just support; it represents institutional accumulation, a level where smart money previously stepped in with size.
The 4D market structure has been printing lower highs and lower lows, showing sustained weakness. Yet as long as the 0.26–0.21 demand zone remains intact, the probability of a macro reversal is still on the table.
A long downside wick in the past indicates a liquidity sweep, not a true breakdown — a common signature before a new structural turn.
Now, ONDO is preparing to retest this key area, setting up a make-or-break moment for the next major trend.
---
Bullish Scenario — Reversal from the Demand Origin
If ONDO taps into the 0.26–0.21 zone and shows strong bullish reaction, this could trigger a significant recovery.
Bullish signals to watch:
Strong rejection (pin bar / long tail) or bullish engulfing candle on 4D
Increasing buy volume
Break of the nearest lower-high → formation of a new higher-high
Upside targets:
Target 1: 0.65
Target 2: 0.90
Target 3: 1.20 if momentum extends
A bounce from this zone could mark the first major reversal since the 2024 top.
---
Bearish Scenario — Breakdown of the Final Support
If the price closes below 0.21 on the 4D timeframe, the demand zone loses its strength, confirming a structural breakdown.
If breakdown confirmed:
Expect volatility to spike
Retest of 0.21 turning into resistance is likely
Bearish continuation becomes dominant
Downside targets:
0.15
0.10
0.08 (old liquidity region)
A breakdown opens the door to a deeper correction phase.
---
Pattern Explanation
We already saw a liquidity sweep — an early sign of accumulation or stop-hunt.
Price is drifting slow and steady toward the origin demand.
If buyers defend this zone, the structure can form a Reversal Base Pattern, often leading into a strong bounce.
---
ONDO is approaching the most decisive zone of the year.
The 0.26–0.21 demand area will determine whether ONDO prints a macro rebound or enters its next major bearish leg.
The next reaction from this zone is likely to be explosive.
---
#ONDO #ONDOUSDT #CryptoAnalysis #DemandZone #PriceAction #MarketStructure #Altcoins #CryptoTA

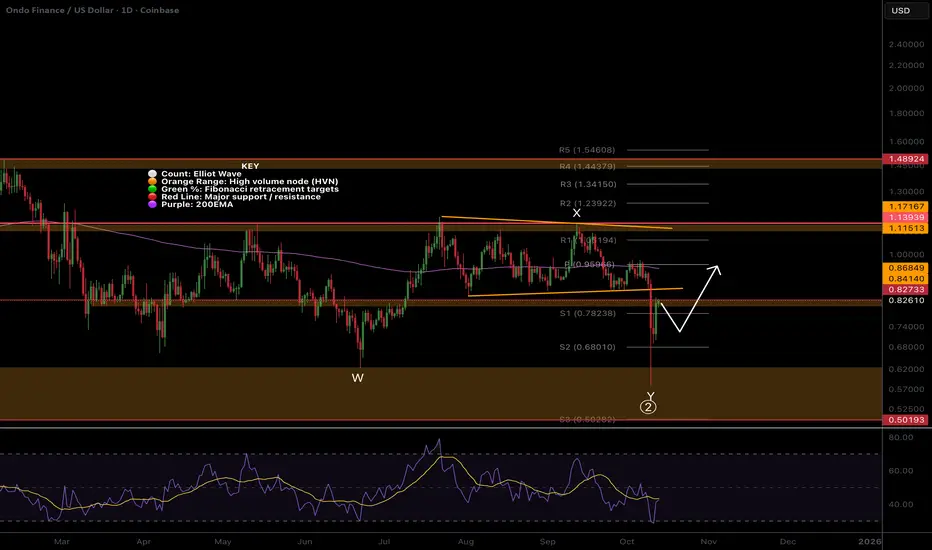
ONDO,1 more push lowerLSE:ONDO Price is sitting just above High Volume Node support, testing the descending trend-line as resistance. As long as we are below the trend-line, the probability is to the downside.
Wave 2 appears complete after 5 waves down from the wave X flat correction. Price was front-run at the golden pocket Fibonacci retracement, but only a bounce so far. We are below the daily pivot and 200EMA, which is bearish.
📈 Daily RSI tapped oversold twice with slight bullish divergence.
👉 Continued downside has a target of the bottom of the High Volume Node at $0.5
Safe trading

ONDO beaten down, resistance aheadLSE:ONDO has work to do but I am a forward looking narrative trader and believe we have a major RWA (Real World Asset tokenisation) narrative ahead to pump these coins.
Ahead lies High Volume Node resistance, previous channel lower boundary, descending daily 200EMA and the daily pivot to overcome... not easy but this is crypto and can be all taken out in 5 seconds.
Price terminated with a front run of the golden pocket showing strength over other alts.
Daily RSI hit oversold, no divergence
Safe trading
ONDO/USDT — At Golden Zone: Major Rebound or Complete Breakdown?ONDO is now sitting at its most critical structural level of 2025 — the golden demand zone between 0.735 and 0.62 USDT.
This area has historically acted as the foundation for every major bullish rally. Each time price tapped this zone, strong accumulation followed.
But this time, things look different — the chart reveals a persistent sequence of lower highs, signaling weakening momentum, while the latest deep wick indicates a liquidity grab — a classic sign that large players might be accumulating or offloading positions before a major move.
The key question now:
> Will this zone become the launchpad for another major rally, or the final floor before a deep collapse?
---
Market Structure & Price Pattern
Primary Range: ONDO has been ranging broadly between 0.62 – 2.10 since mid-2024, with a steady bearish compression forming through lower highs.
Demand Zone (Yellow Block): 0.735 – 0.62 remains a strong historical accumulation area. Rejection or bullish confirmation here could trigger a macro reversal.
Liquidity Sweep: The long downside wick suggests liquidity has been collected — often preceding a sharp move in the opposite direction.
---
Bullish Scenario — Reversal from the Golden Zone
Confirmation Conditions:
A 4-day candle close above 0.735, or a strong bullish rejection candle within the zone.
Increasing volume with follow-through momentum.
Upside Targets:
TP1: 0.8665 — local resistance
TP2: 1.10 — mid-range resistance
TP3: 1.44 – 1.96 — macro distribution zone
If price forms a higher low above 0.735 after rejection, ONDO could enter a re-accumulation phase targeting mid-range resistance.
Stop Loss: Below 0.60 to avoid being trapped by liquidity spikes.
---
Bearish Scenario — Breakdown from Structural Base
Confirmation Conditions:
4D candle closes below 0.62 with strong selling pressure.
Failed retest of 0.62–0.70 (support turns resistance).
Downside Targets:
TP1: 0.50 — minor liquidity zone
TP2: 0.40 — structural support
TP3: 0.25 — full capitulation extension
A confirmed break below 0.62 would mean ONDO’s macro structure has fully collapsed, indicating the start of a prolonged bearish phase.
---
Strategic Summary
The 0.735 – 0.62 zone is ONDO’s line of survival.
As long as price holds or rejects strongly from this area, a macro reversal remains possible.
But a confirmed breakdown below it could lead to a full structural reset toward 0.40 or even 0.25.
> Simply put: this is ONDO’s “make or break” moment —
Either the base for a strong comeback, or the beginning of a deeper decline.
---
Trading Approach
Wait for 4D confirmation before entering any position.
Conservative entries near 0.63–0.68 with SL below 0.60.
Increase position size only after confirmed structure reversal.
Manage risk strictly — volatility in this zone is high and unpredictable.
#ONDO #ONDOUSDT #CryptoAnalysis #PriceAction #SwingTrade #DemandZone #SupportAndResistance #CryptoChart #LiquiditySweep #CryptoTechnical #4DChart #SmartMoneyConcept #CryptoMarket #ReversalSetup

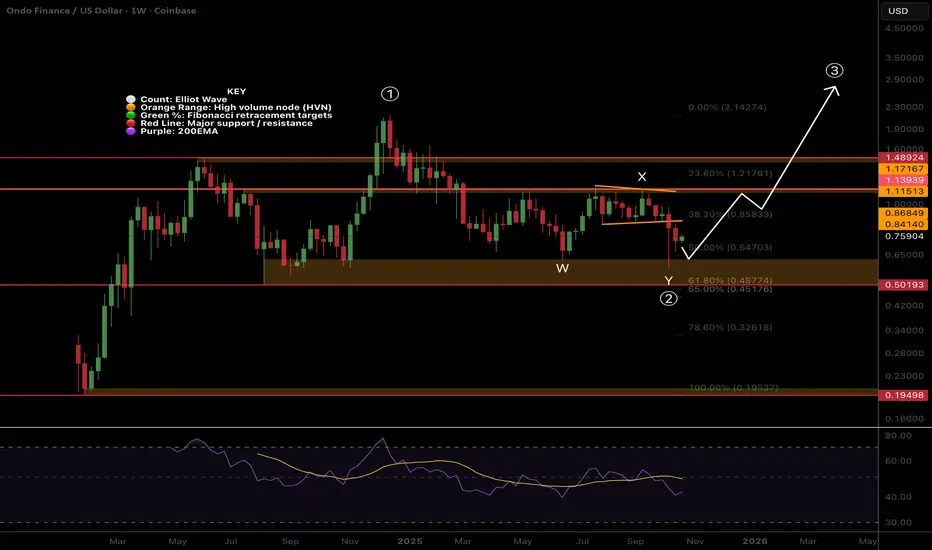
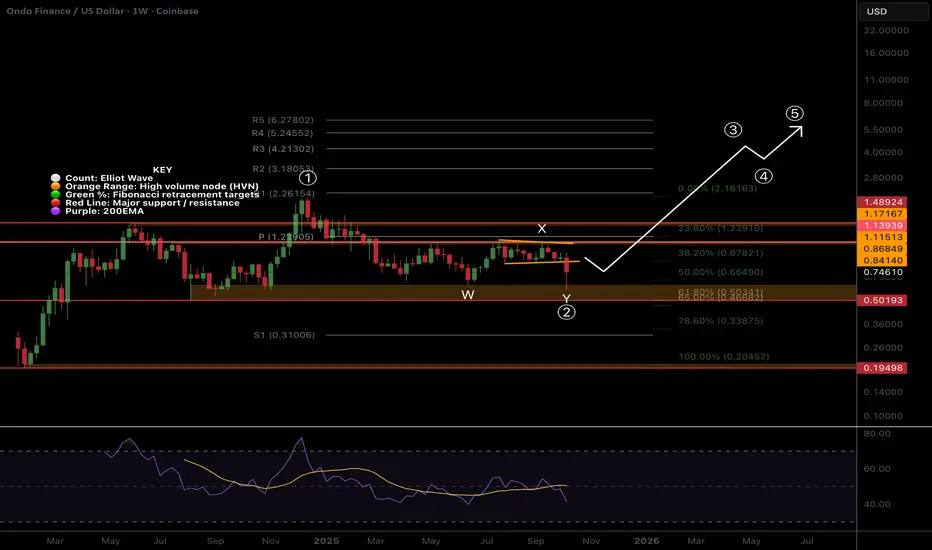
$ONDO wave (2) Bottomed?LSE:ONDO appears to have completed wave 2 with WXY complex correction ending at the major High Volume Node support just above the golden pocket.
Weekly RSi has printed bullish divergence but is not yet confirmed. A dip into the wick and High Volume Node is to be expected before high but may not get there.
Wave (3) has an initial target of the R2 weekly pivot at $3.18, a strong move from here. $1.22 weekly pivot and High Volume Node will put up a fight.
Safe trading
ONDO, Time for wave 3 up into ATH?What a mess Friday turned out to be with a recording breaking liquidation event with the numbers still growing - bigger than FTX!
SUNK COST FALLACY: THE DAMAGE IS DONE, DO NOT PANIC IN AND OUT OF POSITIONS.
So many alt-coins proved there is nothing but thin air holding them up - no real demand whatsoever! I'll take a look at some charts today. Now these wicks can be classed as 'anomalies' in technical analysis but in this case i think we've revealed some of the strong tokens now with real backing.
It is expected that with such large wicks we at least test the centre of the wick on one more terrifying shake-out that isnt actually as bad as the one we just has but feels it because traders and investors are been kicked while their down in a state of panic.
-------------
LSE:ONDO appears to have completed a WXY wave 2 complex correction finding strong support in the High Volume Node.
Price is in a bearish market structure at double resistance- High Volume Node, channel lower boundary. Traders should be cautious.
Price is likely to have one more pullback to scare weak hands out before starting wave (3) of 3 to new all time highs. We could see $0.68 challenged at the S2 pivot.
If we break back into the channel the daily 200EMA will be the next resistance.
Safe trading
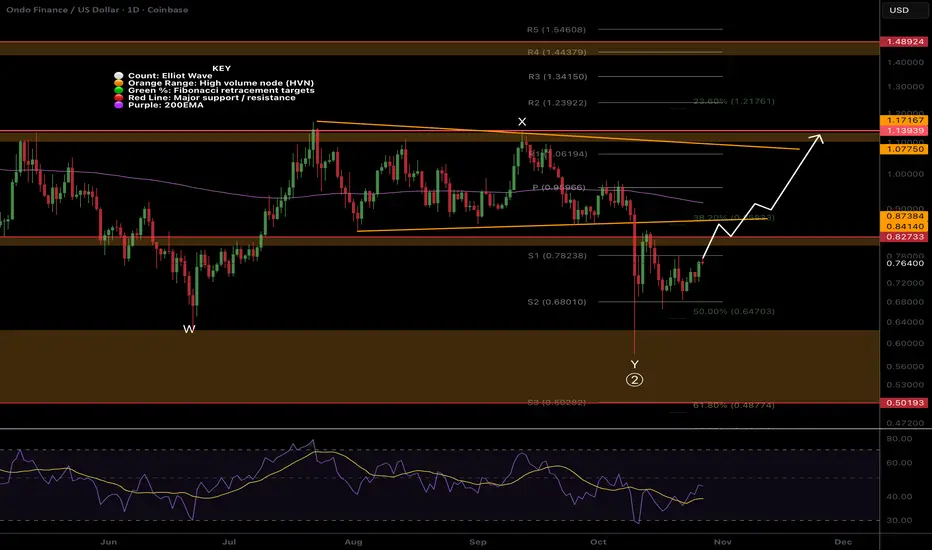
ONDO Extreme opportunity zoneI have been sharing my wave Y of (2) target for a while at the Fibonacci golden pocket and major High Volume Node support, $0.5. Demand soaked up the downward pressure here leaving a long lower wick. The next downside target is the ‘alt-coin’ golden pocket, 0.786, and S1 pivot at $0.31 and would be an excellent buying opportunity!
Weekly RSI has plenty of room to fall with no bullish divergence forming yet.
Wave (3) target is the R3 weekly pivot at $4.2 a decent move from here!
Safe trading
ONDO Looks Bearish (12H)At the top, we have a hunt followed by a bearish CH, and then the formation of a neutral range, which represents our distribution phase.
The price is near a resistance zone and has been rejected; therefore, it is expected to move toward our downside targets soon.
The targets are marked on the chart.
A daily candle closing above the invalidation level will invalidate this analysis.
For risk management, please don't forget stop loss and capital management
When we reach the first target, save some profit and then change the stop to entry
Comment if you have any questions
Thank You

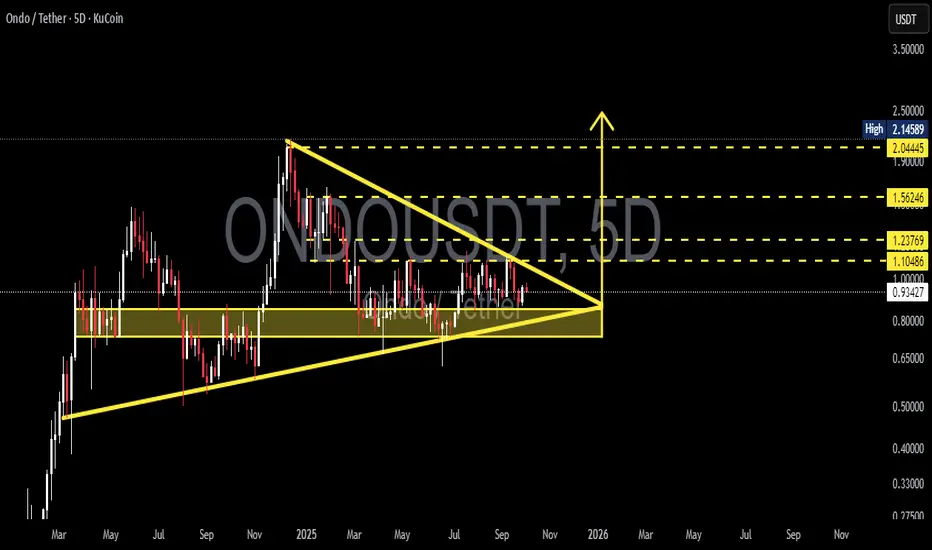
ONDO/USDT — Symmetrical Triangle: Breakout or Breakdown Ahead?🔎 Overview
ONDO is currently trading inside a large consolidation phase after rallying to a peak around $2.14 earlier this year. Price action has now formed a symmetrical triangle pattern, compressing between lower highs and higher lows, right at the critical support zone of $0.80–1.00.
This setup signals that the market is building up pressure — and the next breakout or breakdown will likely dictate the mid-term direction.
---
🏛️ Key Technical Levels
Current Price: ~$0.93
Major Support Zone: $0.80 – $1.00
Upside Targets (if breakout occurs):
$1.10 → breakout trigger level
$1.24 → first resistance target
$1.56 → secondary target
$2.04 – $2.15 → major target, previous swing high
Downside Levels (if breakdown occurs):
$0.65 → minor support
$0.50 → psychological support
$0.33 → next historical support
---
📐 Pattern Explanation
Symmetrical Triangle → formed by lower highs and higher lows converging into an apex.
Indicates price compression and a potential big move ahead.
Directional bias: Often acts as a continuation pattern (favoring bullish trend continuation), but confirmation is essential.
---
🚀 Bullish Scenario
1. Confirmation: A 5D close above the upper trendline and >$1.10 with strong volume.
2. Aggressive entry: Enter on breakout above $1.10.
3. Conservative entry: Wait for a successful retest around $1.00–$1.10 zone.
4. Upside Targets:
TP1: $1.24
TP2: $1.56
TP3: $2.04 – $2.15
5. Stop-loss: Below the breakout zone → around $0.90–0.95, or safer below $0.80.
---
🐻 Bearish Scenario
1. Confirmation: A strong 5D close below $0.80 support zone with volume.
2. Entry: Short/exit longs after breakdown or on failed retest back to $0.80.
3. Downside Targets:
TP1: $0.65
TP2: $0.50
TP3: $0.33
4. Stop-loss (for shorts): Above $0.85–0.90.
---
⚠️ Key Points to Watch
Volume spike is crucial for validating breakout/breakdown.
Retest confirmation: Breakouts are stronger if retests hold.
False breakouts are common in triangle patterns — use higher timeframe confirmation (5D or weekly).
Risk management: Position sizing and R:R ratio are critical; avoid overexposure.
---
📝 Conclusion
ONDO is at a critical decision point within a large symmetrical triangle.
Bullish breakout above $1.10 could open the path toward $1.24 → $1.56 → $2.04–2.15.
Bearish breakdown below $0.80 may trigger downside toward $0.65, $0.50, and $0.33.
With price nearing the triangle apex, volatility expansion is almost guaranteed — traders should prepare for a major move in either direction.
---
#ONDO #ONDOUSDT #Crypto #Altcoin #TechnicalAnalysis #TrianglePattern #Breakout #BullishScenario #BearishScenario
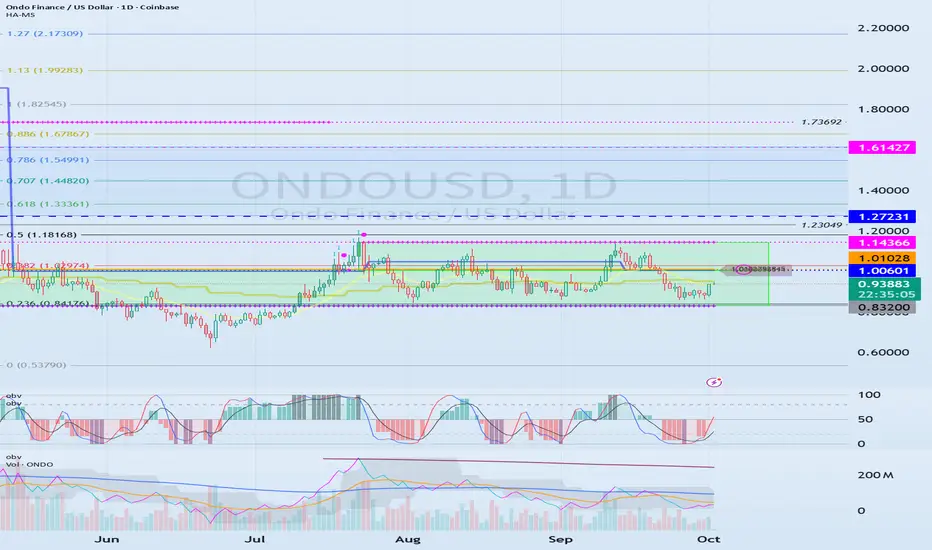
The key is whether support is found at 1.00601-1.01028
Hello, traders. Nice to meet you.
If you "Follow," you'll always get the latest information quickly.
Have a great day.
-------------------------------------
(ONDOUSDT 1W Chart)
The key is whether the price can find support near 0.832 and rise above the M-Signal indicator on the 1W chart.
The resistance zone is 1.27231-1.61427.
If it falls below 0.832, you should stop trading and wait and see how things go.
-
(1D Chart)
The key is whether the price can rise above the 1.00601-1.14366 range, which is the HA-Low and HA-High indicators.
The HA-High ~ DOM (60) range is formed within the 1.00601-1.14366 range, so if this range breaks upward, a step-up trend is likely.
However, the resistance zone on the 1W chart is located at 1.27231-1.61427, so the trend will ultimately be determined by whether support is found within this range.
What we can do is buy in the 0.832-1.14366 range and sell in the 1.27231-1.61427 range.
The reference range for buying is 1.00601-1.01028.
-
Thank you for reading.
We wish you successful trading.
--------------------------------------------------
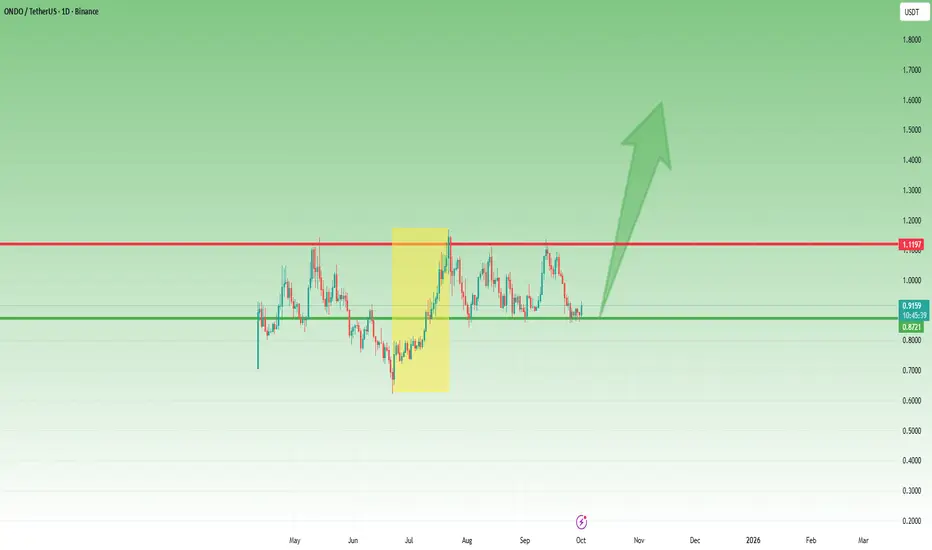
ONDO – Bullish Reversal from SupportWhat happened:
After the low back in June at 0.62, ONDO delivered a 100% rally. As expected after such a move, the price corrected and then settled into a range.
Key question:
Is this strong bounce from support the beginning of the next leg up?
Why I’m bullish:
• The recent reversal from support shows buyers are defending the structure.
• The first leg up measured a clean 100% move, and the current setup mirrors that strength.
• By extension, a second leg of similar length could take ONDO above 1.50.
Trading plan:
• I remain bullish as long as 0.80 holds.
• A continuation from here would confirm that the range is resolved to the upside, opening the path to 1.50+.
Bottom line:
ONDO combines strong fundamentals in tokenized real assets with a healthy technical picture. Support is clear and the potential reward above 1.50 is on the table. 🚀
EDEN better than ONDOCBOE:EDEN Better than LSE:ONDO
🔹 1. Price & Movement
ONDO: $0.8814 (down -0.09%)
EDEN: $0.4177 (up +2.63%)
➡️ EDEN currently looks more bullish in the short term as it is rising, while ONDO is stagnant/slightly down.
🔹 2. Market Cap
ONDO: $2.78 billion
EDEN: $76.80 million
➡️ ONDO is much larger and more established. EDEN is still smaller, making it riskier but also has the potential to provide large returns if it grows successfully.
🔹 3. 24-Hour Volume
ONDO: $173.90 million
EDEN: $652.47 million
➡️ Interestingly, despite EDEN's smaller market cap, its trading volume is higher than ONDO's. This indicates that market sentiment for EDEN is hot and heavily traded.
🔹 4. Supply
ONDO: 3.15B circulating (maximum supply unclear)
EDEN: 183.87M circulating (maximum supply 1B)
➡️ EDEN still has a large supply gap going forward, which could impact token inflation.
➡️ ONDO's maximum supply is unclear, meaning there could be a risk of additional issuance.
🔹 5. Age & Track Record
ONDO: Since January 18, 2024 → almost a year old, proven to be resilient.
EDEN: Just launched September 28, 2025 → still very new, high risk.
🔹 6. CMC Ranking
ONDO: #39 (top tier, relatively safe & stable).
EDEN: #426 (still small, high risk-high reward).
📊 Conclusion
ONDO → Safer, large capitalization, well-established, suitable for investors seeking stability and lower risk.
EDEN → New, small capitalization but high volume, bullish sentiment, suitable for investors willing to take high risks for the potential of large profits.
👉 Strategy:
If you're looking for long-term security, ONDO is better.
If you're speculative and want quick profits, EDEN is more promising, but the risk is high.
#ONDO #EDEN

EDEN Better than ONDOCBOE:EDEN Better than LSE:ONDO
🔹 1. Price & Movement
ONDO: $0.8814 (down -0.09%)
EDEN: $0.4177 (up +2.63%)
➡️ EDEN currently looks more bullish in the short term as it is rising, while ONDO is stagnant/slightly down.
🔹 2. Market Cap
ONDO: $2.78 billion
EDEN: $76.80 million
➡️ ONDO is much larger and more established. EDEN is still smaller, making it riskier but also has the potential to provide large returns if it grows successfully.
🔹 3. 24-Hour Volume
ONDO: $173.90 million
EDEN: $652.47 million
➡️ Interestingly, despite EDEN's smaller market cap, its trading volume is higher than ONDO's. This indicates that market sentiment for EDEN is hot and heavily traded.
🔹 4. Supply
ONDO: 3.15B circulating (maximum supply unclear)
EDEN: 183.87M circulating (maximum supply 1B)
➡️ EDEN still has a large supply gap going forward, which could impact token inflation.
➡️ ONDO's maximum supply is unclear, meaning there could be a risk of additional issuance.
🔹 5. Age & Track Record
ONDO: Since January 18, 2024 → almost a year old, proven to be resilient.
EDEN: Just launched September 28, 2025 → still very new, high risk.
🔹 6. CMC Ranking
ONDO: #39 (top tier, relatively safe & stable).
EDEN: #426 (still small, high risk-high reward).
📊 Conclusion
ONDO → Safer, large capitalization, well-established, suitable for investors seeking stability and lower risk.
EDEN → New, small capitalization but high volume, bullish sentiment, suitable for investors willing to take high risks for the potential of large profits.
👉 Strategy:
If you're looking for long-term security, ONDO is better.
If you're speculative and want quick profits, EDEN is more promising, but the risk is high.
#ONDO #EDEN

ONDO/USDTBINANCE:ONDOUSDT has tapped the horizontal support zone it’s been holding for the past 2.5 months.
This is a critical area where buyers should step in. The real trouble starts if we see clear candle closes below $0.8443. For now, there’s no issue for ONDO.

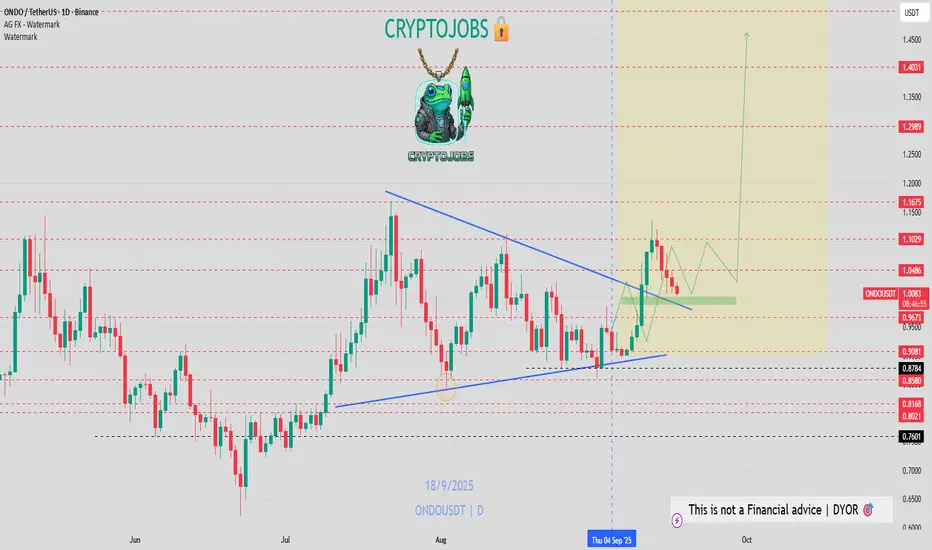
ONDO Flat Correction Near Completion?Local Analysis / Targets / Elliot Wave
Ondo appears to be in a flat correction defined by the pattern and depth of the interior Fibonacci’s. Wave X appears complete and Y is underway, often a strong sell off phase as we can see here. Price would only be expected to whip below wave W to complete wave 2 before heading to new highs in wave 3. This also tests the High Volume Node as support and golden pocket.
The first wave 3 target is $1.5 High Volume Node resistance and R4 daily pivot. RSI has plenty of room to fall.
Standard Deviation Band Analysis
Price is riding the fair value regression line but remains just below after several tests as resistance. Continued downside would put Ondo in the green opportunity buy zone which most often presents great returns and price only stays there <5% of the time.
Safe trading

ONDO - BULLISH RETEST? Remember my view on LSE:ONDO
Are we at the 50% fib & key retest before the moonshot? 🚀
Or are bears strong enough to push lower?