ONDO/USDT - Major Trendline Test Reversal or Bearish Rejection?ONDO/USDT on the 12H timeframe remains within a clear primary downtrend structure after failing to hold the high area above 0.95. Price continues to form lower highs and lower lows, confirming seller dominance in the medium-term trend.
However, the latest candles show an impulsive bullish reaction from the lower demand zone, with price now testing the descending trendline, which acts as the main dynamic resistance.
---
Pattern & Structure Explanation
Primary Pattern: Descending Trendline (Bearish Structure)
Price has consistently respected the descending trendline → confirming the bearish trend.
The current move is a bullish pullback toward resistance, which is a critical decision area:
Potential rejection point (bearish continuation)
Or an early breakout signal (trend reversal confirmation)
No reversal is confirmed until price achieves a valid break and close above the trendline.
---
Key Levels (Horizontal Structure)
Major Resistance:
0.453 – 0.470 (trendline + minor supply), 0.519, 0.692, 0.761
Major Support:
0.380 – 0.360 (recent demand zone), 0.350 (last structural low)
These levels are clearly defined by previous price reactions and horizontal structure on the chart.
---
Bullish Scenario
The bullish scenario is valid only if:
1. Price breaks and closes above the descending trendline (12H close).
2. A healthy retest holds the 0.45–0.47 zone as new support.
Bullish Targets (Step-by-Step):
0.519 → 0.692 → 0.761 (mid-term recovery target)
Such a breakout would indicate:
The end of bearish momentum
A potential medium-term trend reversal
---
Bearish Scenario
The bearish scenario remains the base case as long as:
1. Price fails to break the descending trendline
2. A clear rejection or bearish candle pattern appears at resistance
Bearish Targets:
0.380 → 0.360
A breakdown below 0.350 would open the path for new lower lows.
Rejection at the trendline often provides an ideal continuation short setup within a downtrend structure.
---
Conclusion
ONDO/USDT is currently trading at a critical decision zone.
The dominant trend remains bearish, while short-term bullish momentum is being tested.
Trendline break = reversal opportunity
Trendline rejection = downtrend continuation
Traders are advised to wait for confirmation, not speculation, as this area will determine the next major move.
---
#ONDO #ONDOUSDT #CryptoAnalysis #TechnicalAnalysis #Downtrend #TrendlineBreak #Altcoin #MarketStructure #PriceAction
Ondousdc

ONDOUSDT — Demand Zone Retest Before the Next Big Trend?ONDOUSDT is heading toward one of the most important demand zones in its entire price history — 0.26–0.21, the very area where the previous macro rally was born.
This zone is not just support; it represents institutional accumulation, a level where smart money previously stepped in with size.
The 4D market structure has been printing lower highs and lower lows, showing sustained weakness. Yet as long as the 0.26–0.21 demand zone remains intact, the probability of a macro reversal is still on the table.
A long downside wick in the past indicates a liquidity sweep, not a true breakdown — a common signature before a new structural turn.
Now, ONDO is preparing to retest this key area, setting up a make-or-break moment for the next major trend.
---
Bullish Scenario — Reversal from the Demand Origin
If ONDO taps into the 0.26–0.21 zone and shows strong bullish reaction, this could trigger a significant recovery.
Bullish signals to watch:
Strong rejection (pin bar / long tail) or bullish engulfing candle on 4D
Increasing buy volume
Break of the nearest lower-high → formation of a new higher-high
Upside targets:
Target 1: 0.65
Target 2: 0.90
Target 3: 1.20 if momentum extends
A bounce from this zone could mark the first major reversal since the 2024 top.
---
Bearish Scenario — Breakdown of the Final Support
If the price closes below 0.21 on the 4D timeframe, the demand zone loses its strength, confirming a structural breakdown.
If breakdown confirmed:
Expect volatility to spike
Retest of 0.21 turning into resistance is likely
Bearish continuation becomes dominant
Downside targets:
0.15
0.10
0.08 (old liquidity region)
A breakdown opens the door to a deeper correction phase.
---
Pattern Explanation
We already saw a liquidity sweep — an early sign of accumulation or stop-hunt.
Price is drifting slow and steady toward the origin demand.
If buyers defend this zone, the structure can form a Reversal Base Pattern, often leading into a strong bounce.
---
ONDO is approaching the most decisive zone of the year.
The 0.26–0.21 demand area will determine whether ONDO prints a macro rebound or enters its next major bearish leg.
The next reaction from this zone is likely to be explosive.
---
#ONDO #ONDOUSDT #CryptoAnalysis #DemandZone #PriceAction #MarketStructure #Altcoins #CryptoTA

ONDO/USDT — At Golden Zone: Major Rebound or Complete Breakdown?ONDO is now sitting at its most critical structural level of 2025 — the golden demand zone between 0.735 and 0.62 USDT.
This area has historically acted as the foundation for every major bullish rally. Each time price tapped this zone, strong accumulation followed.
But this time, things look different — the chart reveals a persistent sequence of lower highs, signaling weakening momentum, while the latest deep wick indicates a liquidity grab — a classic sign that large players might be accumulating or offloading positions before a major move.
The key question now:
> Will this zone become the launchpad for another major rally, or the final floor before a deep collapse?
---
Market Structure & Price Pattern
Primary Range: ONDO has been ranging broadly between 0.62 – 2.10 since mid-2024, with a steady bearish compression forming through lower highs.
Demand Zone (Yellow Block): 0.735 – 0.62 remains a strong historical accumulation area. Rejection or bullish confirmation here could trigger a macro reversal.
Liquidity Sweep: The long downside wick suggests liquidity has been collected — often preceding a sharp move in the opposite direction.
---
Bullish Scenario — Reversal from the Golden Zone
Confirmation Conditions:
A 4-day candle close above 0.735, or a strong bullish rejection candle within the zone.
Increasing volume with follow-through momentum.
Upside Targets:
TP1: 0.8665 — local resistance
TP2: 1.10 — mid-range resistance
TP3: 1.44 – 1.96 — macro distribution zone
If price forms a higher low above 0.735 after rejection, ONDO could enter a re-accumulation phase targeting mid-range resistance.
Stop Loss: Below 0.60 to avoid being trapped by liquidity spikes.
---
Bearish Scenario — Breakdown from Structural Base
Confirmation Conditions:
4D candle closes below 0.62 with strong selling pressure.
Failed retest of 0.62–0.70 (support turns resistance).
Downside Targets:
TP1: 0.50 — minor liquidity zone
TP2: 0.40 — structural support
TP3: 0.25 — full capitulation extension
A confirmed break below 0.62 would mean ONDO’s macro structure has fully collapsed, indicating the start of a prolonged bearish phase.
---
Strategic Summary
The 0.735 – 0.62 zone is ONDO’s line of survival.
As long as price holds or rejects strongly from this area, a macro reversal remains possible.
But a confirmed breakdown below it could lead to a full structural reset toward 0.40 or even 0.25.
> Simply put: this is ONDO’s “make or break” moment —
Either the base for a strong comeback, or the beginning of a deeper decline.
---
Trading Approach
Wait for 4D confirmation before entering any position.
Conservative entries near 0.63–0.68 with SL below 0.60.
Increase position size only after confirmed structure reversal.
Manage risk strictly — volatility in this zone is high and unpredictable.
#ONDO #ONDOUSDT #CryptoAnalysis #PriceAction #SwingTrade #DemandZone #SupportAndResistance #CryptoChart #LiquiditySweep #CryptoTechnical #4DChart #SmartMoneyConcept #CryptoMarket #ReversalSetup

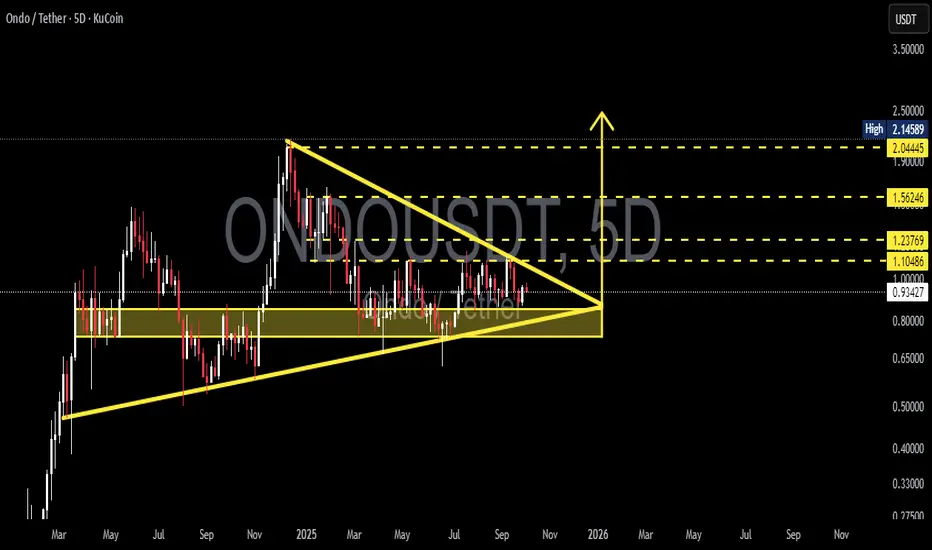
ONDO/USDT — Symmetrical Triangle: Breakout or Breakdown Ahead?🔎 Overview
ONDO is currently trading inside a large consolidation phase after rallying to a peak around $2.14 earlier this year. Price action has now formed a symmetrical triangle pattern, compressing between lower highs and higher lows, right at the critical support zone of $0.80–1.00.
This setup signals that the market is building up pressure — and the next breakout or breakdown will likely dictate the mid-term direction.
---
🏛️ Key Technical Levels
Current Price: ~$0.93
Major Support Zone: $0.80 – $1.00
Upside Targets (if breakout occurs):
$1.10 → breakout trigger level
$1.24 → first resistance target
$1.56 → secondary target
$2.04 – $2.15 → major target, previous swing high
Downside Levels (if breakdown occurs):
$0.65 → minor support
$0.50 → psychological support
$0.33 → next historical support
---
📐 Pattern Explanation
Symmetrical Triangle → formed by lower highs and higher lows converging into an apex.
Indicates price compression and a potential big move ahead.
Directional bias: Often acts as a continuation pattern (favoring bullish trend continuation), but confirmation is essential.
---
🚀 Bullish Scenario
1. Confirmation: A 5D close above the upper trendline and >$1.10 with strong volume.
2. Aggressive entry: Enter on breakout above $1.10.
3. Conservative entry: Wait for a successful retest around $1.00–$1.10 zone.
4. Upside Targets:
TP1: $1.24
TP2: $1.56
TP3: $2.04 – $2.15
5. Stop-loss: Below the breakout zone → around $0.90–0.95, or safer below $0.80.
---
🐻 Bearish Scenario
1. Confirmation: A strong 5D close below $0.80 support zone with volume.
2. Entry: Short/exit longs after breakdown or on failed retest back to $0.80.
3. Downside Targets:
TP1: $0.65
TP2: $0.50
TP3: $0.33
4. Stop-loss (for shorts): Above $0.85–0.90.
---
⚠️ Key Points to Watch
Volume spike is crucial for validating breakout/breakdown.
Retest confirmation: Breakouts are stronger if retests hold.
False breakouts are common in triangle patterns — use higher timeframe confirmation (5D or weekly).
Risk management: Position sizing and R:R ratio are critical; avoid overexposure.
---
📝 Conclusion
ONDO is at a critical decision point within a large symmetrical triangle.
Bullish breakout above $1.10 could open the path toward $1.24 → $1.56 → $2.04–2.15.
Bearish breakdown below $0.80 may trigger downside toward $0.65, $0.50, and $0.33.
With price nearing the triangle apex, volatility expansion is almost guaranteed — traders should prepare for a major move in either direction.
---
#ONDO #ONDOUSDT #Crypto #Altcoin #TechnicalAnalysis #TrianglePattern #Breakout #BullishScenario #BearishScenario
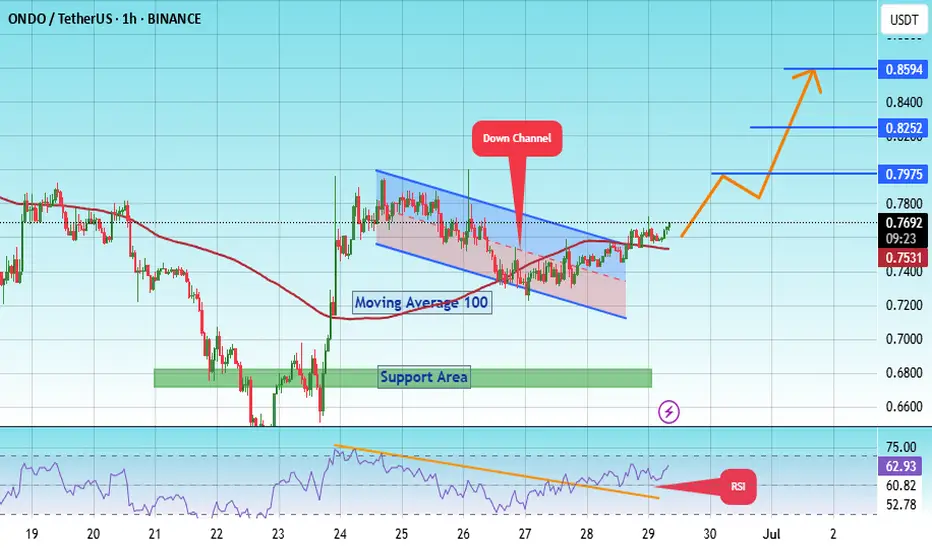
#ONDO/USDT#ONDO
The price is moving within a descending channel on the 1-hour frame, adhering well to it, and is heading for a strong breakout and retest.
We have a bounce from the lower boundary of the descending channel. This support is at 0.7220.
We have a downtrend on the RSI indicator that is about to be broken and retested, supporting the upside.
There is a major support area in green at 0.6757, which represents a strong basis for the upside.
Don't forget a simple thing: ease and capital.
When you reach the first target, save some money and then change your stop-loss order to an entry order.
For inquiries, please leave a comment.
We have a trend to hold above the 100 Moving Average.
Entry price: 0.7975
First target: 0.7975
Second target: 0.8252
Third target: 0.8600
Don't forget a simple thing: ease and capital.
When you reach the first target, save some money and then change your stop-loss order to an entry order.
For inquiries, please leave a comment.
Thank you.
#ONDO/USDT#ONDO
The price is moving within a descending channel on the 1-hour frame, adhering well to it, and is heading for a strong breakout and retest.
We are experiencing a rebound from the lower boundary of the descending channel, which is support at 0.9200.
We are experiencing a downtrend on the RSI indicator, which is about to break and retest, supporting the upward trend.
We are looking for stability above the 100 moving average.
Entry price: 0.9700
First target: 1.013
Second target: 1.048
Third target: 1.093

All I have to say about ONDO is 'own it!'ONDO has an incredibly bright future, and people are going to regret not owning it on a level rivaled only by Bitcoin.
Good luck, and always use a stop-loss!

$ONDO: Potential Reversal in SightLSE:ONDO : Potential Reversal in Sight
Signs suggest that LSE:ONDO may have reached the bottom of its consolidation phase, having fully retraced to its August 2024 lows. Momentum is shifting:
MACD is climbing toward the median — a breakout above could signal the start of an explosive uptrend.
RSI remains neutral, leaving room for a strong move in either direction.
Volume is near all-time lows, often a precursor to a breakout.
If the projected move plays out, the next resistance levels (based on Fibonacci ratios) are:
🔹 TP1: $0.94
🔹 TP2: $1.17
🔹 TP3: $1.35
📉 DYOR | Not financial advice.

#ONDO/USDT#ONDO
The price is moving in a descending channel on the 1-hour frame and is adhering to it well and is heading to break it strongly upwards and retest it
We have a rebound from the lower limit of the descending channel, this support is at a price of 0.7550
We have a downtrend on the RSI indicator that is about to be broken and retested, which supports the rise
We have a trend to stabilize above the moving average 100
Entry price 0.8180
First target 0.8890
Second target 0.9588
Third target 1.034

#ONDO/USDT #ONDO
The price is moving in a descending channel on the 1-hour frame and sticking to it well
We have a bounce from the lower limit of the descending channel, this support is at a price of 1.25
We have a downtrend on the RSI indicator that is about to be broken, which supports the rise
We have a trend to stabilize above the moving average 100
Entry price 1.42
First target 1.51
Second target 1.64
Third target 1.76

ONDO appears to have a bright future ahead!ONDO is a favorite cryptocurrency of many investors and traders alike. The entire crypto market has been dragged down since December after the massive gains from the "Trump election pump" caused many cryptos to go ballistic. However, the future looks bright for ONDO, as the current weekly chart suggests it's setting up for another leg up.
Good luck, and always use a stop-loss!

ONDO has nice potential if it pulls back to the proper buy zone.ONDO has been on a tear lately with the rest of the crypto market, and some really good opportunities could present themselves 'if' it pulls back into the proper discount buy zone. The fair value gap, or just above it, could present the perfect opportunity for a lower risk entry. Higher risk entries could present themselves within the corresponding fib zones. But I wouldn't chase price. Instead, have patience and let the price come to you.
Good luck, and always use a stop-loss!

ONDOUSDT Hits New ATH – 200% Rally Ahead?ONDOUSDT Technical analysis update
BYBIT:ONDOUSDT has reached a new all-time high (ATH) after 185 days of consolidation. The price has surged over 180% from its previous bottom, demonstrating strong bullish momentum. With the breakout supported by increased trading volume, ONDO shows potential for another 100-200% move in the coming days.

#ONDO/USDT#ONDO
The price is moving within a descending channel pattern on the 1-hour frame and is expected to rise after it has been largely committed to it
We have a downtrend on the RSI indicator that is expected to break upwards and we have a tendency to stabilize above it
We have a major support level in green at a price of 0.9200
We have a tendency to stabilize above the moving average 100
Entry price 0.9300
First target 0.9613
Second target 0.9925
Third target 1.03

#ONDO/USDT Trade Setup! Entry, SL and Target!#ONDO is breaking out on the daily chart! A retest is likely, targeting the yellow box.
Best entry: $0.75 to $0.85
Aggressive entry: $0.85 to $0.96
Target: 50% to 100%
Stop Loss: $0.6811 (Since the SL is significantly lower than the current market price, keep your position small and consider adding more on dips if you like the setup.)
The strategy is to enter slowly and always keep your leverage low.
This applies to every setup I share.
DYOR, NFA
Please hit the like button if you want me to post more.
Thank you
#PEACE

ONDO Main targetONDO is showing a good pattern here, and i expect a pump as soon as it will be able to flip the resistance area at $1.05 into support. My main target for the next weeks is $1.6, where the price could perform a pullback into the previously mentioned area

ONDO BULLISH PENNANT FORMATIONONDO is currently trying to break the pennant trendline, a trendline breakout will push the price higher. Entry could be taken on breakout or retest.
