ONDO/USDT — At Golden Zone: Major Rebound or Complete Breakdown?ONDO is now sitting at its most critical structural level of 2025 — the golden demand zone between 0.735 and 0.62 USDT.
This area has historically acted as the foundation for every major bullish rally. Each time price tapped this zone, strong accumulation followed.
But this time, things look different — the chart reveals a persistent sequence of lower highs, signaling weakening momentum, while the latest deep wick indicates a liquidity grab — a classic sign that large players might be accumulating or offloading positions before a major move.
The key question now:
> Will this zone become the launchpad for another major rally, or the final floor before a deep collapse?
---
Market Structure & Price Pattern
Primary Range: ONDO has been ranging broadly between 0.62 – 2.10 since mid-2024, with a steady bearish compression forming through lower highs.
Demand Zone (Yellow Block): 0.735 – 0.62 remains a strong historical accumulation area. Rejection or bullish confirmation here could trigger a macro reversal.
Liquidity Sweep: The long downside wick suggests liquidity has been collected — often preceding a sharp move in the opposite direction.
---
Bullish Scenario — Reversal from the Golden Zone
Confirmation Conditions:
A 4-day candle close above 0.735, or a strong bullish rejection candle within the zone.
Increasing volume with follow-through momentum.
Upside Targets:
TP1: 0.8665 — local resistance
TP2: 1.10 — mid-range resistance
TP3: 1.44 – 1.96 — macro distribution zone
If price forms a higher low above 0.735 after rejection, ONDO could enter a re-accumulation phase targeting mid-range resistance.
Stop Loss: Below 0.60 to avoid being trapped by liquidity spikes.
---
Bearish Scenario — Breakdown from Structural Base
Confirmation Conditions:
4D candle closes below 0.62 with strong selling pressure.
Failed retest of 0.62–0.70 (support turns resistance).
Downside Targets:
TP1: 0.50 — minor liquidity zone
TP2: 0.40 — structural support
TP3: 0.25 — full capitulation extension
A confirmed break below 0.62 would mean ONDO’s macro structure has fully collapsed, indicating the start of a prolonged bearish phase.
---
Strategic Summary
The 0.735 – 0.62 zone is ONDO’s line of survival.
As long as price holds or rejects strongly from this area, a macro reversal remains possible.
But a confirmed breakdown below it could lead to a full structural reset toward 0.40 or even 0.25.
> Simply put: this is ONDO’s “make or break” moment —
Either the base for a strong comeback, or the beginning of a deeper decline.
---
Trading Approach
Wait for 4D confirmation before entering any position.
Conservative entries near 0.63–0.68 with SL below 0.60.
Increase position size only after confirmed structure reversal.
Manage risk strictly — volatility in this zone is high and unpredictable.
#ONDO #ONDOUSDT #CryptoAnalysis #PriceAction #SwingTrade #DemandZone #SupportAndResistance #CryptoChart #LiquiditySweep #CryptoTechnical #4DChart #SmartMoneyConcept #CryptoMarket #ReversalSetup
Ondousdtsignal

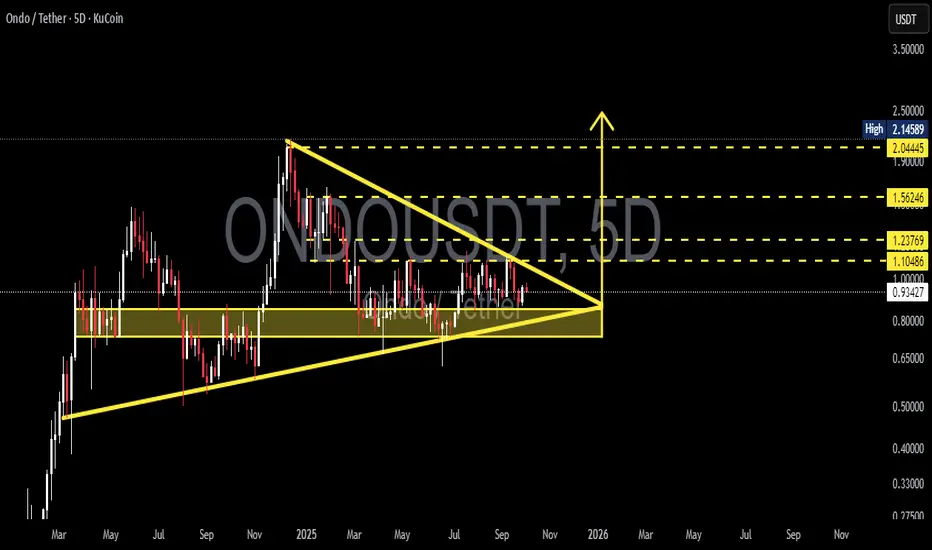
ONDO/USDT — Symmetrical Triangle: Breakout or Breakdown Ahead?🔎 Overview
ONDO is currently trading inside a large consolidation phase after rallying to a peak around $2.14 earlier this year. Price action has now formed a symmetrical triangle pattern, compressing between lower highs and higher lows, right at the critical support zone of $0.80–1.00.
This setup signals that the market is building up pressure — and the next breakout or breakdown will likely dictate the mid-term direction.
---
🏛️ Key Technical Levels
Current Price: ~$0.93
Major Support Zone: $0.80 – $1.00
Upside Targets (if breakout occurs):
$1.10 → breakout trigger level
$1.24 → first resistance target
$1.56 → secondary target
$2.04 – $2.15 → major target, previous swing high
Downside Levels (if breakdown occurs):
$0.65 → minor support
$0.50 → psychological support
$0.33 → next historical support
---
📐 Pattern Explanation
Symmetrical Triangle → formed by lower highs and higher lows converging into an apex.
Indicates price compression and a potential big move ahead.
Directional bias: Often acts as a continuation pattern (favoring bullish trend continuation), but confirmation is essential.
---
🚀 Bullish Scenario
1. Confirmation: A 5D close above the upper trendline and >$1.10 with strong volume.
2. Aggressive entry: Enter on breakout above $1.10.
3. Conservative entry: Wait for a successful retest around $1.00–$1.10 zone.
4. Upside Targets:
TP1: $1.24
TP2: $1.56
TP3: $2.04 – $2.15
5. Stop-loss: Below the breakout zone → around $0.90–0.95, or safer below $0.80.
---
🐻 Bearish Scenario
1. Confirmation: A strong 5D close below $0.80 support zone with volume.
2. Entry: Short/exit longs after breakdown or on failed retest back to $0.80.
3. Downside Targets:
TP1: $0.65
TP2: $0.50
TP3: $0.33
4. Stop-loss (for shorts): Above $0.85–0.90.
---
⚠️ Key Points to Watch
Volume spike is crucial for validating breakout/breakdown.
Retest confirmation: Breakouts are stronger if retests hold.
False breakouts are common in triangle patterns — use higher timeframe confirmation (5D or weekly).
Risk management: Position sizing and R:R ratio are critical; avoid overexposure.
---
📝 Conclusion
ONDO is at a critical decision point within a large symmetrical triangle.
Bullish breakout above $1.10 could open the path toward $1.24 → $1.56 → $2.04–2.15.
Bearish breakdown below $0.80 may trigger downside toward $0.65, $0.50, and $0.33.
With price nearing the triangle apex, volatility expansion is almost guaranteed — traders should prepare for a major move in either direction.
---
#ONDO #ONDOUSDT #Crypto #Altcoin #TechnicalAnalysis #TrianglePattern #Breakout #BullishScenario #BearishScenario
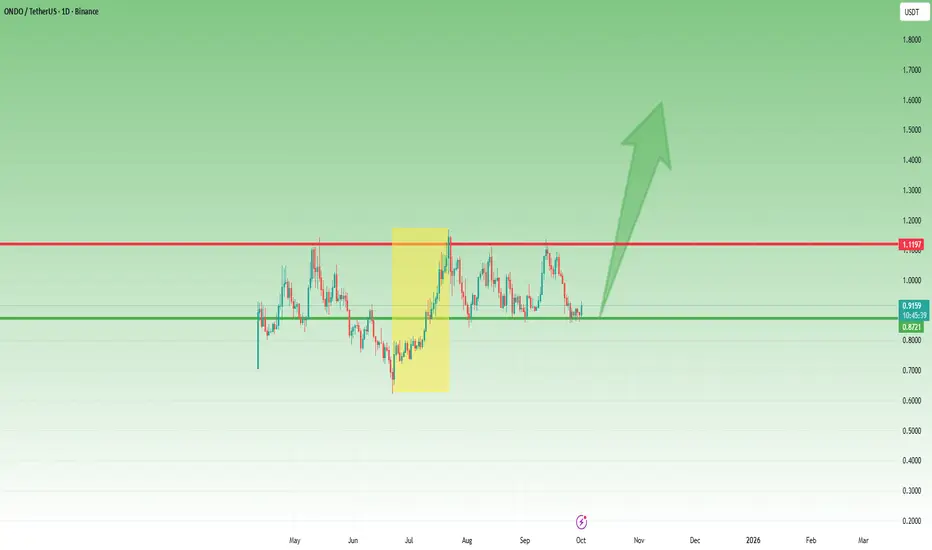
ONDO – Bullish Reversal from SupportWhat happened:
After the low back in June at 0.62, ONDO delivered a 100% rally. As expected after such a move, the price corrected and then settled into a range.
Key question:
Is this strong bounce from support the beginning of the next leg up?
Why I’m bullish:
• The recent reversal from support shows buyers are defending the structure.
• The first leg up measured a clean 100% move, and the current setup mirrors that strength.
• By extension, a second leg of similar length could take ONDO above 1.50.
Trading plan:
• I remain bullish as long as 0.80 holds.
• A continuation from here would confirm that the range is resolved to the upside, opening the path to 1.50+.
Bottom line:
ONDO combines strong fundamentals in tokenized real assets with a healthy technical picture. Support is clear and the potential reward above 1.50 is on the table. 🚀
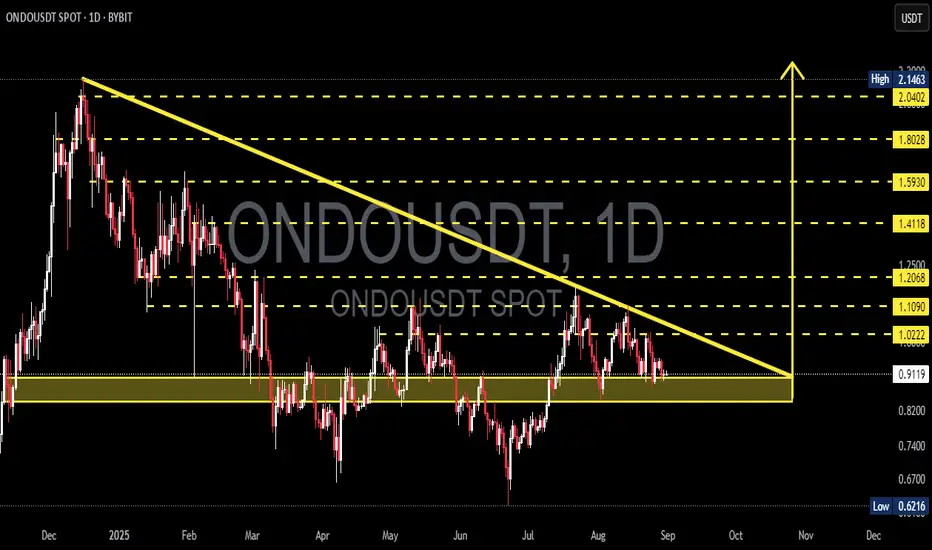
ONDO/USDT — Descending Triangle at a Critical Zone!🔎 Pattern & Structure Analysis
ONDO/USDT is currently forming a Descending Triangle pattern, where:
Lower Highs are consistently forming (yellow descending trendline).
Horizontal support in the 0.78–0.95 USDT demand zone has been tested multiple times since early 2025.
This structure reflects increasing selling pressure, while buyers keep defending the demand zone.
Historically, a descending triangle leans toward a bearish continuation, but a strong breakout can flip the bias into a bullish reversal.
---
🟢 Bullish Scenario
If price manages to break and close daily above the descending trendline + 1.022 USDT with strong volume, upside targets open:
Target 1: 1.109 USDT (+21.6%)
Target 2: 1.206 USDT (+32.3%)
Target 3: 1.411 USDT (+54.8%)
Major Target: 1.802 – 2.04 USDT (potential >100% rally if momentum extends).
📌 Key confirmation: breakout should be followed by a successful retest to confirm strength and avoid false breakouts.
---
🔴 Bearish Scenario
If price breaks down below 0.78 USDT, the descending triangle confirms as a bearish continuation. Downside targets are:
Target 1: 0.6216 USDT (previous swing low, −31.9%).
Target 2: 0.50 USDT (psychological level).
Extended Target: 0.42–0.45 if bearish momentum accelerates.
📌 Note: The more times support is tested without a significant bounce, the weaker it becomes.
---
📌 Technical Insights
Volume: essential for confirmation — weak volume may lead to fakeouts.
Retest: both bull and bear scenarios should be confirmed by a clean retest.
Momentum: RSI on daily remains neutral, giving room for either side to take control.
Market structure: until a breakout above 1.109 or breakdown below 0.78, price remains compressed inside the triangle.
---
🎯 Conclusion
ONDO/USDT is at a make-or-break level.
Bullish → Daily close above 1.022–1.109 could trigger upside toward 1.20–1.41.
Bearish → Daily close below 0.78 could drag price to 0.62 or lower.
⚠️ Descending triangles statistically favor the downside, but confirmation with daily close + volume is key. Always wait for validation before positioning.
---
ONDO is consolidating inside a Descending Triangle near the 0.78–0.95 demand zone. The price is at the tip of the structure, preparing for a major move.
Bullish → Daily close above 1.022–1.109 → upside targets 1.20–1.41.
Bearish → Breakdown below 0.78 → downside targets 0.62, then 0.50.
This is a decisive zone. Watch for confirmation with volume and retests before taking entries.
#ONDO #ONDOUSDT #Crypto #TechnicalAnalysis #CryptoTrading #ChartPattern #DescendingTriangle
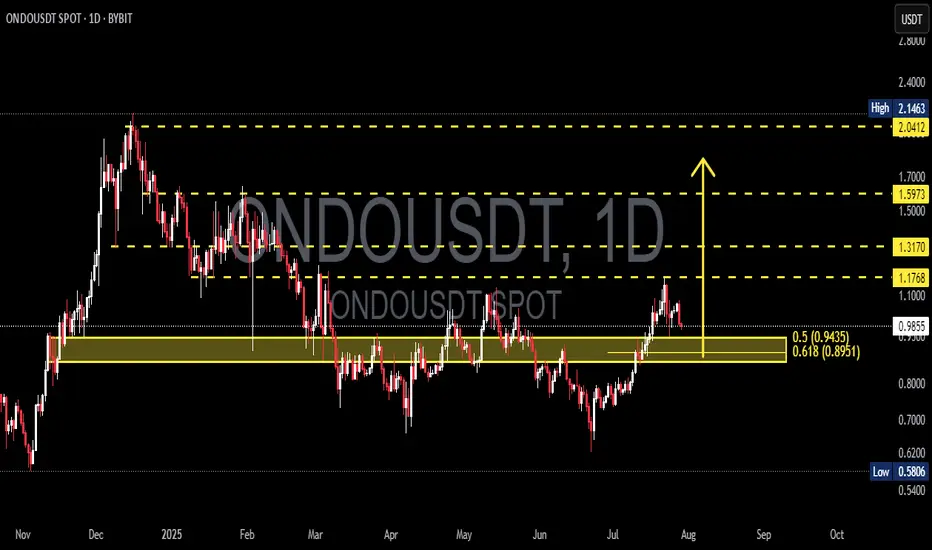
ONDOUSDT at a Critical Fibonacci Zone! Will Move Toward $2+?ONDOUSDT is currently trading at a critical technical zone — the Fibonacci Retracement Golden Pocket (0.5–0.618) — following a significant upward rally. Historically, this zone often acts as a high-probability reversal area, or at the very least, a zone for major consolidation before the next big move.
---
🧠 Market Structure & Price Action
After reaching a local high near $1.17, price retraced and is now approaching the key support zone between $0.9435 (Fib 0.5) and $0.8951 (Fib 0.618).
This zone also coincides with a previous strong resistance, which could now act as new support (role reversal).
Current price action shows selling pressure, but there is no confirmed breakdown from the Golden Pocket yet.
---
🧩 Pattern Recognition & Key Levels
Potential Reversal Pattern: Look for a bullish falling wedge or descending channel on lower timeframes as a signal for reversal.
Demand Zone (Yellow Box): The zone between $0.8951–$0.9435 is reinforced by horizontal price structure support.
Layered Resistance Levels:
$1.1768 → Recent swing high
$1.3170 → Mid-range resistance
$1.5973 → Psychological and retracement target
$2.0412 → Range top / full recovery zone
Minor Support: If the Golden Pocket fails, potential downside targets include $0.70 and the major low at $0.5806.
---
📈 Bullish Scenario
✅ Strong bounce from the Golden Pocket
✅ Bullish candlestick confirmation (e.g., bullish engulfing or pin bar)
✅ Rising volume showing buyer presence
✅ Break above $1.1768 would signal continuation toward:
🎯 Target 1: $1.3170
🎯 Target 2: $1.5973
🎯 Target 3: $2.0412 (full structural recovery)
---
📉 Bearish Scenario
❌ If price breaks below $0.8951 with a strong bearish candle and high volume:
The structure shifts bearish, increasing risk of a drop to $0.70 – $0.62
Worst-case scenario: retest of $0.5806, the major bottom
Bullish structure invalidated upon confirmed breakdown
---
🎯 Strategy & Takeaway
ONDOUSDT is currently in a "make or break" zone. The Golden Pocket between $0.895–$0.943 could either:
Act as a springboard for the next bullish leg,
Or fail, triggering a deeper correction.
Traders should wait for confirmation via:
Candlestick patterns
Volume breakout/inflow
Break above or below the key structure
This area offers a high-reward, controlled-risk setup for swing traders, with invalidation just below the Golden Pocket.
---
📌 Summary of Key Levels
Level Description
$0.9435 Fibonacci 0.5 (support)
$0.8951 Fibonacci 0.618 (Golden Pocket)
$1.1768 Minor resistance
$1.3170 Mid-level resistance
$1.5973 Bullish target
$2.0412 Major resistance / recovery top
$0.5806 Extreme support (macro low)
#ONDOUSDT #CryptoTechnicalAnalysis #GoldenPocket #FibonacciLevels #CryptoTrading #SupportResistance #BullishSetup #BearishScenario #SwingTrade #AltcoinAnalysis
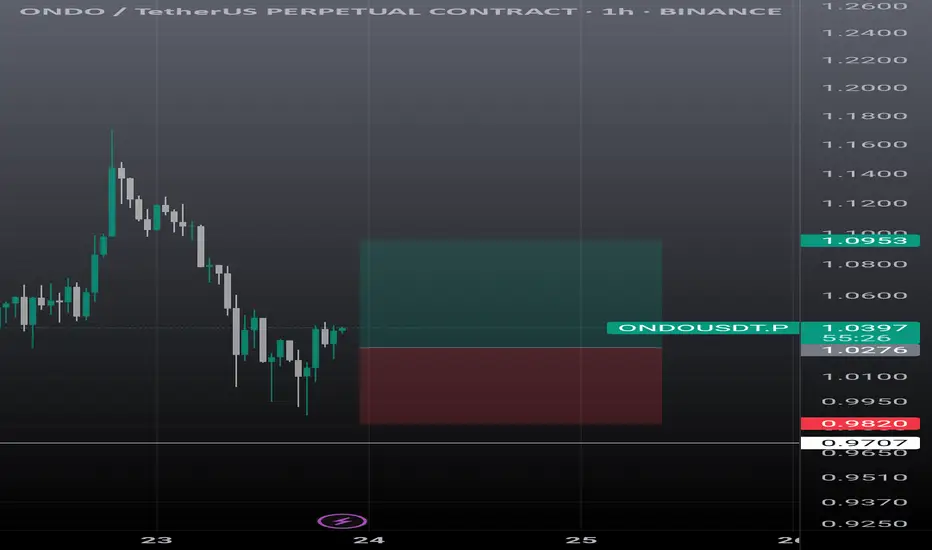
Ondo usdt scalp trade.First entry at current market price, and second one is mentioned, sl just below today low. Tp is mentioned.
ONDO/USDT Breakout Watch – Reversal Incoming
🔍 Overview:
The ONDO/USDT pair is currently at a critical inflection point. After months of being suppressed in a downtrend, price action is now testing a major descending trendline that has capped the market since the peak in December 2024. A breakout here could be the beginning of an explosive bullish phase — but failure might confirm further downside.
📉 Pattern: Descending Trendline Compression
ONDO has been forming consistent lower highs, creating a clear descending trendline structure.
Price is now pressing against this resistance, attempting a breakout with a strong 2D candle.
A confirmed breakout will occur once ONDO closes above $0.916 on the 2D chart, which also acts as a horizontal resistance.
✅ Bullish Scenario – The Start of a Mid-Term Reversal?
If the breakout is confirmed, we could see strong upward momentum, as there’s relatively little resistance in the upper zones.
🎯 Potential Targets:
1. $1.11 – First psychological and technical resistance.
2. $1.327 – Previous consolidation zone from Feb–Mar 2025.
3. $1.577 – Major supply zone before the heavy correction started.
4. $2.045 - $2.145 – All-time high area, the ultimate mid-to-long-term target.
📈 Note: Although not shown in this chart, RSI is likely leaving oversold territory, supporting the bullish momentum shift.
❌ Bearish Scenario – Classic Bull Trap Ahead?
If price fails to break and close above the trendline and $0.916, this could turn into a fakeout or bull trap.
📉 Possible downside levels:
$0.8399 – Minor support currently holding.
$0.70 – Strong horizontal demand zone.
$0.53 – Long-term support base, potential double bottom zone.
If momentum fades here, ONDO could revisit these lower areas before finding a true bottom.
🧠 Sentiment & Trading Strategy:
Breakout confirmation: Wait for a solid 2D candle close above the descending trendline and $0.916. Look for volume spike.
Conservative strategy: Enter on break + retest of the trendline, with SL below $0.83 and multi-level TPs.
Aggressive strategy: Enter on the initial breakout with dynamic trailing stops and resistance-based targets.
🏁 Conclusion:
ONDO/USDT is at a make-or-break moment. A confirmed breakout from this long-term descending structure may trigger a strong reversal with over 100% potential upside. However, if the market rejects this breakout attempt, it could extend its bearish trajectory.
Patience, confirmation, and disciplined risk management are key here.
📌 Key Levels to Watch:
Support: $0.8399 – $0.70 – $0.53
Resistance: $0.916 – $1.11 – $1.327 – $1.577 – $2.045 – $2.145
#ONDO #ONDOUSDT #CryptoBreakout #BullishSetup #AltcoinAnalysis #CryptoReversal #TradingViewSignals #TechnicalBreakout #DescendingTrendline #PriceAction

Ondo Scalp trade take with sl , this is a 5m scalp trade, So take it at your own risk with small amount

ONDO/USDT 2D – Falling Wedge Breakout in Play?ONDO/USDT is currently forming a highly compelling structure on the 2-day timeframe. Price action suggests a possible breakout from a falling wedge pattern, which is typically a bullish reversal signal.
🔹 Strong Support Zone:
The price continues to respect a significant accumulation zone between 0.65 – 0.73 USDT, which has held as a major support area since September 2023. Multiple successful retests reinforce its strength.
🔹 Descending Trendline Breakout:
The descending resistance line (yellow trendline), connecting lower highs since December 2023, is being tested and appears to be breaking. A confirmed breakout could trigger a strong bullish reversal.
🔹 Potential Upside Targets (Based on Structure and Fibonacci Projections):
TP1: 0.81211 (breakout confirmation level)
TP2: 1.13111 (key horizontal resistance)
TP3: 1.56596 (technical extension zone)
TP4: 2.04123 – 2.14522 (major historical resistance and previous swing high)
🔹 Trade Idea:
Conservative Entry: Buy the retest near 0.73–0.75 USDT after breakout confirmation
Stop Loss: Below the key support zone, around 0.65 USDT
Risk to Reward: Very favorable, with upside potential exceeding +160%
🔹 Confirmation Tips:
Look for a clean breakout with increased volume and a candle body closing above the trendline. A breakout + retest scenario provides higher probability for trend continuation.

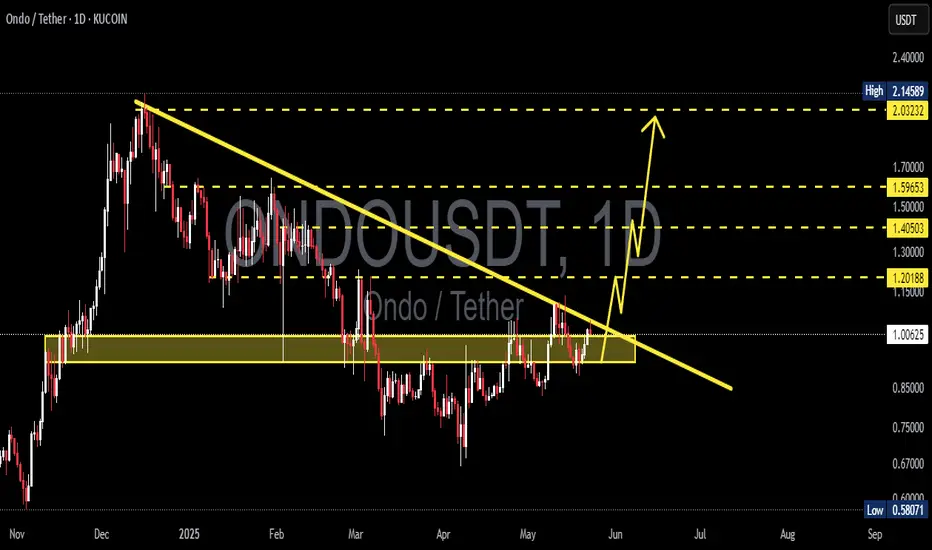
ONDOUSDT 1D AnalysisONDO ~ 1D Analysis
#ONDO Buy back on a retest of this support block with a short term target of at least 15%+ from here. Long term target $2.1

ONDOUSDT 1D AnalysisONDO ~ 1D Analysis
#ONDO Buy gradually at this support block with a short term target of at least 15%++ from here.
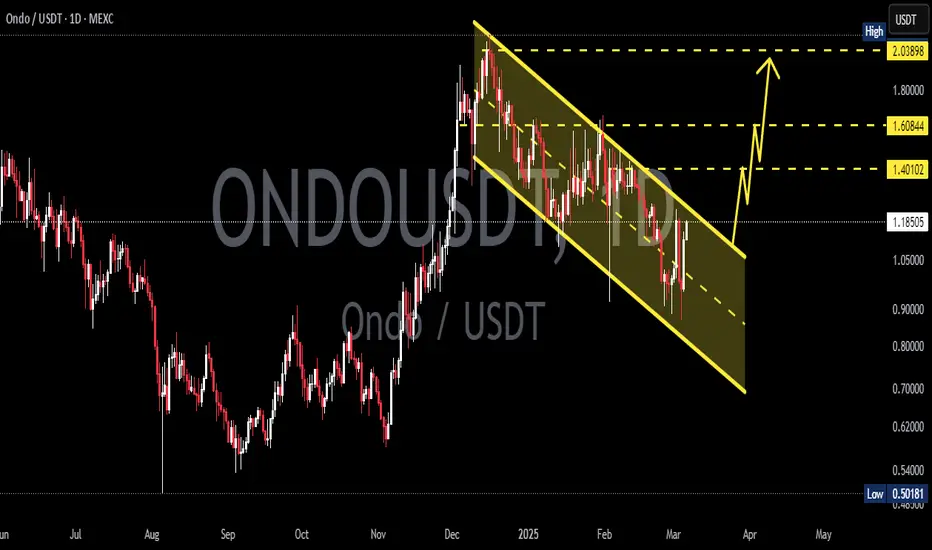
ONDOUSDT 1DONDO ~ 1D Analysis
#ONDO Buy gradually from here if you still have a Conviction on this coin with a short -term target of at least 10%+ from here.

ONDOUSDT 1DONDO ~ 1D Analysis
#ONDO Buy after successfully penetrating the resistant line of this pattern, with a short -term target of at least 10%+.

ONDOUSDT 1DONDO ~ 1D Analysis
#ONDO Buy gradually in this support block. with a short -term target of at least 15%+.

ONDOUSDT 1DONDO ~ 1D Analysis
#ONDON Buy after successfully penetrating this resistant line with a short -term target of at least 15%+.
ONDOUSDT 1DONDO ~ 1D Analysis
#ONDO Bullish Pennant is formed on Time Frame 1D. The best way to wait until this pattern is successful broken and buy.
