#ONE/USDT – The Final Shakeout Before Reversal?#ONE
The price is moving within a descending channel on the hourly timeframe. It has reached the upper boundary and is heading towards breaking it. A retest of this boundary is expected.
The Relative Strength Index (RSI) is showing an upward trend, as it has approached the upper boundary. A bearish reversal is expected.
There is a key support zone in green at 0.00250. The price has bounced from this zone several times and is expected to bounce again.
A consolidation trend is observed above the 100-period moving average, which we are approaching. This trend supports a decline towards this level.
Entry Price: 0.00263
Target 1: 0.00271
Target 2: 0.00282
Target 3: 0.00294
Stop Loss: Above the green support zone.
Remember this simple thing: Money management.
For any questions, please leave a comment.
Thank you.
ONE

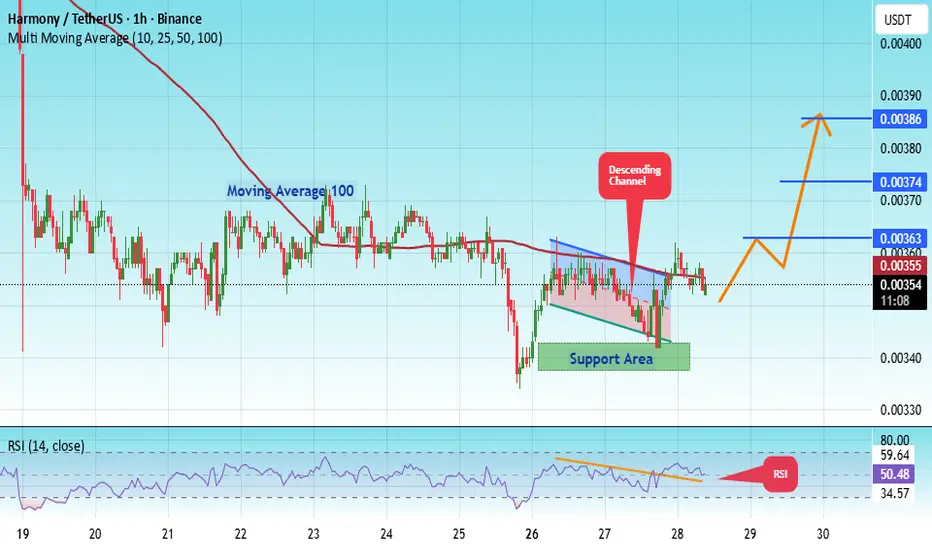
#ONE/USDT – The Final Shakeout Before Reversal?#ONE
The price is moving within a descending channel on the hourly timeframe. It has reached the lower boundary and is heading towards a breakout, with a retest of the upper boundary expected.
The Relative Strength Index (RSI) is showing a downward trend, approaching the lower boundary, and an upward bounce is anticipated.
There is a key support zone in green at 0.00340. The price has bounced from this level several times and is expected to bounce again.
The RSI is showing a trend towards consolidation above the 100-period moving average, which we are approaching, supporting the upward move.
Entry Price: 0.00352
Target 1: 0.00363
Target 2: 0.00374
Target 3: 0.00386
Stop Loss: Below the green support zone.
Remember this simple thing: Money management.
For any questions, please leave a comment.
Thank you.
ONE/USDT at Edge: Bounce or Breakdown from Major Demand Zone?The ONE/USDT on the 1W (Weekly) timeframe shows a clear long-term bearish trend since the all-time high in 2021. Price has consistently formed lower highs and lower lows, confirming strong seller dominance over the past few years.
Currently, price is approaching a major historical demand zone, highlighted by the yellow block between 0.0024 – 0.0017, an area that previously triggered a strong bullish impulse.
---
Pattern & Price Structure
1. Long-Term Downtrend
Market structure remains bearish on a macro scale.
Every upward move has been a relief rally, failing to create a higher high.
2. Descending Structure Breakdown
Price has lost multiple minor supports, indicating progressive weakness.
Strong rejections from the mid-range supply area (around 0.01 – 0.02) accelerated the decline.
3. Major Historical Demand Zone
The 0.0024 – 0.0017 zone represents:
Previous accumulation area
Weekly historical support
Origin of a strong bullish move in the past
Price is now retesting this critical zone.
---
Key Levels
Major Resistance:
0.0050 – 0.0060
0.0090 – 0.0105
Major Support / Demand Zone:
0.0024 – 0.0017
Historical Extreme Low:
0.00118
---
Bullish Scenario
The bullish scenario is only valid if strong buying reactions appear inside the yellow zone:
Formation of:
Long lower wicks on weekly candles
Or a sideways accumulation base
No strong weekly close below 0.0017
Potential upside targets:
Short-term: 0.0050
Mid-term: 0.0090
Maximum relief rally: 0.015 – 0.02
➡️ This scenario represents a speculative bounce, not a confirmed trend reversal.
---
Bearish Scenario
The bearish scenario is confirmed if:
A strong weekly close below 0.0017
Failure of the historical demand zone
Increased selling pressure and breakdown momentum
Consequences:
Price may enter new low price discovery
No clear historical support below this level
High risk of continued downside
➡️ A breakdown here would signal market capitulation.
---
Conclusion
ONE/USDT is currently at a critical make-or-break technical level.
The 0.0024 – 0.0017 zone represents the last major weekly demand zone.
Aggressive buys are suitable only for high-risk traders
Conservative traders should wait for weekly confirmation
As long as price remains below key resistance levels, the primary trend stays bearish
---
#ONEUSDT #HarmonyONE #CryptoAnalysis #WeeklyChart #DemandZone #SupportResistance #BearishTrend #PotentialBounce #AltcoinAnalysis

FireHoseReel | ONE Compression Below 0.0037 Signals Expansion🔥 Welcome To FireHoseReel !
Let’s dive into Harmony (ONE) analysis.
⛳️ ONE Fundamental Overview
Harmony (ONE) is a layer-1 blockchain focused on fast, low-fee transactions and sharding scalability. ONE is currently ranked around #330 on CoinMarketCap and is used for fees, staking, and governance.
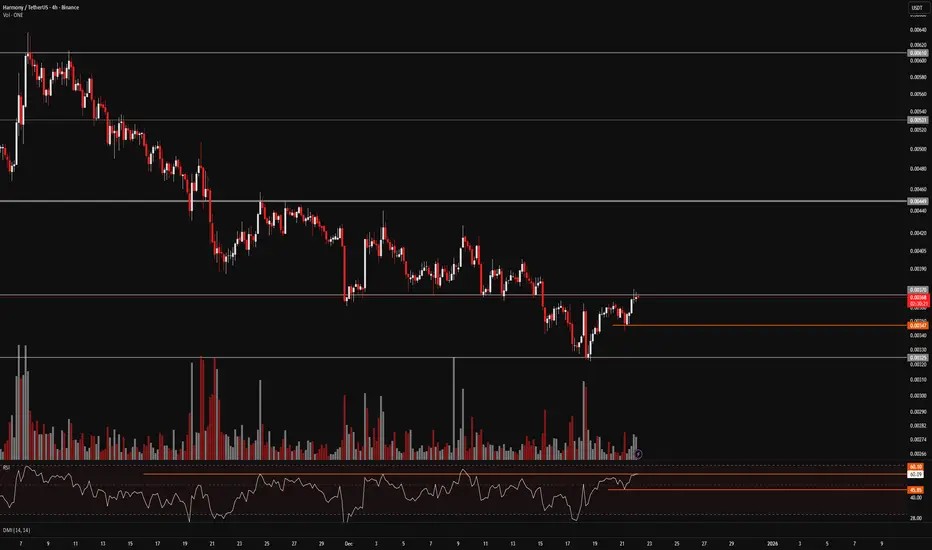
👀 ONE 4H Overview
ONE has been trading inside a 4H range and is now testing the top of the range and its key resistance at $0.0037. A breakout above this level could trigger a bullish leg, potentially retracing part of the previous downside move.
📊 Volume Analysis
During the recent declines, ONE showed strong selling pressure. Now, as price trades just below resistance, the move toward this level has been supported by rising buy volume, which increases the probability of a breakout.
✍️ ONE Trading Scenarios
🟢 Long Scenario:
A breakout above $0.0037, with sustained buying volume and active buyer participation, along with RSI breaking above 60.1, could provide a solid long setup.
🔴 Short Scenario:
A breakdown below $0.00347, combined with increasing sell volume, a strong rejection from the current resistance, and RSI dropping below 45.85, could activate a short trigger.
🧠 Protect your capital first. No setup is worth blowing your account. If risk isn’t controlled, profit means nothing. Trade with rules, not emotions.
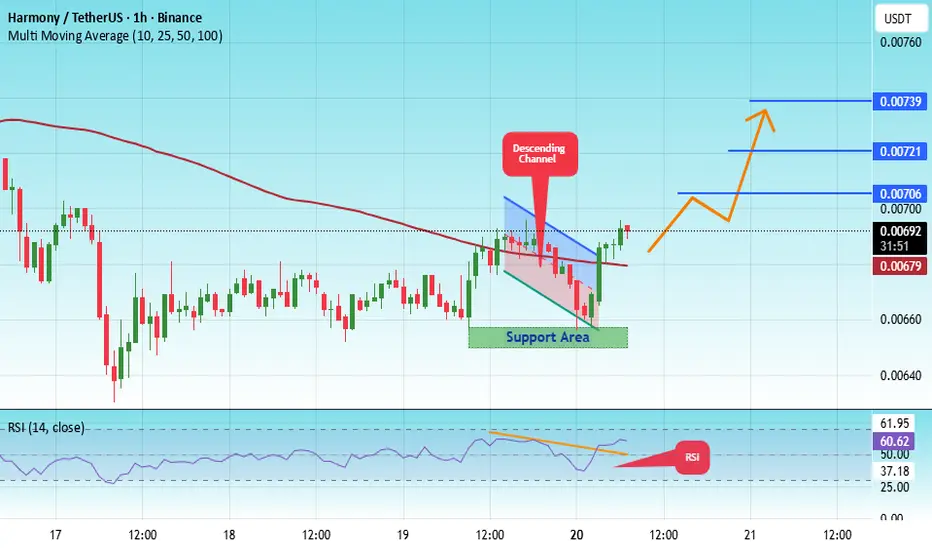
#ONE/USDT – The Final Shakeout Before Reversal?#ONE
The price is moving within a descending channel on the 1-hour frame, adhering well to it, and is heading for a strong breakout and retest.
We have a bearish trend on the RSI indicator that is about to be broken and retested, which supports the upward breakout.
There is a major support area in green at 0.00652, representing a strong support point.
We are heading for consolidation above the 100 moving average.
Entry price: 0.00691
First target: 0.00706
Second target: 0.00721
Third target: 0.00739
Don't forget a simple matter: capital management.
When you reach the first target, save some money and then change your stop-loss order to an entry order.
For inquiries, please leave a comment.
Thank you.
ONE/USDT – The Final Shakeout Before Reversal?The weekly chart of ONE/USDT tells the story of a full crypto market cycle:
from the euphoric highs of 2021 to a prolonged downtrend that has now brought price back into the historical accumulation zone between 0.0055 – 0.0042 — the same area that preceded ONE’s previous bull run.
The breakdown below 0.00915 triggered a wave of panic selling and swept deep liquidity, forming a massive lower wick that pierced the yellow demand zone.
Such movements often mark the capitulation phase, where retail traders capitulate and smart money begins accumulating silently beneath the surface.
---
Structure & Technical Overview
Macro trend: Strong multi-year downtrend with consistent lower highs and lower lows since 2021.
Key demand zone: The yellow block (0.0055 – 0.0042) acts as the last major demand zone and potential base for a new market cycle.
Candle behavior: The large wick suggests a liquidity grab — a common signal that downside exhaustion may be near if confirmed by a strong weekly close above the zone.
Major resistance levels: 0.0130 → 0.01625 → 0.0200 → 0.0240 → 0.0355 — these levels could serve as potential retest or breakout targets if a trend reversal occurs.
---
Bullish Scenario
Main condition: A weekly close back above 0.00915 would signal a key reclaim and potential structural reversal.
Confirmation signals: Rising buy volume and the formation of a higher low above the yellow zone.
Upside targets:
1. 0.0130 – first technical rebound level
2. 0.01625 – 0.0200 – mid-range supply zone
3. 0.0355 – macro target if reversal sustains
Bullish narrative:
“Smart money accumulates when fear dominates. The quiet phase of accumulation might already be underway.”
---
Bearish Scenario
Bearish confirmation: A weekly close below 0.0042 would confirm a full structural breakdown.
Next target: A continuation lower toward the psychological area of 0.0023, entering a deep undervaluation phase.
Bearish narrative:
“If the yellow zone fails, ONE could enter the final leg of its downcycle — a phase only the most patient investors endure.”
---
Strategy & Opportunity
Short-term traders: Wait for a confirmed reclaim above 0.00915 before considering long entries.
Long-term investors: The 0.0055 – 0.0042 range remains a potential accumulation area — but only with disciplined risk management below support.
Core principle:
“True reversals are not born from optimism, but from despair.”
---
Conclusion
ONE stands at a critical multi-year inflection point.
The 0.0055 – 0.0042 range represents the final battleground between capitulation and rebirth.
If the zone holds and price reclaims 0.00915, a new cycle could begin.
If it breaks lower, expect deeper undervaluation before the next accumulation phase forms.
The market is testing patience — separating believers from trend followers.
---
#ONEUSDT #HarmonyONE #CryptoAnalysis #AltcoinReversal #PriceAction #CryptoCapitulation #MarketCycle #TechnicalAnalysis #CryptoMarket #SupportResistance

ONE/USDT — The Last Golden Zone: Bounce or Breakdown?Market Snapshot
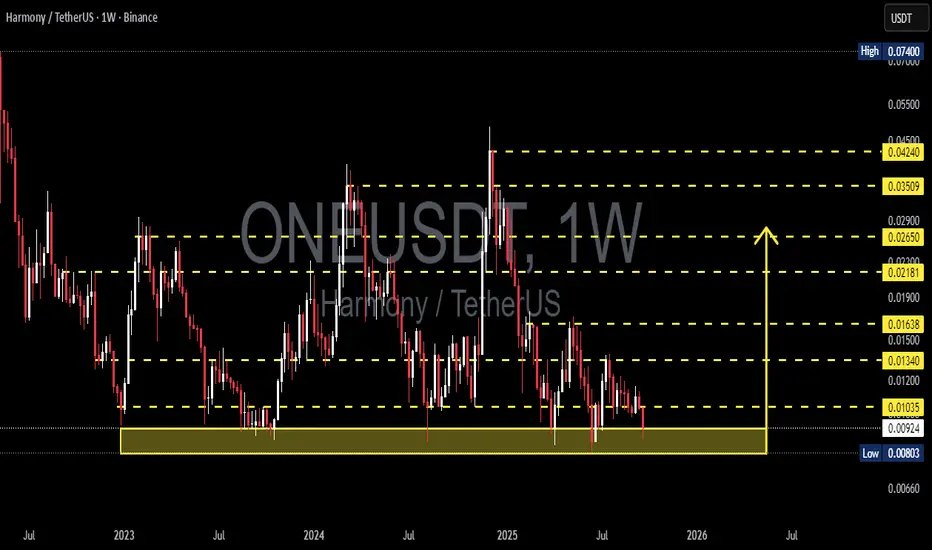
Harmony (ONE) is currently sitting at a make-or-break level. On the weekly chart, price has reached the critical demand zone at 0.0080 – 0.0103 USDT (yellow box). This area has been tested multiple times since 2023, making it both a strong historical support and a fragile level under constant pressure.
In the past, sharp rejections (long lower wicks) from this zone have sparked significant rebounds. The key question now: will this zone hold again, or will we witness a confirmed breakdown that opens the door to deeper bearish territory?
---
Price Structure & Pattern
Consistent lower highs since mid-2024 → medium-term bias remains bearish.
The 0.0080–0.0103 zone has been tested several times → proven demand, but repeated tests weaken its strength.
Frequent long downside wicks → liquidity sweeps before rebounds, a sign of manipulation or false breaks.
Overall structure: sideways within a horizontal range, but with bearish undertone.
---
Bullish Scenario (Rebound Potential)
If the support zone holds:
Trigger: Weekly close above 0.01035 or bullish reversal candle (hammer / engulfing) around support.
Upside targets:
0.01340 (first resistance, ~+45%)
0.01638 (major resistance, ~+78%)
0.02181 (mid-term target, ~+137%)
If momentum and volume strengthen, further targets extend toward 0.02650 – 0.03500.
Note: Bullish bias remains valid only while weekly closes hold above 0.0080. The longer the zone holds, the stronger the chance of a breakout rally.
---
Bearish Scenario (Breakdown Risk)
If the 0.0080 support fails:
Trigger: Weekly close below 0.0080 with strong selling volume.
Downside targets:
0.00660 as next key support (~−28%).
Below that, psychological levels around 0.0050 may come into play.
Note: A confirmed breakdown here would be a major bearish signal, likely triggering panic selling.
---
Strategic Takeaway
ONE is now trading inside the last golden demand zone that could decide its long-term direction.
Bullish case: Bounce from support could target 0.013 – 0.016 first.
Bearish case: Breakdown below 0.0080 opens a path to 0.0066.
Key confirmation: Watch for weekly candle close and volume reaction — without them, moves may still be false breaks.
---
Harmony (ONE) is at a crucial turning point. The 0.0080–0.0103 demand zone has been a battlefield since 2023.
If bulls hold the line, we could see a rebound toward 0.0134–0.0163. But if sellers win and the level breaks, downside continuation toward 0.0066 is likely.
This is the make-or-break moment that will shape ONE’s trend in the coming months.
---
#ONE #Harmony #ONEUSDT #CryptoAnalysis #Altcoin #TechnicalAnalysis #SupportResistance #PriceAction #CryptoMarket
ONE/USDT — Critical Zone: Major Accumulation or Breakdown Ahead?📌 Overview
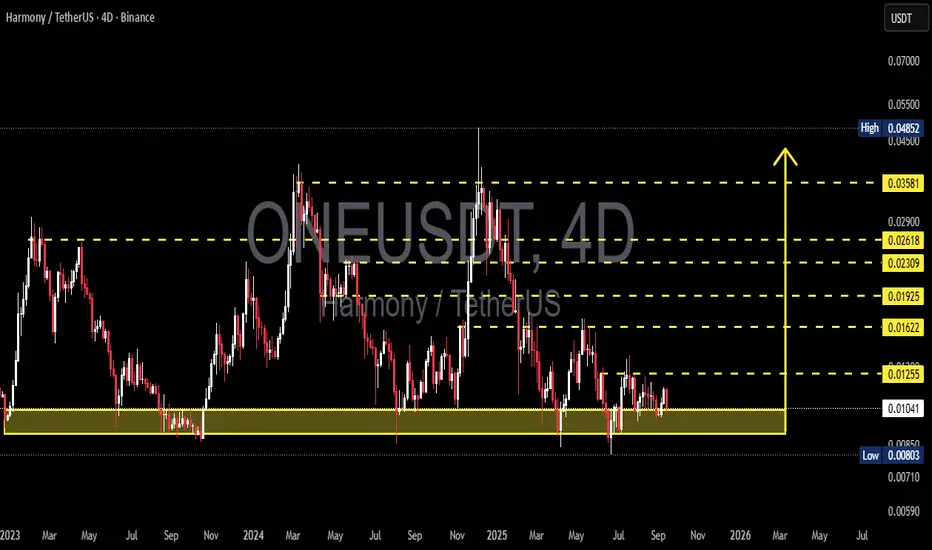
Harmony (ONE) is once again testing the multi-year support zone at 0.0078 – 0.0105 USDT, a level that has held the market multiple times since 2023. This zone acts as the last line of defense for the bulls, and the reaction here will determine whether we see a new accumulation phase or a deeper bearish continuation.
Since early 2024, price has been forming lower highs, reflecting ongoing selling pressure. However, the fact that this support continues to hold suggests possible accumulation behavior from long-term buyers.
---
🔎 Technical Structure
Historical Support Zone (0.0078 – 0.0105): retested several times, still holding.
Lower Highs: medium-term trend remains bearish.
Potential Double/Triple Bottom: if price defends this zone and breaks above 0.0125 – 0.0162, it could trigger a major reversal structure.
Key Resistances: 0.0125 → 0.0162 → 0.0192 → 0.0231 → 0.0261 → 0.0358.
---
🚀 Bullish Scenario
1. Support Bounce:
Strong rejection from 0.009 – 0.0105 could send price to 0.0125 (TP1).
Continuation targets: 0.0162 – 0.0192.
2. Confirmed Reversal:
A 4D/weekly close above 0.0162 would confirm a stronger trend reversal.
Upside targets expand toward 0.023 – 0.026 and potentially 0.035.
---
⚠️ Bearish Scenario
1. Breakdown of Support:
A 4D/weekly close below 0.0080 would invalidate the support and confirm bearish continuation.
Next downside target: 0.0059 – 0.0065.
2. Fakeout to the Upside:
If price rallies into 0.0125 – 0.0162 but fails to break through, sellers may regain control, sending price back into the support zone.
---
🎯 Trading Strategy (Example — not financial advice)
Conservative Long: accumulate at 0.009 – 0.0105, SL below 0.0076, TP1 0.0125, TP2 0.0162.
Aggressive Long (Breakout): enter on confirmed 4D/weekly close above 0.0162, targeting 0.019 – 0.026.
Short Setup: wait for a confirmed breakdown below 0.0080, target 0.0059 – 0.0065.
---
📊 Conclusion
ONE/USDT is currently at a make-or-break zone. This support area has historically attracted buyers and could mark the beginning of a larger accumulation phase. However, a breakdown would expose the market to a deeper decline.
Key takeaway: Watch the reaction around 0.0078 – 0.0105.
Strong rejection → accumulation and bullish momentum.
Breakdown → further downside pressure.
---
ONE/USDT — Accumulation or Breakdown?
Price is retesting the multi-year support zone (0.0078–0.0105).
📈 Bullish case: rebound toward 0.0125–0.0162, confirmation above 0.0162 → targets 0.019–0.026.
📉 Bearish case: breakdown below 0.0080 → downside targets 0.0059–0.0065.
This is a critical decision zone for ONE — accumulation or further decline.
#ONE #Harmony #ONEUSDT #CryptoAnalysis #SupportResistance #CryptoTrading #Altcoins #PriceAction
ONE ; GOOD CHANNELHello friends
You can see that the price is in a channel and depending on the market cycle, the price can reach a higher ceiling than the channel ceiling if the specified support is maintained.
*Trade safely with us*

ONE/USDT — Breakout or Breakdown Ahead?📊 Complete Analysis of ONE/USDT (1D)
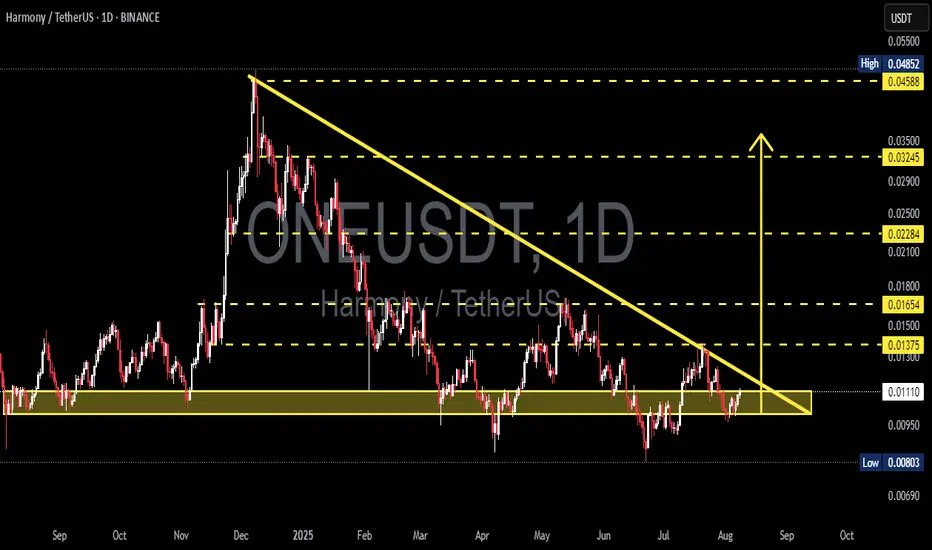
ONE is currently trading around $0.0111, sitting right at a critical junction between the major support zone ($0.0095–$0.0115) and a descending trendline that has been pressing price down since the December–January peak.
This setup forms a descending triangle pattern — typically a bearish continuation pattern, but under certain conditions it can flip into a strong bullish reversal if price breaks upward with volume.
---
🔍 Technical Details & Pattern
Primary Trend: Bearish since the late 2024 peak, with consistent lower highs.
Key Support Zone: $0.0095–$0.0115 (historical demand zone, tested multiple times since September 2024).
Dynamic Resistance: Descending trendline connecting lower highs.
Important Horizontal Levels:
$0.01375 → Nearest breakout confirmation resistance.
$0.01654, $0.02284, $0.03245, $0.04588 → Potential mid-term upside targets.
$0.00803 → Nearest low and first breakdown target.
Volume Factor: Breakout or breakdown must be confirmed by high trading volume.
---
🟢 Bullish Scenario (Breakout Upward)
If price breaks and closes daily above the descending trendline and clears $0.0138, the likelihood of a reversal increases.
Potential upside targets:
1. $0.0165 → Psychological resistance & minor supply zone.
2. $0.0228 → Major resistance and previous distribution area.
3. $0.0324–$0.0458 → If momentum extends further.
Strategy:
Enter after breakout + successful retest as new support.
Stop loss below $0.0095 to avoid fakeouts.
Watch for volume: without strong volume, risk of a bull trap is high.
---
🔴 Bearish Scenario (Breakdown Lower)
If price breaks and closes daily below $0.0095, the descending triangle pattern confirms as a bearish continuation.
Potential downside targets:
1. $0.00803 → Significant low and possible bounce area.
2. $0.0069 → Historical lowest level since 2023.
3. Below $0.0065 → Potential new lows if selling pressure escalates.
Strategy:
Enter after breakdown + failed retest above $0.0095.
Stop loss above $0.012–$0.013 to avoid short squeezes.
Adjust position size — volatility can spike sharply post-breakout.
---
📌 Key Points to Monitor
Convergence of Buyers & Sellers: The closer price moves toward the triangle’s apex, the higher the chance of a breakout in either direction.
Lengthy Consolidation: Post-breakout moves are often stronger after extended consolidation.
Risk Management: Avoid going all-in before confirmation; consider scaling entries.
Market Sentiment: Watch BTC & ETH — a bearish macro crypto environment increases the risk of a downside move.
---
📍 Conclusion
ONE/USDT is currently at a make-or-break zone.
📌 Bullish breakout → Potential rally toward $0.0165+
📌 Bearish breakdown → Likely drop toward $0.0080 or lower.
Traders should wait for daily close confirmation + strong volume to reduce false breakout risk.
The $0.0095–$0.0115 zone is the last major defense line for buyers in the medium term.
#ONEUSDT #HarmonyONE #CryptoAnalysis #TechnicalAnalysis #PriceAction #DescendingTriangle #Breakout #Breakdown #Altcoins #CryptoTrading
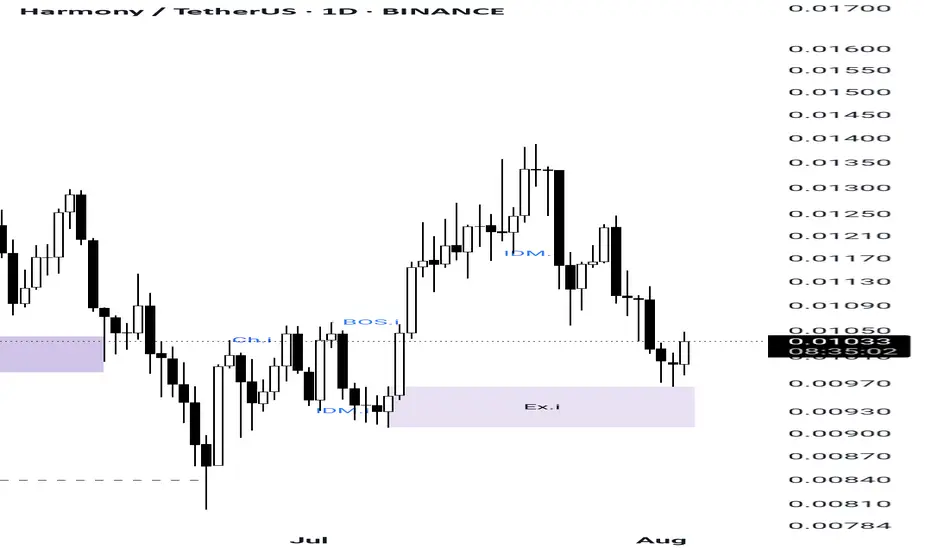
Harmony(ONE) is going to pump...As you can see in ONE Structure it made a minor structure and price touched its minor EX orderblock and for sure it made a SCOB confirmation
So now its ready to pump...
It's my own analysis and it's not investment advise , so DYOR
#ONE/USDT Reversal Building#ONE
The price is moving within a descending channel on the 1-hour frame, adhering well to it, and is poised to break it strongly upwards and retest it.
We have support from the lower boundary of the descending channel, at 0.01252.
We have a downtrend on the RSI indicator that is about to break and retest, supporting the upward move.
There is a key support area (in green) at 0.01200, which represents a strong basis for the upward move.
Don't forget one simple thing: ease and capital.
When you reach the first target, save some money and then change your stop-loss order to an entry order.
For inquiries, please leave a comment.
We have a trend of stability above the Moving Average 100.
Entry price: 0.01257
First target: 0.01312
Second target: 0.01368
Third target: 0.01444
Don't forget one simple thing: ease and capital.
When you reach the first target, save some money and then change your stop-loss order to an entry order.
For inquiries, please leave a comment.
Thank you.

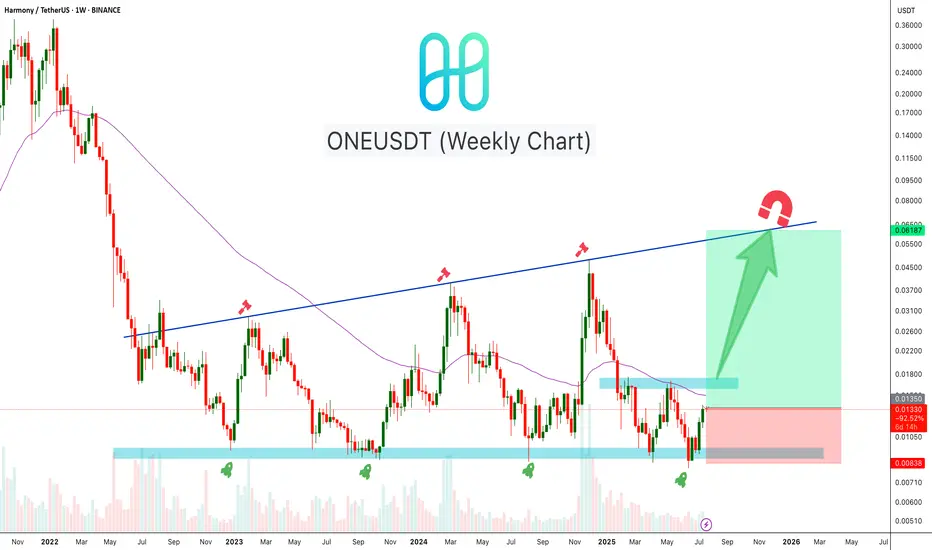
ONEUSDT Reversal BuildingONEUSDT is forming a strong base near the weekly demand zone around $0.009–$0.010, which has held multiple times over the past two years. The chart shows a clear accumulation pattern with higher lows forming. Price is now approaching the mid-range resistance near $0.017. If momentum continues, ONE may revisit the long-term trendline resistance near $0.065–$0.070.
Cheers
Hexa
ONEUSDT at Make-or-Break Zone Major Reversal or Breakdown Ahead?📌 Overview:
ONEUSDT is currently sitting at a major historical support zone around $0.0080–$0.0093 (highlighted in yellow).
📉 This level has been tested multiple times since 2022, and continues to hold – signaling strong accumulation and potential for a major reversal.
🧠 Key Pattern in Focus:
✅ Triple Bottom Pattern
The Triple Bottom is a classic bullish reversal pattern, reflecting the strength of buyers after multiple failed attempts to break the support.
🔁 It’s typically followed by a surge in momentum if a breakout confirms the reversal.
🚀 Bullish Scenario (Reversal in Play):
🔸 Condition: Price holds above $0.0080 and begins forming higher lows.
🔸 Confirmation: A breakout and retest above the $0.01258 resistance level.
🎯 Upside Targets: 1️⃣ $0.01258 → Minor Resistance
2️⃣ $0.01644 → Previous structure high
3️⃣ $0.02285 → Major supply zone
4️⃣ $0.03530 → Psychological and technical target
🔍 With strong bullish momentum and volume support, a mid-term move toward $0.04900+ is possible.
🛑 Bearish Scenario (Breakdown Risk):
🔻 Condition: Price breaks down below $0.0080 with strong volume.
🔻 Risk: No clear support below this level → price could enter uncharted territory or set new All-Time Lows.
📉 Indicates complete seller dominance and failed demand structure.
🔍 Conclusion:
ONEUSDT is at a critical inflection point – a strong rebound opportunity or a breakdown toward new lows.
📌 Price action over the coming days will be key in determining the mid-term trend.
📈 Aggressive traders may look for early entries, while conservative traders should wait for breakout confirmation.
📢 Extra Notes:
🔔 Confirmation is key for this setup.
💡 Combine with indicators like RSI, MACD, or Volume Profile for added confluence.
⚠️ Risk management is essential — stop loss below $0.0080 recommended for long entries.
#ONEUSDT #HarmonyONE #CryptoBreakout #TripleBottomPattern #BullishSetup #AltcoinAnalysis #CryptoReversal #SupportZone #BreakoutZone #TechnicalAnalysis

ONEUSDT 5D AnalysisONE ~ 5D Analysis
#ONE Buy back gradually from here if you still have confidence in this coin with a short term target of at least 20%+ from this support.

#ONE/USDT#ONE
The price is moving within a descending channel on the 1-hour frame and is expected to break and continue upward.
We have a trend to stabilize above the 100 moving average once again.
We have a downtrend on the RSI indicator that supports the upward move with a breakout.
We have a support area at the lower limit of the channel at 0.01147, acting as strong support from which the price can rebound.
Entry price: 0.01183
First target: 0.01210
Second target: 0.01236
Third target: 0.01268

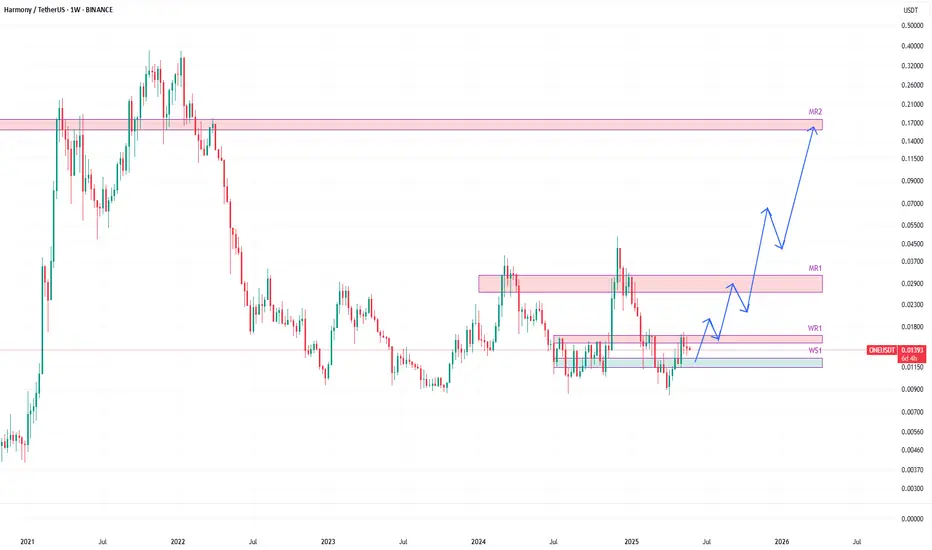
ONEUSDT likely to head towards 0.16 zoneONEUSDT is another one trading between weekly resistance WR1 and weekly support WS1.
The price has been retracing back to WS1 after hitting WR1. It is likely to hit WS1 before having a bounce.
WS1 is likely to provide a good bounce and the fuel for its upward journey in coming weeks and months.
The future of this one looks quite promising.
The price is likely to break WR1 on the next bounce from WS1 and likely to continue its journey towards monthly resistance MR1.
With some pullbacks here and there on various resistance milestones, the price is likely to aim for monthly resistance MR2.
#ONE/USDT#ONE
The price is moving within a descending channel on the 1-hour frame, adhering well to it, and is on its way to breaking it strongly upwards and retesting it.
We are seeing a bounce from the lower boundary of the descending channel, this support at 0.01298.
We have a downtrend on the RSI indicator that is about to break and retest, supporting the upward trend.
We are looking for stability above the 100 moving average.
Entry price: 0.01380
First target: 0.01474
Second target: 0.01582
Third target: 0.01695

ONEUSDT | Major Resistance Ahead at the Deep Red BoxI’ve shaded the red box extra dark because it really is a formidable barrier. Historically, price has stalled and reversed here, so if ONEUSDT manages to break through this zone, it could fuel a strong move higher. Until then, caution is essential.
Key Points to Watch
Red Box = Heavy Resistance
Sellers have been lining up in this area. Any rally into this zone could be met with aggressive selling pressure.
Confirmation Needed
I’ll wait for clear signs of a breakout on lower time frames—ideally a clean close above the red box followed by a successful retest. CDV shifts and rising volume must support that move before I even consider going long.
Flexible Bias
I will not insist on my short idea. If price breaks up through the red box without giving a proper downward break first, I’ll drop the bearish view. If instead that breakout holds with volume and retests as support, I’ll flip bias and look for longs.
This is one of those rare levels where preparation and patience pay off. Let the market prove its strength or weakness here, then act with confidence. Remember that well‑managed risk and strict confirmation criteria are your best allies in navigating tough resistance zones.
📌I keep my charts clean and simple because I believe clarity leads to better decisions.
📌My approach is built on years of experience and a solid track record. I don’t claim to know it all but I’m confident in my ability to spot high-probability setups.
📌If you would like to learn how to use the heatmap, cumulative volume delta and volume footprint techniques that I use below to determine very accurate demand regions, you can send me a private message. I help anyone who wants it completely free of charge.
🔑I have a long list of my proven technique below:
🎯 ZENUSDT.P: Patience & Profitability | %230 Reaction from the Sniper Entry
🐶 DOGEUSDT.P: Next Move
🎨 RENDERUSDT.P: Opportunity of the Month
💎 ETHUSDT.P: Where to Retrace
🟢 BNBUSDT.P: Potential Surge
📊 BTC Dominance: Reaction Zone
🌊 WAVESUSDT.P: Demand Zone Potential
🟣 UNIUSDT.P: Long-Term Trade
🔵 XRPUSDT.P: Entry Zones
🔗 LINKUSDT.P: Follow The River
📈 BTCUSDT.P: Two Key Demand Zones
🟩 POLUSDT: Bullish Momentum
🌟 PENDLEUSDT.P: Where Opportunity Meets Precision
🔥 BTCUSDT.P: Liquidation of Highly Leveraged Longs
🌊 SOLUSDT.P: SOL's Dip - Your Opportunity
🐸 1000PEPEUSDT.P: Prime Bounce Zone Unlocked
🚀 ETHUSDT.P: Set to Explode - Don't Miss This Game Changer
🤖 IQUSDT: Smart Plan
⚡️ PONDUSDT: A Trade Not Taken Is Better Than a Losing One
💼 STMXUSDT: 2 Buying Areas
🐢 TURBOUSDT: Buy Zones and Buyer Presence
🌍 ICPUSDT.P: Massive Upside Potential | Check the Trade Update For Seeing Results
🟠 IDEXUSDT: Spot Buy Area | %26 Profit if You Trade with MSB
📌 USUALUSDT: Buyers Are Active + %70 Profit in Total
🌟 FORTHUSDT: Sniper Entry +%26 Reaction
🐳 QKCUSDT: Sniper Entry +%57 Reaction
📊 BTC.D: Retest of Key Area Highly Likely
📊 XNOUSDT %80 Reaction with a Simple Blue Box!
📊 BELUSDT Amazing %120 Reaction!
📊 Simple Red Box, Extraordinary Results
I stopped adding to the list because it's kinda tiring to add 5-10 charts in every move but you can check my profile and see that it goes on..

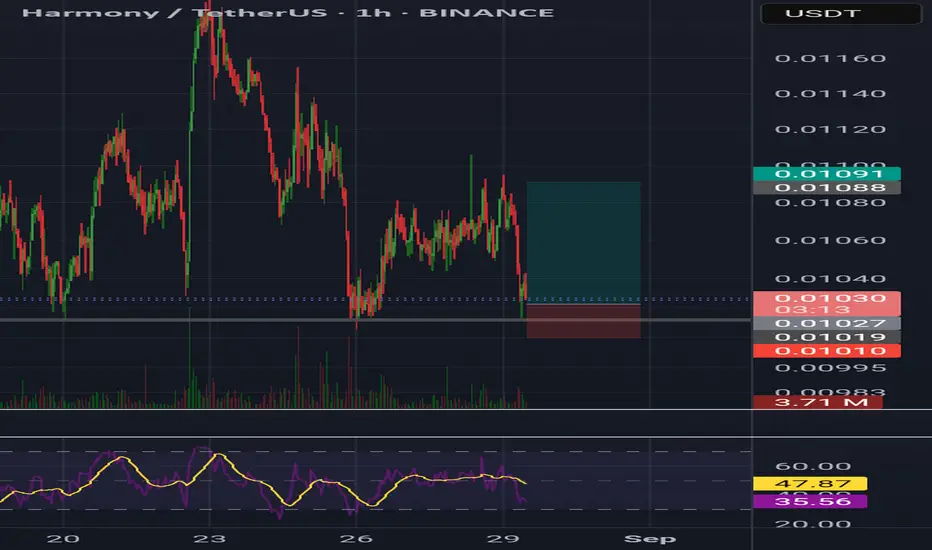
#ONE/USDT#ONE
The price is moving within a descending channel on the 1-hour frame and is expected to continue lower.
We have a trend to stabilize below the 100 moving average once again.
We have a downtrend on the RSI indicator, supporting the upward move with a breakout.
We have a resistance area at the upper limit of the channel at 0.01142.
Entry price: 0.01120
First target: 0.01091
Second target: 0.01057
Third target: 0.01006

ONE/USDT - Harmoney - 4th Uptrend is just startingBINANCE:ONEUSDT (1W CHART) Technical Analysis Update
ONE is currently trading at $0.01121 and showing overall bullish sentiment
if we look at the past chart, we see ranging market for ONE from past 2 years, the price has hit the accumulation zone and reversing from the zone.
In the past 3 times we saw significant increase in price after hitting the support zone, and we expecting similar move this time.
Entry level: $ 0.01121
Stop Loss Level: $ 0.00765
TakeProfit 1: $ 0.01368
TakeProfit 2: $ 0.01855
TakeProfit 3: $ 0.02727
TakeProfit 4: $ 0.03795
TakeProfit 5: $ 0.05691
Max Leverage: 2x
Position Size: 1% of capital
Remember to set your stop loss.
Follow our TradingView account for more technical analysis updates. | Like, share, and comment your thoughts.
Cheers
GreenCrypto

ONEUSDT 1WONE ~ 1W Analysis
#ONE Buy back from here if you still have a Conviction on this coin with a short -term target of at least 20%+.
