ONE consolidating before next legONE consolidating within 63-65 range before next leg. Within 2 days should breakout towards higher targets: 69 - 72 - 74 - 80.OLongby WiseAnalyze14
ONE/USDT (1D) Where Are the Targets? The price broke out from its falling channel and now moving toward the targets. Zones of support and resistance are on the chart. Good luck everyone! by SonicTrade12
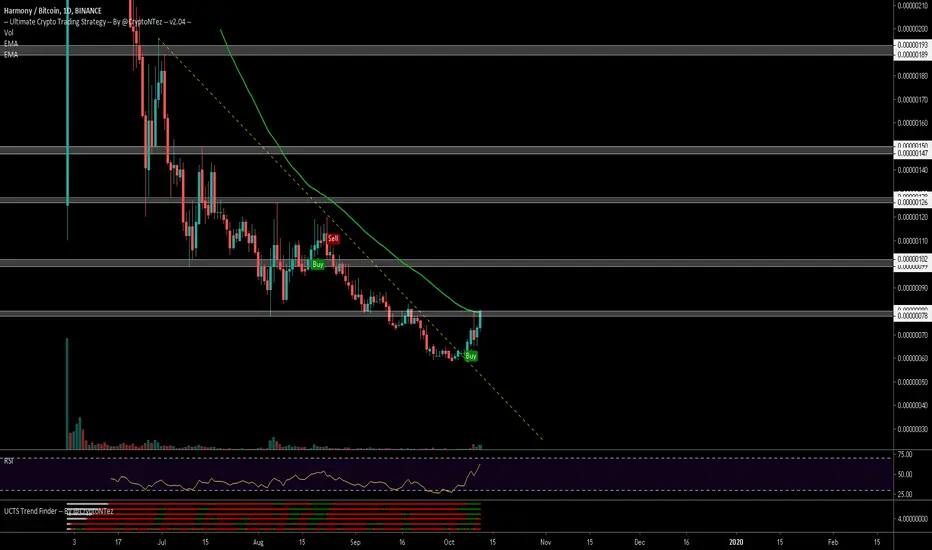
$ONE, Retesting crossed level at ~64sats matching EMA50$ONE Retesting crossed level at ~64sats matching EMA50 on the 12H chart If its able to hold/flip this level into support (4h already looking good..) we may aim for a new leg up with target at ~72sats (11%+) Make sure to use a SL under support level just in case! #ONEOby CryptoNTez14
$ONE, Crossed and trying to flip ~60 sats resistance level..$ONE Crossed and trying to flip ~60 sats resistance level.. Volume does not look that strong yet UCTS Starting to turn green on low TFs.. If it gets traction from here we may see a new retest of ~65sats level or even greater.. Tight SL just in case #ONEOby CryptoNTezUpdated 19
Bullish One White Soldier ConfirmedWIth OGI closing 4.17 in its previous session, the white candlestick opened above the previous day's close and closed above its open. Similar to a Bullish Harami pattern but with the second day closing higher, which stops the engulfing of the white body by the preceding red body. Short term traders will wait for a daily pullback to buy into strength with higher lows confirmed. More aggressive traders might want to look at other patterns to determine whether a large swing trade picking up the lows might be appropriate.Longby UnknownUnicorn24137211
Harmony ONE double bottom bounce ?Harmony ONE price action (PA) double bottom bounce at 65 sats. Potential target 93 sats 1.1618 fibs level. Harmony closed above EMA 21,50,100,200 periods Uptrend. Volume: confirm bullish price action. Patterns: Double Bottom at 59 and 65 sats. Indicators: MACD bullish crossover above zero line. RSI above 50 points. Bullish sign. S/R Majort Support 59 sats, Support 65 sats, Resistance psychology at 100 sats. Resistance 93 sats. Disclaimer: THIS IS NOT FINANCIAL ADVICE. All the information shared here is for learning and entertainment purposes only. OLongby blockchaintrends17
BUYSignal ONE/USDT BUY 'ONE/USDT' Entry Price : 0.00635 - 0.00620 TP1: 0.00660 TP2: 0.00680 TP3: 0.00690 - 0.007 Stop Loss : Below 0.00585Longby bitcoinatx3
$ONE, Pushing above ~78sats level (matching EMA50) w/ volume$ONE Pushing above ~78sats level (matching EMA50) w/ increasing volume (+600BTC binance 24hs) UCTS Buy signal active on the 1D as RSI quickly goes bullish Zooming in: I would to wait for a level flip prior taking a position here (if not looks like buying resistance) #ONEOby CryptoNTez11
Harmony (Oct 10) #ONE $ONE #BTC $BTCBuy : Close to 65 as possible Sell : 70-75-80 Mid-Hold : 90-100-120 Stop : 58OLongby CryptoStation5
uptrend for harmonyvolume looks nice and the price did a nice breakout after crossed the 64 sats. resistance level. Targets are 74 and 80 sats. stop level is under 64 sats.OLongby kronjxUpdated 117
$ONE has bottomed and should slowly start going up from here$ONE has bottomed and should slowly start going up from hereOLongby plebsoulix3
ONE Bullish Shark PatternSame like THETA. ONE/BTC forms Bullish Shark Pattern but we are waiting for bullish momentum from PRZ. Now we are in PRZ, so it is good opportunity to buy some tokens ;) Keeps wathing this coin, Targets, Stop Loss, Buy zone in chart.OLongby Tradify_Labs229
ONE/USDT (1D): We Are Moving in a Falling ChannelWe are moving in a falling channel. Safe pick up is from the middle of the channel. Zones of interest and targets are on the chart. Good luck everyone! Longby SonicTrade7
Harmony/Bitcoin (Sept 07) #ONE $ONE #BTC $BTCA tiny volume is coming to ONE but so low and it's not easy to pump ONE too high. But we can take risk with it! Buy : Close to 80sts as possible Sell : 90-100 Mid-Hold : 125-140-195 Long-Hold : 260-270 Stop : Under 78 Buy-back plan : 55OLongby CryptoStation115
MATIC/BTC & ONE/BTC & CELR/BTC Positive CorrelationAs you see in the chart, here we have a good positive correlation between these 3 charts. These are #Binance IEOs and move together. We have Specified 'Top' and 'bottom' with green and red arrows that are at a same time in these charts.MEducationby CentennialTrades1111
ONE (ONE/USDT, 1H): Found support on 0.2 global fibo levelONE exited a falling channel and found support on 0.2 global fibo level. Accumulation period was lasting for almost 1 month so far. Currently, the price is approaching the main support level. Whoever interested can find a good entry point here. In case we gonna break it down, we gonna go to the lower zones of interest. All support and resistance levels are indicated on the chart. Good luck everyone! DISCLAIMER: This is just my opinion and view of the market. Please keep this in mind and consider in your trades. Hit "Like" if you like my analysis. That would help me to understand if you really liked it :-) ! Trading ideas are not trading recommendations - this is just my point of view. You can agree or disagree with it. Your likes and comments really help me. So I thank everyone in advance who really does it! Subscribe if you would like to get my fresh updates on the market and my TA on a regular basis.Longby SonicTrade9
ONE/BTC (4H)The price came out of the falling channel. Right now its trying to form a local uptrend. Zones of interest and targets are on the chart. DISCLAIMER: This is just my opinion and view of the market. Please keep this in mind and consider in your trades. Hit "Like" if you like my analysis. That would help me to understand if you really liked it :-) ! Trading ideas are not trading recommendations - this is just my point of view. You can agree or disagree with it. Your likes and comments really help me. So I thank everyone in advance who really does it! Subscribe if you would like to get my fresh updates on the market and my TA on the regular basis. Good luck everyone!OLongby SonicTrade5
ICON trade with a good risk rewardICX broke out of accumulation zone and a while looked like a pump and dump pattern. Buyers stepped in and prevented the price from falling. 50% fib retrace level confirmed as support and 4h candle is now looking to close above the initial close. There is also a multi timeframe confirmation on the move, including 1d, 4h, 1h and also smal 30 and 15 min timeframes. CALCULATE YOUR RISK and this should be a good a good risk rewardILongby vaclavkhunUpdated 1
The only IEO left ready for take off ! One harmony pls. One harmony holding 115 nicely with volume doubled overnight. See you all on the moon. Should be moving soonish. The demons have bought ONE in my free discord you can join from twitter. OLongby AryanRehaan5
Symmetrical TriangleThe coin is making a new symmetrical triangle after breaking a previous one. It is in the breaking phase. It is currently on top of the EMA200 which reinforces the bullish idea.OLongby Henryksa4
one(harmony)one have imortant point=0.00000103 btc case 1(green way ): if one hold 0.00000103 btc then i expect taget 1=0.00000124 target 2=0.00000170 btc case 2(red way ): hf one break 0.00000103 then i expect one will go to 0.00000077 btc attention : i think case 1 is more possible. i suggest to buy at safe pointOby mohammad_raziUpdated 335