ONE/USDT at Edge: Bounce or Breakdown from Major Demand Zone?The ONE/USDT on the 1W (Weekly) timeframe shows a clear long-term bearish trend since the all-time high in 2021. Price has consistently formed lower highs and lower lows, confirming strong seller dominance over the past few years.
Currently, price is approaching a major historical demand zone, highlighted by the yellow block between 0.0024 – 0.0017, an area that previously triggered a strong bullish impulse.
---
Pattern & Price Structure
1. Long-Term Downtrend
Market structure remains bearish on a macro scale.
Every upward move has been a relief rally, failing to create a higher high.
2. Descending Structure Breakdown
Price has lost multiple minor supports, indicating progressive weakness.
Strong rejections from the mid-range supply area (around 0.01 – 0.02) accelerated the decline.
3. Major Historical Demand Zone
The 0.0024 – 0.0017 zone represents:
Previous accumulation area
Weekly historical support
Origin of a strong bullish move in the past
Price is now retesting this critical zone.
---
Key Levels
Major Resistance:
0.0050 – 0.0060
0.0090 – 0.0105
Major Support / Demand Zone:
0.0024 – 0.0017
Historical Extreme Low:
0.00118
---
Bullish Scenario
The bullish scenario is only valid if strong buying reactions appear inside the yellow zone:
Formation of:
Long lower wicks on weekly candles
Or a sideways accumulation base
No strong weekly close below 0.0017
Potential upside targets:
Short-term: 0.0050
Mid-term: 0.0090
Maximum relief rally: 0.015 – 0.02
➡️ This scenario represents a speculative bounce, not a confirmed trend reversal.
---
Bearish Scenario
The bearish scenario is confirmed if:
A strong weekly close below 0.0017
Failure of the historical demand zone
Increased selling pressure and breakdown momentum
Consequences:
Price may enter new low price discovery
No clear historical support below this level
High risk of continued downside
➡️ A breakdown here would signal market capitulation.
---
Conclusion
ONE/USDT is currently at a critical make-or-break technical level.
The 0.0024 – 0.0017 zone represents the last major weekly demand zone.
Aggressive buys are suitable only for high-risk traders
Conservative traders should wait for weekly confirmation
As long as price remains below key resistance levels, the primary trend stays bearish
---
#ONEUSDT #HarmonyONE #CryptoAnalysis #WeeklyChart #DemandZone #SupportResistance #BearishTrend #PotentialBounce #AltcoinAnalysis
Oneusdtanalysis

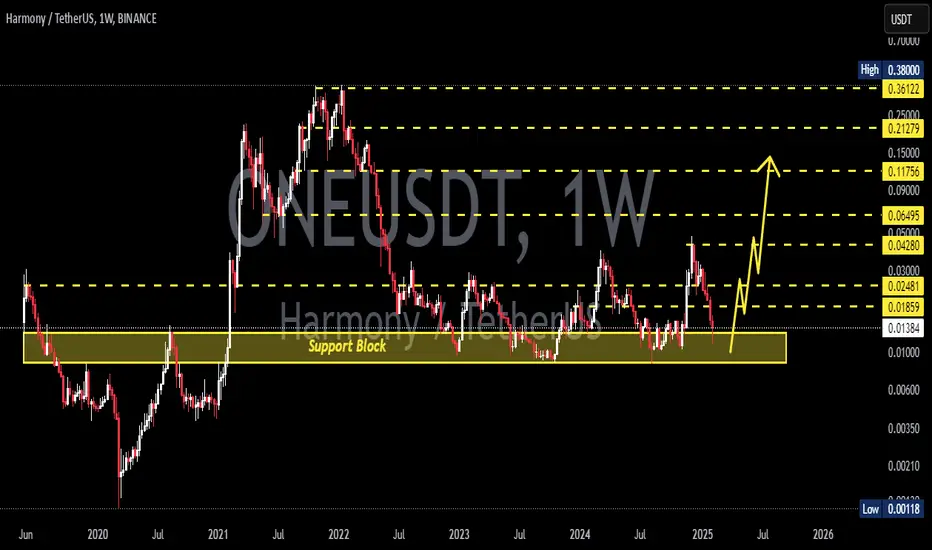
ONE/USDT – The Final Shakeout Before Reversal?The weekly chart of ONE/USDT tells the story of a full crypto market cycle:
from the euphoric highs of 2021 to a prolonged downtrend that has now brought price back into the historical accumulation zone between 0.0055 – 0.0042 — the same area that preceded ONE’s previous bull run.
The breakdown below 0.00915 triggered a wave of panic selling and swept deep liquidity, forming a massive lower wick that pierced the yellow demand zone.
Such movements often mark the capitulation phase, where retail traders capitulate and smart money begins accumulating silently beneath the surface.
---
Structure & Technical Overview
Macro trend: Strong multi-year downtrend with consistent lower highs and lower lows since 2021.
Key demand zone: The yellow block (0.0055 – 0.0042) acts as the last major demand zone and potential base for a new market cycle.
Candle behavior: The large wick suggests a liquidity grab — a common signal that downside exhaustion may be near if confirmed by a strong weekly close above the zone.
Major resistance levels: 0.0130 → 0.01625 → 0.0200 → 0.0240 → 0.0355 — these levels could serve as potential retest or breakout targets if a trend reversal occurs.
---
Bullish Scenario
Main condition: A weekly close back above 0.00915 would signal a key reclaim and potential structural reversal.
Confirmation signals: Rising buy volume and the formation of a higher low above the yellow zone.
Upside targets:
1. 0.0130 – first technical rebound level
2. 0.01625 – 0.0200 – mid-range supply zone
3. 0.0355 – macro target if reversal sustains
Bullish narrative:
“Smart money accumulates when fear dominates. The quiet phase of accumulation might already be underway.”
---
Bearish Scenario
Bearish confirmation: A weekly close below 0.0042 would confirm a full structural breakdown.
Next target: A continuation lower toward the psychological area of 0.0023, entering a deep undervaluation phase.
Bearish narrative:
“If the yellow zone fails, ONE could enter the final leg of its downcycle — a phase only the most patient investors endure.”
---
Strategy & Opportunity
Short-term traders: Wait for a confirmed reclaim above 0.00915 before considering long entries.
Long-term investors: The 0.0055 – 0.0042 range remains a potential accumulation area — but only with disciplined risk management below support.
Core principle:
“True reversals are not born from optimism, but from despair.”
---
Conclusion
ONE stands at a critical multi-year inflection point.
The 0.0055 – 0.0042 range represents the final battleground between capitulation and rebirth.
If the zone holds and price reclaims 0.00915, a new cycle could begin.
If it breaks lower, expect deeper undervaluation before the next accumulation phase forms.
The market is testing patience — separating believers from trend followers.
---
#ONEUSDT #HarmonyONE #CryptoAnalysis #AltcoinReversal #PriceAction #CryptoCapitulation #MarketCycle #TechnicalAnalysis #CryptoMarket #SupportResistance

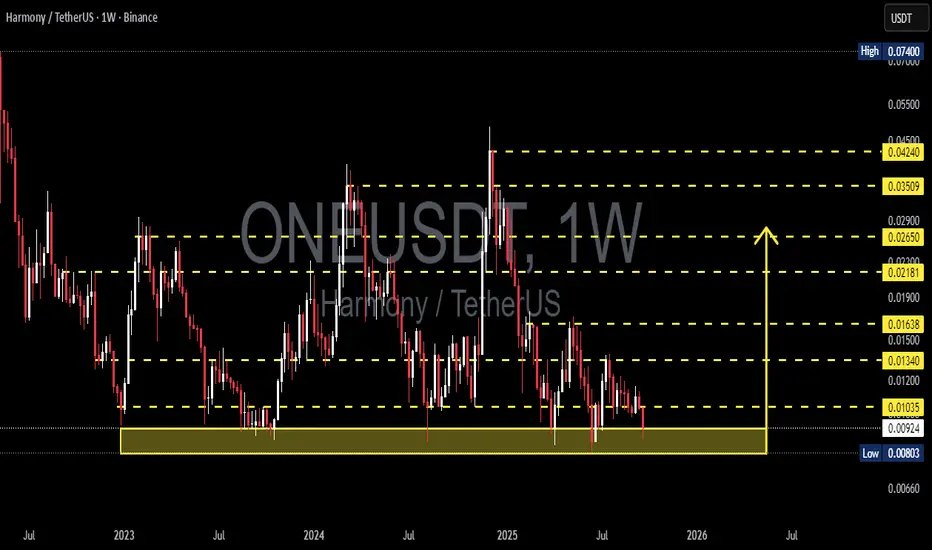
ONE/USDT — The Last Golden Zone: Bounce or Breakdown?Market Snapshot
Harmony (ONE) is currently sitting at a make-or-break level. On the weekly chart, price has reached the critical demand zone at 0.0080 – 0.0103 USDT (yellow box). This area has been tested multiple times since 2023, making it both a strong historical support and a fragile level under constant pressure.
In the past, sharp rejections (long lower wicks) from this zone have sparked significant rebounds. The key question now: will this zone hold again, or will we witness a confirmed breakdown that opens the door to deeper bearish territory?
---
Price Structure & Pattern
Consistent lower highs since mid-2024 → medium-term bias remains bearish.
The 0.0080–0.0103 zone has been tested several times → proven demand, but repeated tests weaken its strength.
Frequent long downside wicks → liquidity sweeps before rebounds, a sign of manipulation or false breaks.
Overall structure: sideways within a horizontal range, but with bearish undertone.
---
Bullish Scenario (Rebound Potential)
If the support zone holds:
Trigger: Weekly close above 0.01035 or bullish reversal candle (hammer / engulfing) around support.
Upside targets:
0.01340 (first resistance, ~+45%)
0.01638 (major resistance, ~+78%)
0.02181 (mid-term target, ~+137%)
If momentum and volume strengthen, further targets extend toward 0.02650 – 0.03500.
Note: Bullish bias remains valid only while weekly closes hold above 0.0080. The longer the zone holds, the stronger the chance of a breakout rally.
---
Bearish Scenario (Breakdown Risk)
If the 0.0080 support fails:
Trigger: Weekly close below 0.0080 with strong selling volume.
Downside targets:
0.00660 as next key support (~−28%).
Below that, psychological levels around 0.0050 may come into play.
Note: A confirmed breakdown here would be a major bearish signal, likely triggering panic selling.
---
Strategic Takeaway
ONE is now trading inside the last golden demand zone that could decide its long-term direction.
Bullish case: Bounce from support could target 0.013 – 0.016 first.
Bearish case: Breakdown below 0.0080 opens a path to 0.0066.
Key confirmation: Watch for weekly candle close and volume reaction — without them, moves may still be false breaks.
---
Harmony (ONE) is at a crucial turning point. The 0.0080–0.0103 demand zone has been a battlefield since 2023.
If bulls hold the line, we could see a rebound toward 0.0134–0.0163. But if sellers win and the level breaks, downside continuation toward 0.0066 is likely.
This is the make-or-break moment that will shape ONE’s trend in the coming months.
---
#ONE #Harmony #ONEUSDT #CryptoAnalysis #Altcoin #TechnicalAnalysis #SupportResistance #PriceAction #CryptoMarket
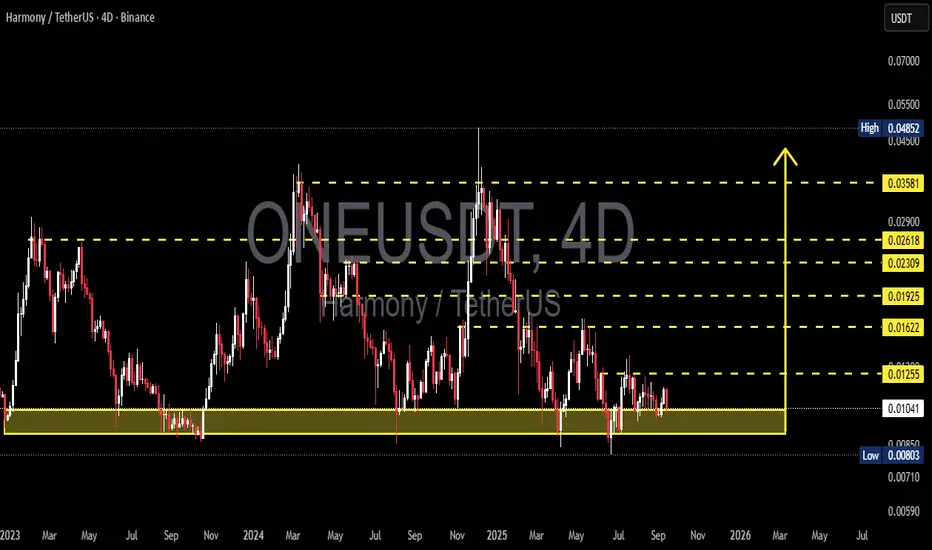
ONE/USDT — Critical Zone: Major Accumulation or Breakdown Ahead?📌 Overview
Harmony (ONE) is once again testing the multi-year support zone at 0.0078 – 0.0105 USDT, a level that has held the market multiple times since 2023. This zone acts as the last line of defense for the bulls, and the reaction here will determine whether we see a new accumulation phase or a deeper bearish continuation.
Since early 2024, price has been forming lower highs, reflecting ongoing selling pressure. However, the fact that this support continues to hold suggests possible accumulation behavior from long-term buyers.
---
🔎 Technical Structure
Historical Support Zone (0.0078 – 0.0105): retested several times, still holding.
Lower Highs: medium-term trend remains bearish.
Potential Double/Triple Bottom: if price defends this zone and breaks above 0.0125 – 0.0162, it could trigger a major reversal structure.
Key Resistances: 0.0125 → 0.0162 → 0.0192 → 0.0231 → 0.0261 → 0.0358.
---
🚀 Bullish Scenario
1. Support Bounce:
Strong rejection from 0.009 – 0.0105 could send price to 0.0125 (TP1).
Continuation targets: 0.0162 – 0.0192.
2. Confirmed Reversal:
A 4D/weekly close above 0.0162 would confirm a stronger trend reversal.
Upside targets expand toward 0.023 – 0.026 and potentially 0.035.
---
⚠️ Bearish Scenario
1. Breakdown of Support:
A 4D/weekly close below 0.0080 would invalidate the support and confirm bearish continuation.
Next downside target: 0.0059 – 0.0065.
2. Fakeout to the Upside:
If price rallies into 0.0125 – 0.0162 but fails to break through, sellers may regain control, sending price back into the support zone.
---
🎯 Trading Strategy (Example — not financial advice)
Conservative Long: accumulate at 0.009 – 0.0105, SL below 0.0076, TP1 0.0125, TP2 0.0162.
Aggressive Long (Breakout): enter on confirmed 4D/weekly close above 0.0162, targeting 0.019 – 0.026.
Short Setup: wait for a confirmed breakdown below 0.0080, target 0.0059 – 0.0065.
---
📊 Conclusion
ONE/USDT is currently at a make-or-break zone. This support area has historically attracted buyers and could mark the beginning of a larger accumulation phase. However, a breakdown would expose the market to a deeper decline.
Key takeaway: Watch the reaction around 0.0078 – 0.0105.
Strong rejection → accumulation and bullish momentum.
Breakdown → further downside pressure.
---
ONE/USDT — Accumulation or Breakdown?
Price is retesting the multi-year support zone (0.0078–0.0105).
📈 Bullish case: rebound toward 0.0125–0.0162, confirmation above 0.0162 → targets 0.019–0.026.
📉 Bearish case: breakdown below 0.0080 → downside targets 0.0059–0.0065.
This is a critical decision zone for ONE — accumulation or further decline.
#ONE #Harmony #ONEUSDT #CryptoAnalysis #SupportResistance #CryptoTrading #Altcoins #PriceAction
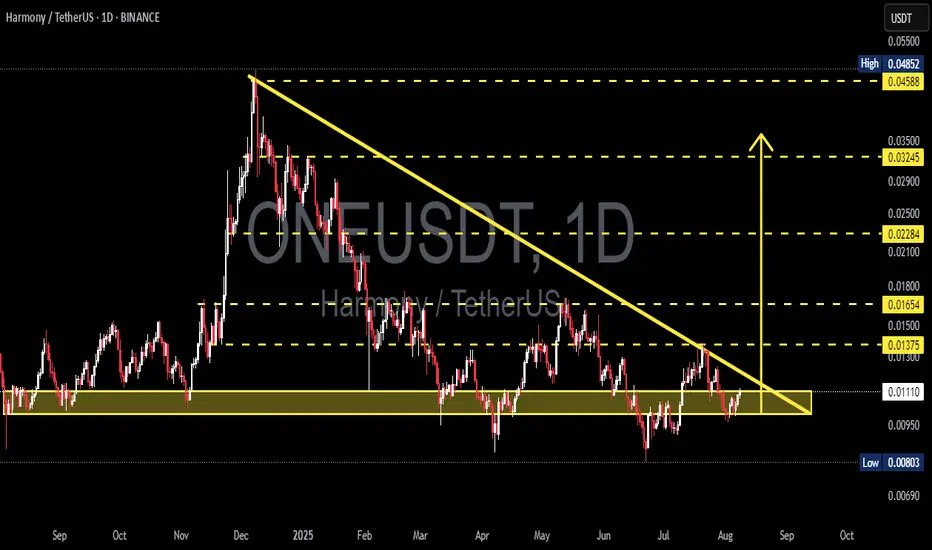
ONE/USDT — Breakout or Breakdown Ahead?📊 Complete Analysis of ONE/USDT (1D)
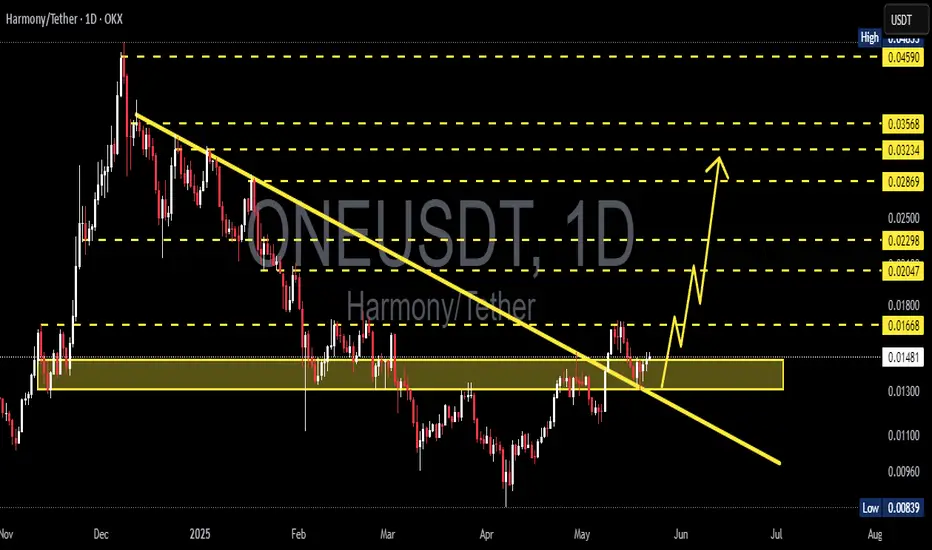
ONE is currently trading around $0.0111, sitting right at a critical junction between the major support zone ($0.0095–$0.0115) and a descending trendline that has been pressing price down since the December–January peak.
This setup forms a descending triangle pattern — typically a bearish continuation pattern, but under certain conditions it can flip into a strong bullish reversal if price breaks upward with volume.
---
🔍 Technical Details & Pattern
Primary Trend: Bearish since the late 2024 peak, with consistent lower highs.
Key Support Zone: $0.0095–$0.0115 (historical demand zone, tested multiple times since September 2024).
Dynamic Resistance: Descending trendline connecting lower highs.
Important Horizontal Levels:
$0.01375 → Nearest breakout confirmation resistance.
$0.01654, $0.02284, $0.03245, $0.04588 → Potential mid-term upside targets.
$0.00803 → Nearest low and first breakdown target.
Volume Factor: Breakout or breakdown must be confirmed by high trading volume.
---
🟢 Bullish Scenario (Breakout Upward)
If price breaks and closes daily above the descending trendline and clears $0.0138, the likelihood of a reversal increases.
Potential upside targets:
1. $0.0165 → Psychological resistance & minor supply zone.
2. $0.0228 → Major resistance and previous distribution area.
3. $0.0324–$0.0458 → If momentum extends further.
Strategy:
Enter after breakout + successful retest as new support.
Stop loss below $0.0095 to avoid fakeouts.
Watch for volume: without strong volume, risk of a bull trap is high.
---
🔴 Bearish Scenario (Breakdown Lower)
If price breaks and closes daily below $0.0095, the descending triangle pattern confirms as a bearish continuation.
Potential downside targets:
1. $0.00803 → Significant low and possible bounce area.
2. $0.0069 → Historical lowest level since 2023.
3. Below $0.0065 → Potential new lows if selling pressure escalates.
Strategy:
Enter after breakdown + failed retest above $0.0095.
Stop loss above $0.012–$0.013 to avoid short squeezes.
Adjust position size — volatility can spike sharply post-breakout.
---
📌 Key Points to Monitor
Convergence of Buyers & Sellers: The closer price moves toward the triangle’s apex, the higher the chance of a breakout in either direction.
Lengthy Consolidation: Post-breakout moves are often stronger after extended consolidation.
Risk Management: Avoid going all-in before confirmation; consider scaling entries.
Market Sentiment: Watch BTC & ETH — a bearish macro crypto environment increases the risk of a downside move.
---
📍 Conclusion
ONE/USDT is currently at a make-or-break zone.
📌 Bullish breakout → Potential rally toward $0.0165+
📌 Bearish breakdown → Likely drop toward $0.0080 or lower.
Traders should wait for daily close confirmation + strong volume to reduce false breakout risk.
The $0.0095–$0.0115 zone is the last major defense line for buyers in the medium term.
#ONEUSDT #HarmonyONE #CryptoAnalysis #TechnicalAnalysis #PriceAction #DescendingTriangle #Breakout #Breakdown #Altcoins #CryptoTrading
ONEUSDT at Make-or-Break Zone Major Reversal or Breakdown Ahead?📌 Overview:
ONEUSDT is currently sitting at a major historical support zone around $0.0080–$0.0093 (highlighted in yellow).
📉 This level has been tested multiple times since 2022, and continues to hold – signaling strong accumulation and potential for a major reversal.
🧠 Key Pattern in Focus:
✅ Triple Bottom Pattern
The Triple Bottom is a classic bullish reversal pattern, reflecting the strength of buyers after multiple failed attempts to break the support.
🔁 It’s typically followed by a surge in momentum if a breakout confirms the reversal.
🚀 Bullish Scenario (Reversal in Play):
🔸 Condition: Price holds above $0.0080 and begins forming higher lows.
🔸 Confirmation: A breakout and retest above the $0.01258 resistance level.
🎯 Upside Targets: 1️⃣ $0.01258 → Minor Resistance
2️⃣ $0.01644 → Previous structure high
3️⃣ $0.02285 → Major supply zone
4️⃣ $0.03530 → Psychological and technical target
🔍 With strong bullish momentum and volume support, a mid-term move toward $0.04900+ is possible.
🛑 Bearish Scenario (Breakdown Risk):
🔻 Condition: Price breaks down below $0.0080 with strong volume.
🔻 Risk: No clear support below this level → price could enter uncharted territory or set new All-Time Lows.
📉 Indicates complete seller dominance and failed demand structure.
🔍 Conclusion:
ONEUSDT is at a critical inflection point – a strong rebound opportunity or a breakdown toward new lows.
📌 Price action over the coming days will be key in determining the mid-term trend.
📈 Aggressive traders may look for early entries, while conservative traders should wait for breakout confirmation.
📢 Extra Notes:
🔔 Confirmation is key for this setup.
💡 Combine with indicators like RSI, MACD, or Volume Profile for added confluence.
⚠️ Risk management is essential — stop loss below $0.0080 recommended for long entries.
#ONEUSDT #HarmonyONE #CryptoBreakout #TripleBottomPattern #BullishSetup #AltcoinAnalysis #CryptoReversal #SupportZone #BreakoutZone #TechnicalAnalysis

ONEUSDT 5D AnalysisONE ~ 5D Analysis
#ONE Buy back gradually from here if you still have confidence in this coin with a short term target of at least 20%+ from this support.

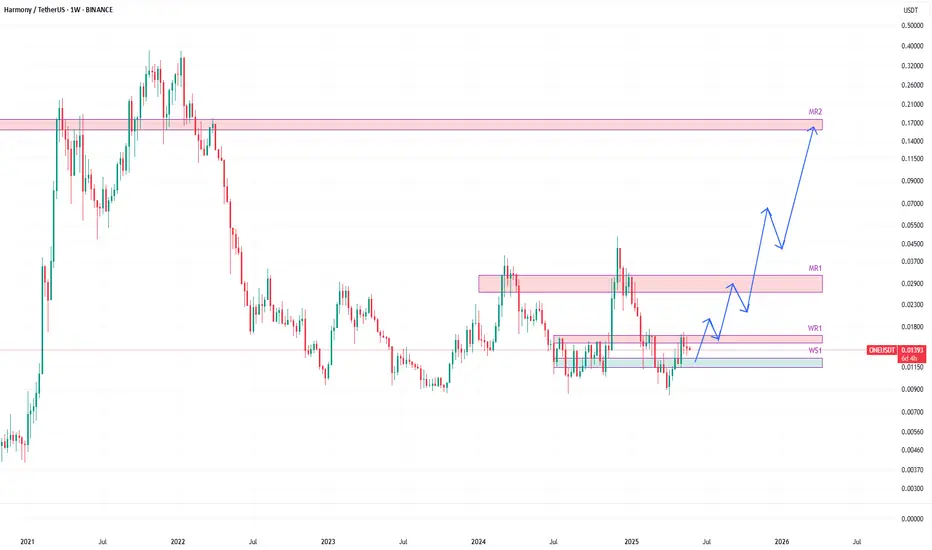
ONEUSDT likely to head towards 0.16 zoneONEUSDT is another one trading between weekly resistance WR1 and weekly support WS1.
The price has been retracing back to WS1 after hitting WR1. It is likely to hit WS1 before having a bounce.
WS1 is likely to provide a good bounce and the fuel for its upward journey in coming weeks and months.
The future of this one looks quite promising.
The price is likely to break WR1 on the next bounce from WS1 and likely to continue its journey towards monthly resistance MR1.
With some pullbacks here and there on various resistance milestones, the price is likely to aim for monthly resistance MR2.
ONEUSDT 1D AnalysisONE ~ 1D Analysis
#ONE Buy gradually from here with a short-term target of at least 10%++ from here.
ONEUSDT 1WONE ~ 1W Analysis
#ONE Buy back from here if you still have a Conviction on this coin with a short -term target of at least 20%+.

ONEUSDT 1WONE ~ 1W Analysis
#ONE This support block continues to be maintained so far. Buy from here with a minimum target of 20%+
ONE 900% potential BINANCE:ONEUSDT
Possible Targets and explanation idea
➡️Would like to see drop to 0.5 of M FVG
➡️After retest of FVG we can see uptrend to First M Bullish FVG around 900%
➡️On Monthly timeframe ADZ indicator in biggest accumulation stage ever
Hope you enjoyed the content I created, You can support with your likes and comments this idea so more people can watch!
✅Disclaimer: Please be aware of the risks involved in trading. This idea was made for educational purposes only not for financial Investment Purposes.
---
• Look at my ideas about interesting altcoins in the related section down below ↓
• For more ideas please hit "Like" and "Follow"!

10x on Harmony!Harmony is keep making higher high's in 1W timeframe, so that means in longer run chart is still bullish and we have to look for entries. What BINANCE:ONEUSDT doing is hanging above minor support which is a good sign, but what I would like to see is breaking this support and close a candle below it. That is the perfect position to enter Long-position.
ONEUSDT 1WONE Update ~ 1W
#ONE If you still have Conviction on this coin,. This support block is a very good place to start buying gradually, with a target of at least 20%++
ONEUSDTONE ~ 1W
#ONE Back to retesting this support block. if you have Conviction on this coin,. Maybe placing a purchase here is good enough for the short term at least 20%++

ONEUSDTONE ~ 1W ✅
#ONE It is very interesting to see this Chart. This is a support block that might hold the price from falling any lower.
Maybe placing a small purchase here is good enough for now.

ONE / ONEUSDTWe have two scenarios for the price, the first is that we are in an upward correction wave and then the price falls again. Second, the price is in a fourth corrective wave and still has more to fall, then the price rises again.
Good Luck >>
• Warning •
Any deal I share does not mean that I am forcing you to enter into it, you enter in with your full risk, because I'll not gain any profits with you in the end.
The risk management of the position must comply with the stop loss.
(I am not sharing financial or investment advice, you should do your own research for your money.)

ONEUSD 1WONE ~ Updated
#ONE Don't miss BINANCE:ONEUSD , Pump is coming soon. it's just a matter of time.

ONEUSD 1WONE ~ 1W
#ONE Retesting successful. Make purchases gradually from here, with a minimum target of 15%++

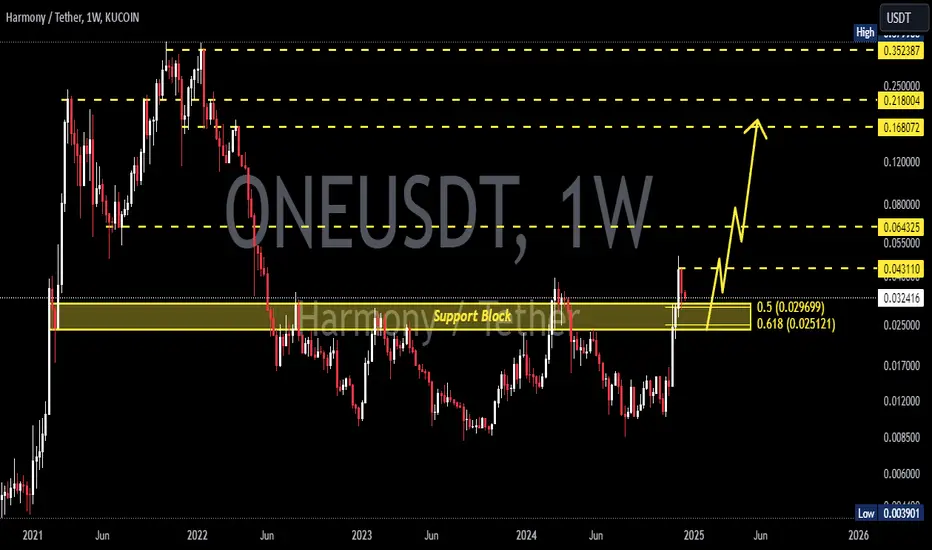
ONE target 0.024 $ 0.051D time frame
-
ONE is consolidating under the long-term downtrend, and retesting the 0.618 Fibonacci Retracement, so here is a good timing to set up a perpetual trading plan with 3.6 RR. Also, there is a strong support on higher time frame around 0.008~0.010, this is a great zone to accumulate spot if ONE come back again in future. Therefore, I provide two trading plans for perpetual and spot.
-
Perpetual:
TP: 0.024 / 0.031
SL: 0.0119
Spot:
TP: 0.05
SL: 0.0079

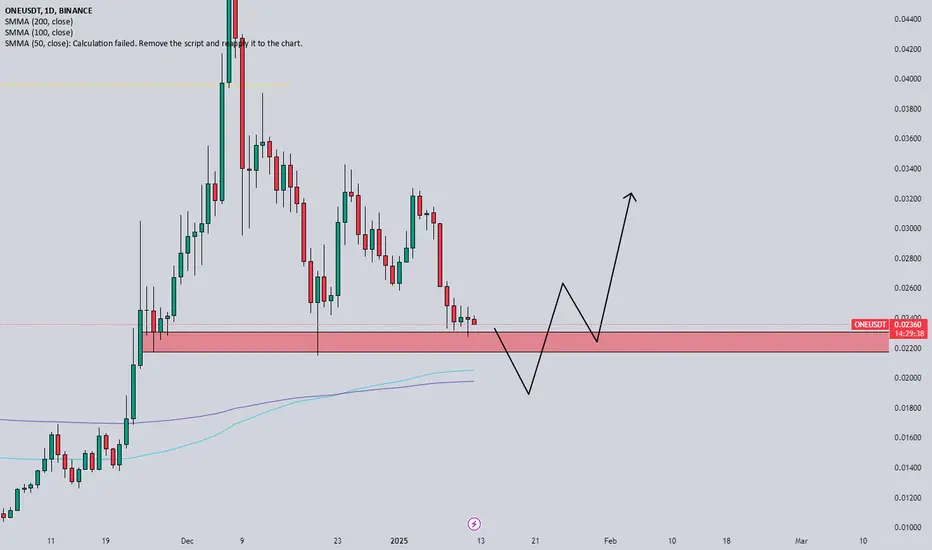
ONE target 0.034h time frame
-
ONE gets support from the uptrend since Oct '23, and this is a reasonable retest zone after ONE broke out the long-term downtrend on Dec '23. According Fibonacci tools, we have three targets, 0.03, 0.038 and 0.048.
-
TP: 0.03 / 0.038 / 0.048
SL: 0.01397

ONE → Major Rip and now Major Dip? This Analysis Clears it up.ONE (Harmony) had a fantastic move to the upside and per my last analysis, we capitalized on it. We have now come into contact with the downward-sloping resistance on the Weekly timeframe. Is it time to short?
How do we trade this? 🤔
Short answer, almost. The downward-sloping resistance is a major data point in this analysis, coupled with the two failed attempts to break it, the strong bull capitulation candle and the RSI falling below the Moving Average, we have a case for a short entry.
Wait for the price to come down to the 30EMA, it's likely to find support and come back up a bit. Then wait for a good sell signal between $0.018 and $0.019, that's your queue to enter. The other major factor is Bitcoin's next move which has a good probability of falling below $40,000.
💡 Trade Ideas 💡
Short Entry: $0.019
🟥 Stop Loss: $0.024
✅ Take Profit: $0.014
⚖️ Risk/Reward Ratio: 1:1
🔑 Key Takeaways 🔑
1. Double Top Reversal at Downward Resistance. Bias to Short.
2. Look for Bounce at 30EMA followed by another Rejection.
3. Bull Capitulation to Downward Resistance, Sell Signal.
4. RSI at 60.00 and Below Moving Average, Supports Downward Movement.
5. Bitcoin may be Reversing, Could pull Down ONE Price.
💰 Trading Tip 💰
Resistance on higher timeframes carries more significance with respect to probability on lower timeframes. Combined with sell signals and three pushes up on a lower timeframe, there's enough probability to justify looking for a reversal trade.
⚠️ Risk Warning! ⚠️
Past performance is not necessarily indicative of future results. You are solely responsible for your trades. Trade at your own risk!
Like 👍 and comment if you found this analysis useful!

ONE target 0.051D time frame
-
ONE is breaking out the long-term downtrend with an obvious bottom zone around 0.009. What it need is more volume to push price higher, that would be a perfect breakout. Also, we use Fibonacci Extension and structural resistance to set targets as below.
-
TP: 0.038~0.04 / 0.05
SL: 0.01612
